


1. Background
Chronic kidney disease (CKD) is one of the most common chronic diseases in the world (1). Chronic kidney disease is a progressive disease, which leads to end-stage kidney disease (ESKD) (2). Among the treatment modalities for ESKD, hemodialysis is considered the mainstay of dialysis treatment for renal failure (3, 4). Based on data from the Indonesian Renal Registry, the prevalence of hemodialysis patients in 2015 increased four times compared to 2007 (5). Hemodialysis can increase the life expectancy of ESKD patients; however, their quality of life (QoL) will decline in the long term (6).
The QoL is defined as an individual’s perception of their own well-being. Therefore, QoL is subjective to each individual. It has several components, including physical, functional, psychological, and the ability to work or to do activities (7). Quality of life in ESKD patients can be assessed using Kidney Disease Quality of Life Short Form-36 (KDQOL SF-36). This instrument has been validated in Indonesian with alpha Cronbach of 0.78 (8). In the United States, the QoL of ESKD patients is lower than the normal population in which the mean physical score before hemodialysis was 31.1 ± 1 and after hemodialysis was 35.2 ± 0.6 (standard reference score was 50). The mean mental component score before hemodialysis was 44.8 ± 1.2, and after hemodialysis was 47.9 ± 0.7 (standard reference score was 50) (9).
The effect of nutrition on the QoL of end-stage renal disease (ESRD) patients has been investigated for a long time. Based on previous studies, higher body mass index (BMI) is associated with higher QoL. This phenomenon is also known as “the obesity paradox” (10, 11). However, other studies suggested that it is lean body mass (LBM) that has a positive effect on the QoL. Meanwhile, patients with higher BMI and fat content have a higher mortality rate (12).
Since the late 90s, dual-energy X-ray absorptiometry (DEXA) has been validated as the gold standard for measuring body composition (BC) by comparing chemical analysis, and anatomy-based imaging methods (CT or MRI) (13, 14). Bioimpedance analysis (BIA) is a non-invasive testing method that allows accurate analysis of body composition using the electrical resistance of various body tissues (15). The BIA is a less expensive, more accessible, and more accurate method of determining LBM than the gold-standard examination, DEXA.
2. Objectives
In this study, we aimed to analyze the relationship between body composition evaluated using BIA and QoL in the maintenance hemodialysis patients.
3. Methods
This is a cross-sectional study that was conducted in Hemodialysis Unit, Division of Nephrology and Hypertension, Dr. Cipto Mangunkusumo General Hospital, Jakarta. The population of this study consisted of 102 ESRD patients who underwent maintenance hemodialysis. The inclusion criteria included patients who were willing to participate and signed the consent, underwent routine hemodialysis twice a week with a duration of 4 - 5 hours/session for at least 3 months, were conscious and cooperative, and were able to read and write, or had relatives who could read for them.
The exclusion criteria were patients with decreased conditions (such as hemodynamic instability, severe heart failure, severe infection, or received intensive care), patients who had other chronic diseases (HIV, decompensated cirrhosis, cancer, stroke, CHF NYHA functional class III-IV), also patients who had difficulty in understanding the questionnaire. All subjects were interviewed for their basic personal information and medical history. A physical examination, including vital signs and general status, was performed. The subjects were then asked to fill in KDQOL SF-36 version 1.3.
Anthropometric profiles of the subjects, such as height, weight, and BMI were measured. Body composition was measured using multifrequency bioimpedance analysis. Free fat mass was measured using the following formula: 100% - fat percentage that was measured by multifrequency BIA. Free fat mass percentage, overall KDQOL score, as well as physical component score (PCS) and kidney-related component score (KDCS) (laboratory parameters) were analyzed using Pearson correlation test. As for mental component score (MCS), statistical analysis was performed using the Spearman correlation test because the data distribution was not normal. Fat percentage (< 20%, 20 - 30%, > 30%) and KDQOL score were analyzed using ANOVA test followed by a post hoc LSD test.
4. Result
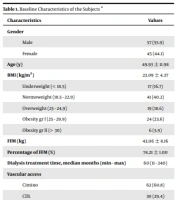
This study recruited 102 subjects that met the inclusion and exclusion criteria. Table 1 summarizes the study’s baseline characteristics.
| Characteristics | Values |
|---|---|
| Gender | |
| Male | 57 (55.9) |
| Female | 45 (44.1) |
| Age (y) | 49.93 ± 11.98 |
| BMI (kg/m2) | 23.09 ± 4.37 |
| Underweight (< 18.5) | 17 (16.7) |
| Normoweight (18.5 - 22.9) | 41 (40.2) |
| Overweight (23 - 24,9) | 19 (18.6) |
| Obesity gr I (25 - 29.9) | 24 (23.6) |
| Obesity gr II (> 30) | 6 (5.9) |
| FFM (kg) | 43.06 ± 8.16 |
| Percentage of FFM (%) | 74.21 ± 1.00 |
| Dialysis treatment time, median months (min - max) | 60 (11 - 240) |
| Vascular access | |
| Cimino | 62 (60.8) |
| CDL | 30 (29.4) |
| Femoral access | 10 (9.8) |
| Underlying disease | |
| Hypertension | 34 (33.3) |
| Glomerulonephritis | 33 (32.35) |
| Hypertension and diabetes | 16 (15.68) |
| Diabetes | 12 (11.76) |
| Others (stones, pyelonephritis, polycystic) | 7 (0.68) |
Abbreviations: BMI, body mass index; FFM, free fat mass; CDL, catheter double lumen.
a Values are expressed as No. (%) or mean ± SD unless otherwise indicated.
Table 2 shows the statistical analysis of free fat mass (FFM) percentage and QoL in ESRD patients. Analysis was also performed for each component of KDQOL (PCS, MCS, and KDCS). No statistically significant correlation was observed between the percentage of FFM and all components of QoL. However, there is a statistically significant correlation between PCS and FFM (r = 0.223, showing a weak correlation, P = 0.024). Other components showed no significant correlation with FFM.
Abbreviations: KDQOL, kidney disease quality of life; FFM, free fat mass; PCS, physical component score; MCS, mental component score; KDCS, kidney disease related component score.
a Values are expressed as mean ± SD unless otherwise indicated.
b Pearson test
c Significant with P < 0.05
d Spearman test
Table 3 shows the correlation between actual muscle mass and QoL in ESRD patients. Analyses were performed for all KDQOL, PCS, MCS, and KDCS. None of the analyses showed a significant statistical correlation. However, there was a tendency for a positive correlation between muscle mass and PCS scores with r = 0.189 and P = 0.052.
Abbreviations: KDQOL, kidney disease quality of life; PCS, physical component score; MCS, mental component score; KDCS, kidney disease related component score.
a Values are expressed as mean ± SD unless otherwise indicated.
b Pearson test
c Spearman test
5. Discussion
End-stage kidney disease requires a long and complicated procedure of monitoring and treatment (16). Physical difficulties such as anemia, comorbidities, malnutrition, elevated creatinine and albumin levels, psychological issues such as depression and sleep disorders, and social issues such as loss of independence, the role of changes, and deterioration in family QoL can all occur in patients with ESKD (17). The Kidney Disease Quality of Life-36 (KDQOL-36) is an instrument used to measure the QoL of CKD patients undergoing routine hemodialysis. Kidney Disease Quality of Life Short Form-36 is extensively used, brief, and easily accessible (18). The score will have three domains, namely PCS, MCS, and KDCS. The Indonesian version of KDQOL SF-36 has been validated by Jos (8). with the alpha Cronbach coefficient of 0.78.
In the present study, the mean ± SD overall KDQOL score was 47.86 ± 6.56. This score is lower than that obtained in Saudi Arabia (60.4 ± 27.3) (19). However, the result needs to be investigated further as there is no currently accepted overall KDQOL-36 score that combines all of its components (20). PCS appeared to have the lowest mean score in the subcomponent analysis of KDQOL (40.97 ± 9.66). The mean ± SD score of PCS is similar to a study in the United States by Porter et al. (21) (41.3 ± 11.5) and Jos (8) in north Borneo, Indonesia (38.51 ± 8.57). Compared to the MCS and KDCS scores, PCS showed the lowest average score. This result corresponds to a study by Hall et al. (22), where the average MCS score exceeded PCS quite significantly (50.9 vs. 34.5). Psychologically, ESKD patients will grow to accept their health conditions and adapt over time. On the other hand, their physical health will decline. Thus, explaining why PCS scored lower than MCS (8, 23).
Malnutrition diagnosis may be difficult and inaccurate in chronic renal patients due to the existence of comorbidities and chronic inflammation (24-26). Studies have looked into the importance of body composition in terms of fat mass (FM) and FFM, as well as the relationship between the two and mortality (27, 28). In patients with ESKD, a decrease in LBM is an essential sign of malnutrition (29), and it was discovered that FM plays a protective function in hemodialysis patient mortality (30). Simple, reliable, and inexpensive protocol is needed to evaluate the nutritional status of ESKD patients in clinical practice (31). The National Kidney Foundation’s Kidney Disease Outcomes Quality Initiative (NKF-KDOQI) considers DEXA the standard reference indicator for estimating body composition and bone mineral density (32). However, due to the high cost and the need for installation, and a large space for the equipment, its usage in clinical practice is limited (33). The BIA is a less expensive, more accessible, and more accurate method of determining LBM than DEXA.
In this study, we found no significant correlation between the percentage of FFM and overall KDQOL score, as well as the percentage of FFM and PCS score (P = 0.968 and P = 0.873, respectively). Post hoc analysis based on the subject percentage of fat (< 20%, 20 - 30%, and > 30%) also showed no significant correlation. Obesity is associated with a higher risk of cardiovascular disease (CVD) and mortality; however, previous studies reported the protective effects of BMI to lower mortality and increase the QoL in ESKD patients. The phenomenon is called the obesity paradox (10, 11). In contrast to the apparent benefit of FFM in ESKD patients, the effect of fat tissue is still debatable. In our study, the fat proportion does not show a significant correlation with the overall QoL and physical quality of ESKD patients.
We found no significant correlation between FFM and the overall KDQOL score. However, subcomponent analysis revealed a significant correlation between FFM and PCS (r = 0.223, P < 0.05). Wang et al. (34) reported that LBM was inversely correlated with mortality. Martinson et al. (35) revealed that a bigger mid-thigh muscle area (MMA) correlated with better physical function and QoL in ESKD patients undergoing hemodialysis. The BMI, waist circumference, and abdominal fat increase the survival rate but decrease the physical function evaluated by the 6-minute walk test. Patients with higher FFM have more protein reservoir, making them have better health and QoL. Although no statistical significance is found, we can see that a higher muscle mass have a trend toward positive correlation to PCS (r = 0.189, P = 0.052) and KDCS (r = 0.151, P = 0.130). This might be the cause of a significant positive correlation of actual FFM with PCS stated above, as the more actual FFM the patients have, the more muscle mass they will have.
5.1. Conclusions
The percentage of FFM and percentage of fat showed no significant correlation with the overall QoL and physical quality of ESKD patients. However, absolute FFM (in kg) shows a significant correlation with physical component of KDQOL in ESKD patients who undergo routine hemodialysis. Despite not showing a statistically significant correlation with KDQOL, actual muscle mass showed a trend toward a significant correlation with PCS score. According to this study, we suggest ESKD patients may be given muscle training programs to increase their physical quality. We also suggest incorporating muscle function and strength for future studies.
