.png)


1. Background
Cardiovascular diseases (CVDs) are one of the world’s top three causes of mortality, accounting for about one-third of all deaths worldwide (17.3 million deaths) in 2013, which is more than the combination of communicable, maternal, neonatal, and nutritional disorders mortality rates, and two-folds the number of deaths caused by cancers (1, 2). In the United States, CVDs are responsible for one death every 40 seconds, causing more than 2200 Americans' deaths each day (3). In Europe, CVDs cause more than four million deaths each year, accounting for 45% of all deaths, with large differences in disease burden among countries in the European Region (4). In addition, the incidence and mortality rates of CVDs are anticipated to rise by 2020, especially in developing countries (5). Among Asian countries, central Asian countries have the highest age-adjusted mortality rate from CVD, followed by west Asian, south Asian, and south-east Asian countries (6). In Iran, the annual mortality rate of ischemic heart disease (IHD) in the population over 40 years old is estimated at 14 per 1000 persons (7).
In European countries, the prevalence of CVDs in the general population was 9.2% in 2016, same for both sexes (4); meanwhile, about one-fifth (21.3%) of patients referring to England's primary care suffered from CVDs, according to the reports in 2018 (8). The different incidence rates of CVDs is attributed to the different prevalence of the risk factors of CVDs in the target population among various countries or between men and women (9). Besides age, which serves as a significant risk factor, dyslipidemia, hypertension, diabetes mellitus, obesity, and smoking are considered the main modifiable risk factors for CVDs (10).
According to evidence, controlling these risk factors, especially simultaneously, can effectively prevent or slow the disease, especially in high-risk patients (11, 12). In a large cohort study (the SCORE project), Conroya et al. developed a risk assessment chart for the estimation of 10-year risk of CVDs based on age, sex, systolic blood pressure (SBP), serum level of cholesterol, and smoking status (13). In 2008, the Framingham Heart Study developed a CVD risk score of men and women based on age, serum levels of high-density lipoprotein (HDL) and total cholesterol, treated and untreated SBP, smoking status, and diabetes (14). Gaziano et al. considered a combination of risk factors and developed a chart for calculating the absolute risk of the 5-year probability of CVD (15-18). Cardiovascular diseases risk scores have been assessed by laboratory methods in Iran (19-21), while the non-laboratory risk score assessment, developed by Gaziano et al., is a more simple method with similar values, and thus, can be used as an appropriate alternative (15).
The risk assessment of non-laboratory CVDs is highly correlated with laboratory scores, and the number of high-risk individuals identified by laboratory assessment has been very close to the number of individuals identified by non-laboratory assessment. Therefore, the risk assessment of non-laboratory CVDs can be implemented in the community (16, 17).
2. Objectives
As the validity of non-laboratory method for CVDs risk assessment has not been evaluated in an Iranian population, the present study aimed to investigate the non-laboratory risk of CVDs in an Iranian population by in-person interviews conducted by medical students at Tehran metro stations.
3. Methods
3.1. Study Design
In this cross-sectional study, the CVD risk of the general population was assessed by medical students. The study protocol was approved by the Ethics committee of Iran University of Medical Sciences research center, and all ethical considerations were observed throughout the study steps.
The sample size was considered as many people who were present at the selected stations, met the inclusion criteria, and gave consent to participate in the study during the collection day; 800 medical students, who were fluent in Persian, were selected from four universities and included in the study voluntarily. Before starting the study, they were trained for 10 - 15 minutes on how to run the survey. Then, all the medical students visited 95 metro stations in Tehran city from 8 am to 4 pm in March 2020. All the metro stations of Tehran were selected. The inclusion criterion for this study was age range of 35 - 74 years. The exclusion criterion was patients with a positive history of diabetes, hypertension, and CVDs. The student chose any passenger who had the mentioned criteria and asked for their consent for participation in the study. First, the students described the study objectives to the passengers, in brief, asked them the questions on the study checklist, and continued sampling until saturation of the sample size.
The designed checklist recorded demographic characteristics of the participants, including age, gender, smoking status, exercise status, and family history of hypertension, cardiovascular diseases, and diabetes. The current smoking status was recorded as “Yes” or “No”; smokers who had quitted for more than five years were considered nonsmokers. Participants’ exercise status was considered as “Yes”, when the individual had at least one hour of exercise three times a week. The participants' weight and height were measured, and their body mass index (BMI) were calculated; also, their SBP was measured from the participants’ left hand in the sitting position after 15 minutes’ rest.
3.2. Risk Score Chart
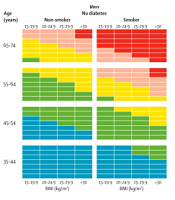
The risk of cardiovascular diseases was categorized into low or blue (< 10%), some risk or green (10 - 20%), moderate or yellow (21 - 30%), increased or pink (31 - 40%), and high or red (> 40%) based on the risk scoring chart, described by Gaziano et al. in Lancet journal (15). This chart scores the participant’s risk based on their sex, age, current smoking status, and SBP, and the final risk is determined based on the relevant cell’s color. As we additionally evaluated participants’ exercise status and family history of relevant diseases, we examined the association of the risk scores with all the studied characteristics. Participants with high and increased risk scores were advised to refer to a physician as soon as possible. Gaziano et al.’s chart for calculating the five-year probability of CVD is shown in Figure 1.

Risk score chart
3.3. Statistical Analysis
The collected information was input into SPSS version 21.0, by which all the statistical analyses were performed. First, the descriptive results were presented by frequency (percentage) and mean ± standard deviation (SD) for qualitative and quantitative variables, respectively. Then, the differences in the frequency of variables based on the calculated CVD risk scores were evaluated by chi-square test, and finally, the associations of variables were tested by Pearson’s or Spearman’s correlation coefficient. A P-value of less than 0.05 was considered statistically significant for all the tests.
4. Results
A total of 5324 participants were evaluated. The participants’ mean age was 45.3 ± 14.8 years, and 64% were male. The mean five-year risk of CVD was 0.83 ± 1.12 in the general population. The frequency of CVDs risk scores of the participants were as follows: low (54%), some risk (17.5%), moderate (15.4%), increased (5.7%), and high (3.5%).
The frequencies of each of the studied variables were categorized according to the participant’s CVD risk score. As presented in Table 1, the frequencies of the CVDs scores were significantly different according to the participant’s gender (P < 0.001), smoking status (P = 0.048), exercise (P = 0.014), and family history of hypertension, CVD, and diabetes (all P < 0.001).
| Variables | Risk | Pearson χ2 | P-Value | ||||
|---|---|---|---|---|---|---|---|
| 0 | 1 | 2 | 3 | 4 | |||
| Sex | 37.8 | < 0.001 | |||||
| Male | 1757 (35.9) | 544 (11.1) | 512 (10.5) | 213 (4.4) | 145 (3.0) | ||
| Female | 998 (20.4) | 345 (7.1) | 267 (5.5) | 77 (1.6) | 33 (0.7) | ||
| Smoking | 9.56 | 0.048 | |||||
| Yes | 553 (11.3) | 159 (3.2) | 181 (3.7) | 67 (1.4) | 42 (0.9) | ||
| No | 2209 (45.0) | 735 (15.0) | 606 (12.3) | 225 (4.6) | 136 (2.8) | ||
| Exercise | 12.5 | 0.014 | |||||
| Yes | 1059 (21.6) | 361 (7.4) | 320 (6.5) | 128 (2.6) | 89 (1.8) | ||
| No | 1701 (34.7) | 532 (10.8) | 465 (9.5) | 164 (3.3) | 89 (1.8) | ||
| Family history of hypertension | 292.4 | < 0.001 | |||||
| Yes | 198 (4.0) | 126 (2.6) | 188 (3.8) | 87 (1.8) | 58 (1.2) | ||
| No | 2567 (52.2) | 767 (15.6) | 599 (12.2) | 205 (4.2) | 120 (2.4) | ||
| Family history of cardiovascular diseases | 182.9 | < 0.001 | |||||
| Yes | 170 (3.5) | 105 (2.1) | 112 (2.3) | 55 (1.1) | 57 (1.2) | ||
| No | 2595 (52.8) | 789 (16.0) | 675 (13.7) | 237 (4.8) | 121 (2.5) | ||
| Family history of diabetes | 160.7 | < 0.001 | |||||
| Yes | 114 (2.3) | 79 (1.6) | 113 (2.3) | 48 (1.0) | 34 (0.7) | ||
| No | 2650 (53.9) | 814 (16.6) | 672 (13.7) | 244 (5.0) | 144 (2.9) | ||
The Frequency of Demographic Characteristics of the Target Population Categorized Based on the Cardiovascular Risk Scores
The associations of the variables with CVD risk were evaluated, the results of which are exhibited in Table 2. As demonstrated, age (β = 0.774, P < 0.001) and SBP (β = 0.041, P < 0.001) increased the odds of CVDs, while male gender (β = -0.032, P = 0.001), BMI (β = -0.035, P < 0.001), not smoking (β = -0.056, P < 0.001), and no family history of CVD (β = -0.025, P < 0.001) decreased the odds of CVD in the individual, and other variables did not have a significant effect (Table 2).
| Variables | β-coefficients | 95% Confidence Interval for B | P-Value | |
|---|---|---|---|---|
| Lower Limit | Upper Limit | |||
| Age | 0.774 | 0.058 | 0.061 | < 0.001 |
| Male gender (M = 1, F = 2) | -0.032 | -0.121 | -0.029 | 0.001 |
| Body mass index | -0.035 | -0.010 | -0.003 | < 0.001 |
| Systolic blood pressure | 0.041 | 0.012 | 0.037 | < 0.001 |
| Smoking (yes = 1, no = 2) | -0.056 | -0.211 | -0.105 | < 0.001 |
| Exercise (yes = 1, no = 2) | 0.001 | -0.039 | 0.046 | 0.877 |
| Family history of BP (yes = 1, no = 2) | -0.016 | -0.119 | 0.012 | 0.108 |
| Family history of cardiovascular disease (yes = 1, no = 2) | -0.025 | -0.163 | -0.022 | 0.010 |
| Family history of diabetes (yes = 1, no = 2) | -0.015 | -0.142 | 0.014 | 0.109 |
The Results of Regression β-coefficients of Variables Used to Calculate Cardiovascular Disease Risk Scores in the Target Population
5. Discussion
We used the non-laboratory-based CVD risk score chart, described by Gaziano et al., which categorizes participants’ CVD risk into low, some, moderate, increased, and high risk. High risk shows more than 40% probability of developing CVDs in the following five years, and increased risk shows 31 - 40% chance, both of which require urgent attention (15). Of the 5324 participants evaluated in the present study, 3.5% had high, and 5.7% had increased risk scores. In addition, 15.4% had a moderate risk, which shows 21 - 30% probability of CVDs. In the original study by Gaziano et al. performed in Bangladesh, Guatemala, Mexico, and South Africa, 4049 participants completed the study, of whom 5% had a high risk (> 20%) (22), which is much lower than the rate reported in the present study (24.6%), and 77.6% of the participants in their study had a low risk, while about half of our participants had a low risk (indicating CVDs chance of less than 10%). Despite these differences between the studies, Gaziano et al. reported that 17.4% had some risk, indicating 10 - 20% chance of CVDs, which was similar to the frequency of some risk in our participants (17.5%). These differences between studies could be due to the different demographic characteristics of the target populations, which significantly affects the risk of CVDs (10). For instance, 75% of the participants in Gaziano’s study were female, while in the present study, 36% were female. In addition, age is an important predictor of CVD risk score, and individuals aged 30 are reported essentially risk-free within the next 10 years (13). Therefore, the difference in the mean age of participants can result in different CVD risks. Furthermore, race/ethnicity is a critical factor in the incidence of CVDs (23), which serves as another factor for the different risk scores.
Tehran Lipid and Glucose Studies have validated the efficacy of Framingham’s CVD risk assessment method in the Iranian population (20, 21). In the surveillance of risk factors of non-communicable diseases (SuRFNCD) in 2011, 11,867 Iranian individuals aged 6 - 70 years were surveyed using the random complex sampling method, and 4759 participants aged 25 - 64 years gave consent for blood sampling (19). The analysis of 3944 individuals showed 10-year risk of coronary artery disease at 13.82 and 0.72, based on Framingham’s and SCORE scoring systems, respectively. Based on Framingham’s scores, 25.8 and 22.6% had high and intermediate risks, while based on SCORE only 9.2% and 1.8% had high and intermediate risks, respectively (19). The frequency of high-risk patients based on Framingham’s scores in that study (25.8%) was close to the frequency of high-risk patients in our report (24.6%). However, Framingham’s score includes assessing the serum lipid profile and glucose levels, while we used the non-laboratory scoring system, described by Gaziano et al. This scoring system was selected in the present study for the following reasons. Firstly, laboratory scoring systems have been previously validated in Iranian population, but the non-laboratory method has not; although Gaziano et al. have reported that the value of their risk assessment chart was similar to that of laboratory risk scoring methods (15). Secondly, in order to overcome the most important limitation in the study by Meysamie et al. (19), which excluded more than half of the study population, because the individuals did not gave consent for blood sampling. However, we excluded patients with diabetes and did not investigate the effect of diabetes on CVDs risk, although we were aware that diabetes is associated with a significantly increased risk of CVDs (14, 15); nevertheless, according to evidence, about one-quarter of diabetic patients in Iran are not aware of their disease (24). As we only recorded patients’ statements about their medical history, we decided to exclude the effect of diabetes to eliminate the confounding effect of unaware patients.
According to the results of the present study, the frequencies of the CVD risk scores were significantly different according to participants’ gender, smoking status, exercise, and family history of hypertension, CVD, and diabetes, which demonstrates these variables as key risk factors for CVDs. In addition, according to the results of regression analysis, each unit increase in SBP increased the risk of CVDs by 4%, while each unit increase in BMI decreased the risk of CVD by 3%. In addition, the risk of CVDs in nonsmokers was 5% lower than that in smokers, and the risk in participants without a family history of related diseases was 2% lower than in those with a positive family history. The results of other studies have similarly shown that besides the effect of age, documented as an important risk factor for CVDs (13), hypertension is strongly associated with the risk of CVDs, even after adjusting for age, sex, and demographic variables (25-29). This association, confirmed in the present study, is mainly due to the great effects of hypertension on vessels and the heart (28). In addition, it has been well documented that the duration and amount of cigarette smoking significantly elevates the risk of CVDs (29, 30). The pathophysiology of this association, as suggested by the results in the present study, refers to the tissue remodeling, prothrombotic processes, and activation of systemic inflammatory signals, which result in atherogenic vessel wall changes (31). The above-mentioned factors have also been included in CVD risk assessment charts. In the Framingham Heart study, age, SBP, and smoking were significant risk factors for CVDs (14), which is consistent with the results of the present study. The NHANES study determined the usefulness of non-laboratory and easily obtainable risk factors, including age, SBP, smoking status, blood pressure treatment status, history of diabetes mellitus, and added the usefulness of BMI for the risk assessment of CVDs (32), which confirm the results of the present study on the significant effects of gender, smoking status, SBP, and positive family history on the odds of CVDs. Bozorgmanesh et al. have also reported the significant association of age, SBP, and smoking with the incidence of CVD in an Iranian population (20), which is consistent with the results of the present study. These results suggest the need for appropriate intervention to reduce smoking in the population (33, 34). In addition, we reported the additional value of positive family history of CVD in the general risk assessment, although the majority of previous risk scoring systems have not included family history in the charts. In one study, Sarrafzadegan et al. demonstrated the value of positive family history of CVD in an Iranian population (35). As the pooled analysis by Globorisk reported no risk chart for Iran (33), they developed a new CVD risk assessment chart (PARS) based on the individual’s age, gender, SBP, diabetes status, waist-to-hip ratio, total cholesterol levels, and family history of CVD (35). The results of this study confirmed that the significant effect of age, sex, and family history of CVD; however, we did not use this scoring chart, as we aimed to investigate the CVD risk in the general population based a non-laboratory method for the reasons explained earlier. Furthermore, the results of the present study on the effect of BMI was contrary to the findings of other studies, which indicated adiposity and higher BMI as an important risk factor for CVDs (35, 36).
The present study was the first to examine the CVD risk in the Iranian general population based on a non-laboratory risk chart. However, the results of this study could be affected by several limitations. The main limitation was that we did not calculate the risk of bias in this analysis and did not investigate the accuracy and validity of changing the main chart and excluding diabetes. Furthermore, we selected participants from passengers of metro stations of Tehran, and the results may not represent the situation in the whole population of the country.
5.1. Conclusions
We showed the five-year risk of CVDs at 0.83 in the general population, while 24.6% of the studied population had high CVDs risk (> 20%), and only 54% had a low risk (< 10%). This finding shows the necessity of paying greater attention to the issue of CVDs in the Iranian population and implementing strategies to monitor and manage the risk factors. According to the results, smoking, SBP, BMI, exercise, and family history of related diseases were significant predictors of CVDs. Therefore, attention should be focused on these risk factors to reduce the incidence of CVDs in the future in Iran. The risk assessment of non-laboratory CVD is very useful in cities and countries with high disease burden and lack of funding for drugs, equipment, and devices, and this method can be used as an alternative to laboratory assessment (16, 18). Assessing CVD risk by non-laboratory risk assessment chart suffers from the main limitation of including diabetes in the assessment, while many may not be aware of their disease; therefore, it is suggested to investigate the most appropriate non-laboratory risk assessment chart for Iranians in future studies.
