
1. Context
Cancer is a disease that depends on both oncogenic mutations and non-mutated genes for survival, and so named as oncogene and non-oncogene addictions. The reason for improper treatment and death of patients is poor diagnosis and prognosis of the disease, which is defined by the 10 hallmarks of cancers (1), due to which the treatment process is affected. Cancer is developed due to genetic and epigenetic changes, which accumulate within the cell through which the abnormal biological features (1, 2) specific to cancer cells occur. The multiomics provides the basic understanding of precision oncology (3). The major progress in the research of mutations driving cancer cells (4) has happened since the sequencing of the human genome. Mutants play a key role in understanding gene function because mutations hinder cellular processes. The specific mutations responsible for malignant transformation and hereditary cancer syndromes (5) can be identified by genomics. In DNA sequencing, the mutation assays present certain limitations in personalized care (6). If we consider the proteomics, only a small percentage of the human genome is expressed. Also, gene expression is a very complicated and multistage process, which is controlled by various regulating mechanisms, such as DNA methylation (7), DNA-binding proteins (8), or small interfering RNA (siRNA) (9). The determination of a karyotype and genomic hybridization at the molecular level affirms the heterogeneity of cancer cells. DNA sequencing of the cells within the same tumor may differ remarkably to define different subpopulations involving clinical diversity (10, 11). Moreover, during tumor development and treatment, it is observed that the plasticity of cancer genomes exhibits itself in the cell-to-cell flexibility of DNA sequence, which can be used for large-scale clinical assistance (12). So, it can be concluded that the cancer genome may provide worthy information on the DNA sequence and its structure, but cancer genomics is not sufficient to report the real phenotype of the cell. Thus, other approaches (such as proteomics, transcriptomics, and metabolomics) are needed to find proper molecular diagnostic targets and mark specific therapies for cancer patients. Proteomics is much closer to the determination of molecular mechanisms for the phenotype of cells. Proteins are the key factors in all cellular processes, whereas mutations change their expressions and/or activities in many ways (13, 14). The analysis of the cancer proteome gives a landscape of post-translational modifications and interactions between cellular mechanisms and their locations (15). Microarrays are commonly used for protein recognition. Microarrays use monoclonal antibodies or other binders to identify individual proteins. Protein microarrays have wide applications in molecular diagnostics, specifically in the discovery (16) of cancer biomarkers. Yet the main barrier for proteomic studies at (17) wider levels is the different physical and chemical properties of proteins, as well as the need to use highly specific antibody panels.
The transcriptome consists of "classical" RNAs (messenger RNA [mRNA], ribosomal RNA [rRNA], and transfer RNA [tRNA]) and multiple subtypes of noncoding RNA (microRNA [miRNA] and long noncoding RNA [ncRNA]), which have novel regulatory functions in cell biology (18, 19). Microarray technology or recent transcriptome sequencing (RNA sequencing [RNA-Seq]) methods are used for profiling gene expression. Transcriptomics includes precise details about base pairs (bp) and the ability to detect novel RNAs that cannot be detected on microarrays. Fluorescence in situ hybridization (FISH) and reverse transcriptase-polymerase chain reaction (RT-PCR) are used to detect gene rearrangements in routine, but these techniques are limited, with only testing for 1 gene at a time. RNA-Seq has been performed successfully in recent years (20-23). Applications of RNA-Seq include the detection of novel clinically relevant gene fusions in cancer at the early stage of development. The detection of novel gene fusions leads to novel opportunities in the treatment of advanced-level cancer and therapeutics with kinase inhibitors (18). Roberts et al. recently identified a novel treatment hypothesis for patients with pediatric B-cell acute lymphoblastic type of leukemia in clinical trials and identified kinase fusions involving genes for target therapies (24, 25). Gene expression signatures of clinical relevance can be used to classify cancer types into molecular subsets (26-28). In other studies, microarray-based transcriptome profiling on primary breast cancer samples was divided into 5 molecular subsets to study the biological and clinical relevance of the disease (29).
The various modules of RNA-Seq study the classical elements of the transcriptome, including mRNA, rRNA, and tRNA. Multiple subtypes of RNA with novel regulatory functions in cell biology have been discovered. The major part of the transcriptome consists of ncRNAs, miRNAs (30, 31), siRNAs (32), and long ncRNAs. These novel RNAs play multiple roles in cell biology, including regulation of transcription, post-transcriptional events, gene silencing, translation, and protein-level function, apart from the classical function for mRNAs that encode proteins (33). The role of miRNAs is genomic alterations, including mutation, deletion, amplification, and epigenetic modifications (34). MicroRNAs can function as oncogenes or tumor suppressor genes (35). Small interfering RNAs arbitrate a highly specific gene-silencing mechanism, which is conserved to mammalian biology (33) and used as a potential strategy for gene-silencing therapies in biomedical research (36). Long ncRNAs are pervasive in cancer, have varied regulatory functions, and have been intrinsically identified recently (37). Circular RNA (circRNA) is also a human transcriptome feature and is ubiquitous in many other metazoans. The multiple functions of circRNA include serving as protein scaffolds or miRNA sponges and being translated into polypeptides (38). With a longer half-life and more resistance to ribonuclease (RNase) R than linear RNAs (39), circRNAs are used as potential candidates for diagnostic biomarkers and therapeutic targets (38).
Transcriptome connects the cellular phenotype and genetic characteristics of tumor biology. It contains all the information encoded in RNA transcribed from DNA. While the genome is relatively stable, the transcriptome reacts actively to physiological or pathological conditions. Thus, we can say that the transcriptome-based studies have opened a new era for understanding the cancer mechanisms.
In the next section, various computational bioinformatics tools that are used to perform the transcriptomic analysis will be discussed.
2. Computational Methodology
Over the years, transcriptomics with improved sensitivity, accuracy, and reproducibility with reduced biases have been widely used to understand the cause and effect of biological processes through differential gene-/transcript-/exon-expression analysis. The main steps in RNA-Seq data analysis include experimental design with quality control, read alignment, quantification of gene and transcript levels, visualization, differential expression gene (DEG) analysis, alternative splicing, functional analysis, and gene fusion detection. Being sequence-based, RNA-Seq is useful for identifying genetic variants for expression quantitative trait loci (eQTL) analysis, and even clinical diagnosis. Gene Ontology (GO) and Kyoto Encyclopedia of Genes and Genomes (KEGG) pathway analysis, protein-protein interactions, integrated multiomics data analysis, and drug-gene interaction predictions can suggest personalized treatment for cancer patients. The original sequencing data are taken either by the experimental results or by other public repositories, such as Gene Expression Omnibus (GEO), The Cancer Genome Atlas (TCGA), International Cancer Genome Consortium (ICGC), GEO (40) and European Genome-phenome Archive (EGA) (41), to identify transcriptome-level gene expression datasets with accessible clinical details. The format conversion tools and the extraction of necessary information can be obtained by software packages that have constructed workflows, for example, Anduril (42) and Galaxy (43). The advanced features of these servers include building complex pipelines with large datasets that need automated correlation. The strength of these web servers is the user-friendly environment and easier visualization of data with highly advanced tools.
The raw RNA-Seq reads were extracted from the Sequence Read Archive (SRA) files and converted into FASTQ files. For longer reads of the fragment sequence, adapters may also be present, and trimming these will improve the number of reads mapped. The FASTQC tool was used to generate the quality report for the sequence, and MultiQC was used to collect the generated reports. Trimmomatic (44) and Cutadapt (45) are used to remove the adapter and quality trimming. Phred quality score > 20 and read length > 50 bp (46) are selected for the downstream analysis of reads. The statistical comparisons among the trimming algorithms (read mapping rate and the surviving reads) were performed using the Kruskal-Wallis test, followed by the dunn test package (47) in R (48). For Homo sapiens, GRCh38 (hg38) from Ensembl65 was used as the reference genome. The read alignment was carried out by Tophat2 (49), STAR (50) and Hisat2 (51). Transcriptome alignment methods were also tested by Bowtie2 (52) and STAR against the Ensembl (v82) transcriptome. BAM files were sorted by read name and genome position using SAMtools (53), and unmapped reads were discarded. The results from the BAM files were visualized using Integrative Genomics Viewer (IGV) (54). Quantification depends on both the reference genome (the FASTA file) and its associated annotations (the GTF file). Counting methods, such as Cuffinks (55), eXpress (56), HTSeq (57), RSEM (58), and Stringtie (59), were used for mapping alignments. Various algorithms were used for gene expression values using the normalization techniques. For pseudoalignment, 3 commonly used pseudoaligners, Kallisto (60), Sailfish (61), and Salmon (62) were used. Differential expression analyses were carried out to study the gene expressions. The methods used were divided into 3 categories as follows (46): (1) Methods that assume a negative binomial distribution of data: BaySeq (63), Cuffdiff (64), DESeq2 (65), EBseq (66), and edgeR (67); (2) methods that assume a log-normal distribution as Ballgown (68) and the Trend and Voom limma (69) variants; and (3) non-parametric methods such as NOISeq (70) and SAMseq (71) (R package).
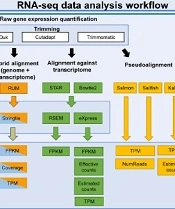
The criteria for DEGs were adjusted with P-value (adjP) ≤ 0.1 and fold change (FC) values ≥ 1.5 and ≤ -1.5 for the upregulated and downregulated genes. The analysis was carried out by the principal component analysis (PCA) plot, heatmap of the sample-to-sample distance matrix (with clustering) based on the normalized counts, dispersion estimates, histogram of P-values for the genes, and MA plot. Principal component analysis tools, such as https://gccri.bishop-lab.uthscsa.edu/correlation-analyzer/ (72), were used to carry out the analysis (Figure 1).
 analysis. Left panel (1) represents the raw gene expression quantification workflow. Each box contains algorithms and methods for trimming, alignment, counting, normalization, and pseudoalignment levels for RNA-Seq. The right panel (2) represents differential gene expression quantification algorithms (*HTSeq is performed in union and intersection-strict modes; **EdgeR exact test, edgeR GLM, and NOISeq have estimated internally 3 separated normalization techniques (<a href=\"#A142195REF46\">46</a>)).")
The workflow for RNA sequencing (RNA-Seq) analysis. Left panel (1) represents the raw gene expression quantification workflow. Each box contains algorithms and methods for trimming, alignment, counting, normalization, and pseudoalignment levels for RNA-Seq. The right panel (2) represents differential gene expression quantification algorithms (*HTSeq is performed in union and intersection-strict modes; **EdgeR exact test, edgeR GLM, and NOISeq have estimated internally 3 separated normalization techniques (46)).
The GO and KEGG analyses for the different species were performed by various computational tools, such as GEne SeT AnaLysis Toolkit (Webgestalt) web server (73), the “clusterProfiler” package (74), and “msigdbr” package (75). Differential expression genes for each species were selected separately for the differentially connected genes, and gene modules and P-values were obtained by hypergeometric analysis. The functional analyses, including GO, pathway, and chromosome enrichment analysis of the candidate genes, can also performed by DAVID (76), a high-throughput and integrated data-mining environment. The pathway maps represent proteins and genes, which are accountable for the reaction networks. The molecular interactions were manually drawn from the KEGG database. KEGG pathways were used to obtain significantly enriched terms with a P-value < 0.05. Significant terms were taken for adjP ≤ 0.1. The corrected P-values were used for the false discovery rate (FDR). Weighted gene co-expression network (WGCNA) (77) provides the modules or clusters of highly correlated genes.
The Drug Gene Interaction Database (DGIdb) (78, 79) was used to predict the interaction between DEGs and drugs so that the oncologist can make treatment decisions regarding the therapeutic targets with the approved drugs and immunotherapies.
Various tools and computational methodologies are used for gene screening and prognostic signature development. The LASSO (80) Cox regression was used to obtain the prognosis-related TRGs using the “glmnet” package, and the gene signature was identified based on the LASSO Cox regression coefficients. Multivariable analysis was carried out to select the suitable reason with the range of prognostic factors. Combining the gene signature and clinicopathological parameters, a nomogram was built to predict the survival probability of different time points using the “rms” package (81). The internal validation of the risk score was carried out using the bootstrap resampling method. The calibrated nomogram was accessed by the calibration curves (82). The performance of the gene signature was estimated using X-tile software (82). Multivariate analysis was carried out to estimate the overall survival (OS). The nonparametric tests such as t-test, Mann-Whitney-Wilcoxon test, and Kruskal-Wallis test are used for statistical analysis. These methods do not require a distribution to meet the needed assumptions for analysis, especially if the data is not normally distributed (48).
3. Transcriptomics in Clinical Trials
Transcriptomics applications include classifications of cancers, identification of early detection of cancer biomarkers, formation of cancer prognostic and predictive panels, intratumoral heterogeneity (ITH) and tumor microenvironment (TME) related research, and RNA-based therapeutics. The WINTHER trial was the first such study, which included integrated transcriptional-genomics studies for the treatment of solid tumors with matched therapeutics results (83). The WINTHER database is a valuable resource that provides information on the "targeting" gene expression and efficient registered and clinically tested drugs. The treatment process was recommended by the clinical management committee, and evaluation was carried out by exploratory matching score, calculated in an eventually blinded manner. An Eastern Cooperative Oncology Group (ECOG) performance with 2 or fewer previous therapies showed a status of 0. The high matching score was independently related to the long progression-free survival. Though the WINTHER trial showed that transcriptomic analysis could be successfully used for the treatment in selected patients, the analysis was complex and required bioinformatics expertise. Transcriptomic analysis based on matched therapies to molecular alterations was also carried out in the clinical trials on pediatric patients (83, 84). In one such study, 20 patients with refractory pediatric sarcoma were selected to study the gene expression profiling and identification of overexpressed genes and deregulated pathways that could be therapeutically targeted (83). The targeted therapy was received by 9 patients with higher overall (P = 0.0014) and progression-free (P = 0.0011) survival rates. Recently, updated results of the INFORM study with 1300 patients (enrolled at 72 centers) showed that 525 included in the analysis reported "very high" and "high" priority actionable targets for 8% and 14.8% of patients, respectively (85). Another Pediatric Sequencing (PIPseq) Program studied the clinical utility of molecular analysis in pediatric tumors (86). Molecular alterations (variant calls, copy number variations [CNV], fusions, and overexpressed genes) and clinically relevant alterations were initially reviewed.
4. Challenges and Limitations
The main challenges in transcriptomics are the handling of tissue samples and the application of advanced computational methodologies. The experimental data of RNA-Seq formalin-fixed, paraffin-embedded tissue samples include degraded, fragmented (87), or defoiled (88) RNA, which was followed by bioinformatics. Degradation causes errors during sample preparation, leading to the presence of sequence data from a different sample. In addition, tumor samples can be contaminated by normal cells that surround the tumor. Experimental methods (cell sorting or laser capture micro-dissection) (87) and bioinformatics algorithms are used to remove the contamination effects (88). Furthermore, methodological artifacts are endured in transcriptome analysis that requires precise evaluation. Another challenge is the application of advanced computational methodologies. The complex analysis of transcriptomic data requires a high-level bioinformatic approach, needing orderly expansion of efficient algorithms. The implementation of transcriptomic analysis in clinical functions can be more complex compared to genomics analysis. The reproducibility issues also need to be addressed. As the RNA profile is used to compare tumor tissue with normal tissue from the same organ, in some cases, the peripheral blood or buccal swab samples are compared, due to which there are variations in the results. Studies have shown that transcriptomics in clinical trials develops diverse and complex algorithms to specify the functionality of molecular alterations (84).
5. Conclusions
Novel next-generation sequencing (NGS) techniques have improved our understanding of the tumor biology of individual patients and provided an abundance of translational discovery opportunities, as tumor genomic profiling approaches provide average signatures and a snapshot of the tumor state (biopsy) but do not frequently show the complete tumor biology, all tumor parts, or the inherent heterogenic individual cell populations. However, understanding the tumor complexity and heterogeneity, as well as the dynamic expression of the genome, requires advanced computational methodologies. The future of precision medicine lies in integrated multiomics data analysis for better treatment decisions. Transcriptomics analysis has identified appropriate targeted therapies and validated some results in clinical trials, predicting that transcriptomics will increase the targeted therapy and can lead to favorable outcomes. The future prospects of transcriptomic data are promising but remain limited to the cost, time implications, and inconsistent analysis. Clinical trials are still going on to explore the relevance of transcriptomics analysis in cancer biology.
