1. Context
Cancer constitutes one of the most important global health concerns (1). The precise mechanisms of carcinogenesis remain largely elusive, but both genomic and environmental factors have been recognized to contribute to cancer development (2-7). Over the years, it has become evident that certain specific single nucleotide polymorphisms (SNPs) are related to cancer predisposition (6, 8-11).
Long non-coding RNAs (lncRNAs), mainly the transcripts of RNA polymerase II, are a class of specific non-coding RNA molecules with a length of more than 200 nucleotides (nt) (12, 13). Accumulating evidence reveals that lncRNA plays an imperative role in numerous biological processes and signaling pathways, such as cell cycle progression, apoptosis, transcription, splicing, translation, epigenetics, and regulation of gene expression (12-15). It has been proposed that alterations in the expression of lncRNAs are involved in cancer development and progression (16-19).
The POLR2E LncRNA gene is mapped to chromosome 19 (19p13). Several investigations have focused on identifying a relationship between the POLR2E rs3787016 polymorphism and the risk of cancer in various populations (20-28), but, overall, the findings have been inconsistent and conflicting. To comprehensively assess the correlation between the POLR2E rs3787016 polymorphism and cancer susceptibility, we designed and performed the current meta-analysis. Three recent meta-analyses have focused on POLR2E rs3787016 polymorphism and cancer. Chu et al. covered only four studies about POLR2E rs3787016 polymorphism, while in the current meta-analysis, we covered 11 manuscripts; therefore, our study is much more comprehensive and conclusive. Chen et al. investigated POLR2E rs3787016 polymorphism in liver and lung cancer and used five articles in their meta-analysis (25); therefore, our meta-analysis with 11 articles is more conclusive and covers more types of cancers. Huang et al. investigated POLR2E rs3787016 polymorphism in prostate cancer, while our meta-analysis covered all types of cancers and investigated POLR2E rs3787016 polymorphism in these cancers. Therefore, the current meta-analysis on POLR2E rs3787016 polymorphism in cancer would be the most comprehensive investigation on the evaluation of POLR2E rs3787016 polymorphism and the risk of cancer.
2. Methods
2.1. Literature Search
Our team performed an extensive literature review using the Scopus, Web of Science, and PubMed electronic databases to retrieve papers of interest published up to March 2019. The search keywords were “POLR2E” and “rs3787016 or variation or mutation or polymorphism” and “cancer or tumor or carcinoma or neoplasms”. We considered studies eligible if they examined the relationship between POLR2E rs3787016 and cancer risk.
2.2. Inclusion and Exclusion Criteria
We applied similar methods as used in our previous investigations to identify the relevant literature for the current meta-analysis (29). Briefly, eligible articles were incorporated in this meta-analysis if they met the following criteria: a) Evaluation of the relationship between POLR2E rs3787016 polymorphism and susceptibility to cancer, b) Appropriate data for estimating the odds ratios (ORs) and 95% confidence intervals (CIs), and c) Sufficient data representing the genotype and allele frequency of cases and controls. Accordingly, studies with the following criteria were excluded: a) Duplicate publications and overlapping data, b) Reviews, conference papers, case reports, letters, and case-only studies, and c) Inadequate information for data extraction.
2.3. Data Extraction
Two of our investigators independently and blindly extracted the following information from each eligible study: The first author’s name, publication year, country of origin, the ethnicity of the study population, genotyping methods, total number of cases and controls, distributions of genotypes and alleles in cases and controls, and p-value of the Hardy-Weinberg Equilibrium (HWE) (Table 1).
2.4. Statistical Analysis
The χ2 test was performed to assess whether the genotype distribution in the controls was in the HWE. The strength of the association between the presence of POLR2E rs3787016 polymorphism and cancer risk was evaluated by calculating pooled ORs and corresponding 95% CIs in six genetic models. The significance of the pooled ORs was assessed by the Z-test. The results with a P value < 0.05 were considered statistically significant.
The heterogeneity among studies was determined by the χ2 test-based Q statistics. A PQ value less than 0.10 indicated the presence of inter-study heterogeneity, in which the random-effects model was used to determine the ORs. Otherwise, the fixed-effects model was applied.
Publication bias was evaluated using Begg’s funnel plots and Egger’s tests. Sensitivity analysis was performed by sequentially eliminating one single study at a time to examine its effect on the pooled ORs. All statistical analyses were conducted using STATA 14.1 software.
3. Results
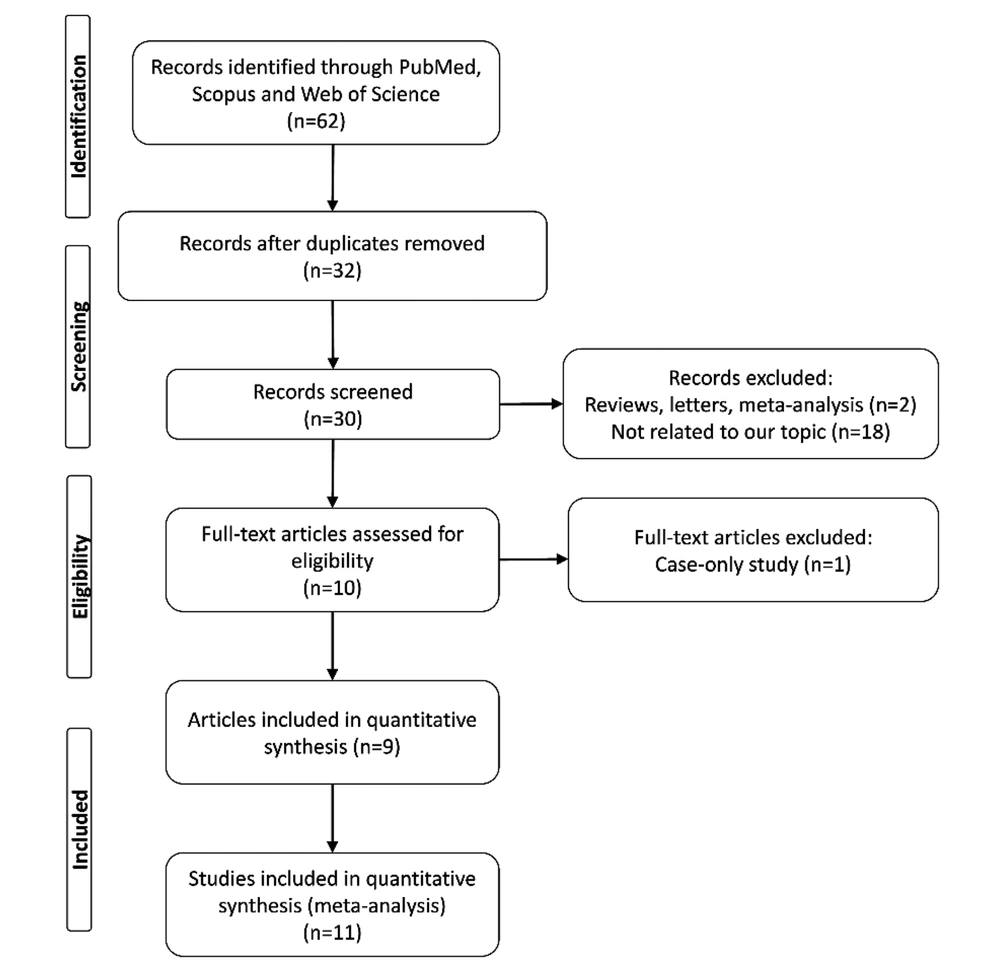
A flow diagram of the literature selection procedure is illustrated in Figure 1. Ultimately, a total of 11 case-control studies from nine articles (20-28), comprising 8,761 cancer cases and 10,534 controls, were subject to the pooled analysis. The main characteristics of eligible studies are presented in Table 1.
| Author | Year | Country | Ethnicity | Cancer Type | Source of Control | Genotyping Method | Case / Control | Cases | Controls | HWE (P) | ||||||||
|---|---|---|---|---|---|---|---|---|---|---|---|---|---|---|---|---|---|---|
| CC | CT | TT | C | T | CC | CT | TT | C | T | |||||||||
| Cao DL (21) | 2014 | China | Asian | Prostate cancer | PB | PCR-RFLP | 1015/1032 | 313 | 513 | 189 | 1139 | 891 | 357 | 524 | 151 | 1238 | 826 | 0.064 |
| Chen B (25) | 2018 | China | Asian | Liver cancer | HB | PCR-RFLP | 480/800 | 92 | 200 | 188 | 384 | 576 | 150 | 364 | 286 | 664 | 936 | 0.075 |
| Chen B (25) | 2018 | China | Asian | Lung cancer | HB | PCR-RFLP | 550/800 | 119 | 250 | 181 | 488 | 612 | 150 | 364 | 286 | 664 | 936 | 0.075 |
| Chen B (26) | 2018 | China | Asian | Thyroid cancer | HB | PCR-RFLP | 409/800 | 51 | 183 | 175 | 285 | 533 | 150 | 364 | 286 | 664 | 936 | 0.075 |
| Chen B (28) | 2019 | China | Asian | Breast Cancer | HB | PCR-RFLP | 480/588 | 60 | 218 | 202 | 338 | 622 | 90 | 232 | 178 | 412 | 588 | 0.287 |
| Chen B (28) | 2019 | China | Asian | Cervical cancer | HB | PCR-RFLP | 348/588 | 46 | 167 | 171 | 259 | 509 | 90 | 232 | 178 | 412 | 588 | 0.287 |
| Jin G (20) | 2011 | USA | Caucasian | Prostate cancer | PB | TaqMan assay | 4196/5007 | 2261 | 1638 | 297 | 6160 | 2232 | 2930 | 1800 | 277 | 7660 | 2354 | 0.997 |
| Kang M (23) | 2015 | China | Asian | Esophageal cancer | HB | PCR-RFLP | 369/370 | 130 | 149 | 90 | 409 | 329 | 105 | 194 | 71 | 404 | 336 | 0.268 |
| Nikolic ZZ (22) | 2013 | Serbia | Caucasian | Prostate cancer | HB | TaqMan assay | 261/106 | 140 | 100 | 21 | 380 | 142 | 55 | 44 | 7 | 154 | 58 | 0.544 |
| Sattarifard H (24) | 2018 | Iran | Asian | Prostate cancer | HB | PCR-RFLP | 178/180 | 6 | 51 | 121 | 63 | 293 | 3 | 33 | 144 | 39 | 321 | 0.468 |
| Xu T (27) | 2017 | China | Asian | Breast cancer | PB | MassARRAy | 439/439 | 137 | 209 | 93 | 483 | 395 | 149 | 226 | 64 | 524 | 354 | 0.144 |
Characteristics of All Studies Included in the Meta-analysis (POLR2E 3787016)
3.1. Quantitative Data Analysis
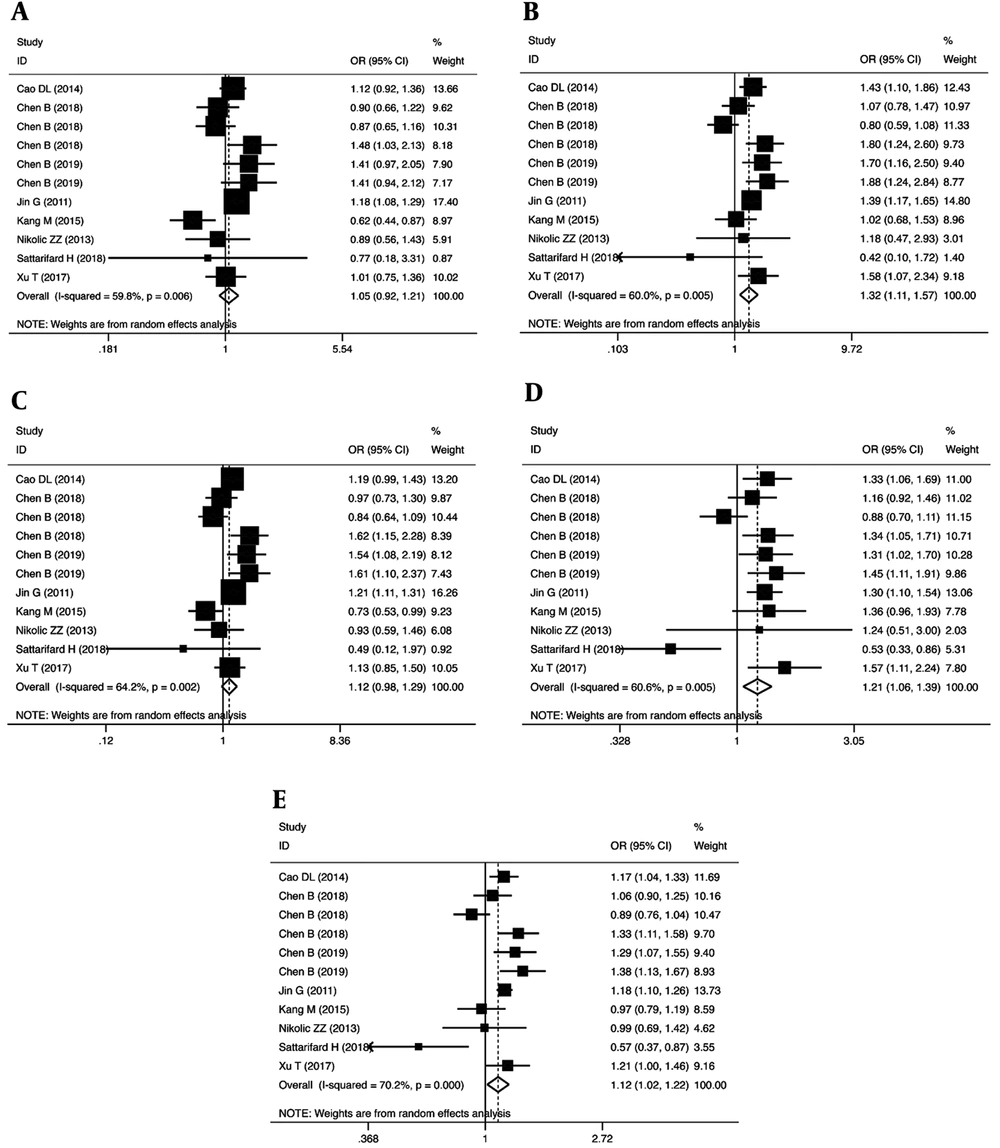
We examined the association between the POLR2E rs3787016 polymorphism and the risk of cancer through a meta-analysis of the overall population (Table 2). Our findings revealed that the rs3787016 polymorphism significantly increased the risk of cancer in homozygous (OR = 1.32, 95% CI = 1.11-1.57, P = 0.002, TT vs. CC), recessive (OR = 1.21, 95% CI = 1.06-1.39, P = 0.005, TT vs. CT + CC), and allele (OR = 1.12, 95% CI = 1.02-1.22, P = 0.021, T vs. C) genetic models (Figure 2).
| Genetic Model | Test Of Association | Heterogeneity (I2 (%), P) | Publication Bias Tests | |||||
|---|---|---|---|---|---|---|---|---|
| OR (95%CI) | Z | P | χ 2 | I2 (%) | P | Egger’s Test P | Begg’s Test P | |
| CT vs. CC | 1.05 (0.92 - 1.21) | 0.72 | 0.474 | 24.89 | 59.8 | 0.006 | 0.291 | 0.697 |
| TT vs. CC | 1.32 (1.11 - 1.57) | 3.09 | 0.002 | 24.99 | 60.0 | 0.005 | 0.640 | 0.938 |
| CT + TT vs. CC | 1.12 (0.98 - 1.29) | 1.63 | 0.104 | 27.96 | 64.2 | 0.002 | 0.438 | 0.935 |
| TT vs. CT + CC | 1.21 (1.06 - 1.39) | 2.82 | 0.005 | 25.36 | 60.6 | 0.005 | 0.570 | 0.938 |
| T vs. C | 1.12 (1.02 - 1.22) | 2.30 | 0.021 | 33.53 | 70.2 | 0.000 | 0.265 | 0.586 |
The Pooled Odds Ratios and 95% Confidence Intervals for the Association Between POLR2E Polymorphism and Cancer Susceptibility
Subgroup analysis based on cancer type showed that the polymorphism was associated with the risk of PCa (OR = 1.16, 95% CI = 1.07-1.25, P = 0.000, CT vs. CC; OR = 1.38, 95% CI = 1.20 - 1.59, P = 0.000, TT vs. CC; OR = 1.19, 95% CI = 1.11-1.28, CT + TT vs. CC), and breast cancer (OR = 1.64, 95% CI = 1.25-2.16, P = 0.000, TT vs. CC; OR = 1.40, 95% CI = 1.14 - 1.72, P = 0.001, TT vs. CT + CC; OR = 1.25, 95% CI = 1.10 - 1.43, P = 0.001, T vs. C) (Table 3). In addition, stratified analysis by ethnicity (Table 3) revealed that rs3787016 was associated with increased cancer risk particularly in Asian (OR = 1.31, 95% CI = 1.05-1.63, P = 0.019, TT vs. CC; OR = 1.20, 95% CI = 1.02-1.41, P = 0.031, TT vs. CT + CC) and Caucasian (OR = 1.38, 95% CI = 1.17-1.64, P = 0.000, TT vs. CC; OR = 1.30, 95% CI = 1.10-1.53, P = 0.002, TT vs. CT + CC; OR = 1.25, 95% CI = 1.10 - 1.43, P = 0.001, T vs. C) populations.
| Genetic Model | No. | Test of Association | Heterogeneity Test | ||||
|---|---|---|---|---|---|---|---|
| OR (95%CI) | Z | P | χ2 | I2(%) | P | ||
| Cancer Type | |||||||
| Prostate cancer | 4 | ||||||
| CT vs. CC | 1.16 (1.07 - 1.25) | 3.71 | 0.000 | 1.77 | 0.0 | 0.622 | |
| TT vs. CC | 1.38 (1.20 - 1.59) | 4.44 | 0.000 | 2.93 | 0.0 | 0.402 | |
| CT+TT vs. CC | 1.19 (1.11 - 1.28) | 4.64 | 0.000 | 2.81 | 0.0 | 0.423 | |
| TT vs. CT + CC | 1.07 (0.77 - 1.51) | 0.41 | 0.678 | 12.56 | 76.1 | 0.006 | |
| T vs. C | 1.05 (0.89 - 1.25) | 0.58 | 0.562 | 11.75 | 74.5 | 0.008 | |
| Breast cancer | 2 | ||||||
| CT vs. CC | 1.17 (0.84 - 1.62) | 0.92 | 0.356 | 1.90 | 47.4 | 0.168 | |
| TT vs. CC | 1.64 (1.25 - 2.16) | 3.53 | 0.000 | 0.07 | 0.0 | 0.791 | |
| CT + TT vs. CC | 1.29 (0.96 - 1.74) | 1.70 | 0.089 | 1.74 | 42.7 | 0.187 | |
| TT vs. CT + CC | 1.40 (1.14 - 1.72) | 3.18 | 0.001 | 0.66 | 0.0 | 0.415 | |
| T vs. C | 1.25 (1.10 - 1.43) | 3.33 | 0.001 | 0.22 | 0.0 | 0.638 | |
| Ethnicity | |||||||
| Asian | 9 | ||||||
| CT vs. CC | 1.04 (0.87 - 1.25) | 0.43 | 0.670 | 20.56 | 61.1 | 0.008 | |
| TT vs. CC | 1.31 (1.05 - 1.63) | 2.35 | 0.019 | 24.51 | 67.4 | 0.002 | |
| CT + TT vs. CC | 1.12 (0.93 - 1.36) | 1.19 | 0.234 | 25.51 | 68.6 | 0.001 | |
| TT vs. CT + CC | 1.20 (1.02 - 1.41) | 2.16 | 0.031 | 24.81 | 67.8 | 0.002 | |
| T vs. C | 1.11 (0.98 - 1.25) | 1.62 | 0.106 | 31.87 | 74.9 | 0.000 | |
| Caucasian | 2 | ||||||
| CT vs. CC | 1.13 (0.94 - 1.37) | 1.32 | 0.186 | 1.29 | 22.5 | 0.256 | |
| TT vs. CC | 1.38 (1.17 - 1.64) | 3.73 | 0.000 | 0.12 | 0.0 | 0.728 | |
| CT + TT vs. CC | 1.17 (1.00 - 1.38) | 1.91 | 0.056 | 1.22 | 17.9 | 0.270 | |
| TT vs. CT + CC | 1.30 (1.10 - 1.53) | 3.08 | 0.002 | 0.01 | 0.0 | 0.914 | |
| T vs. C | 1.25 (1.10 - 1.43) | 3.33 | 0.001 | 0.22 | 0.0 | 0.638 | |
Stratified Analysis of Variants on Susceptibility to Cancer
3.2. Heterogeneity and Publication Bias
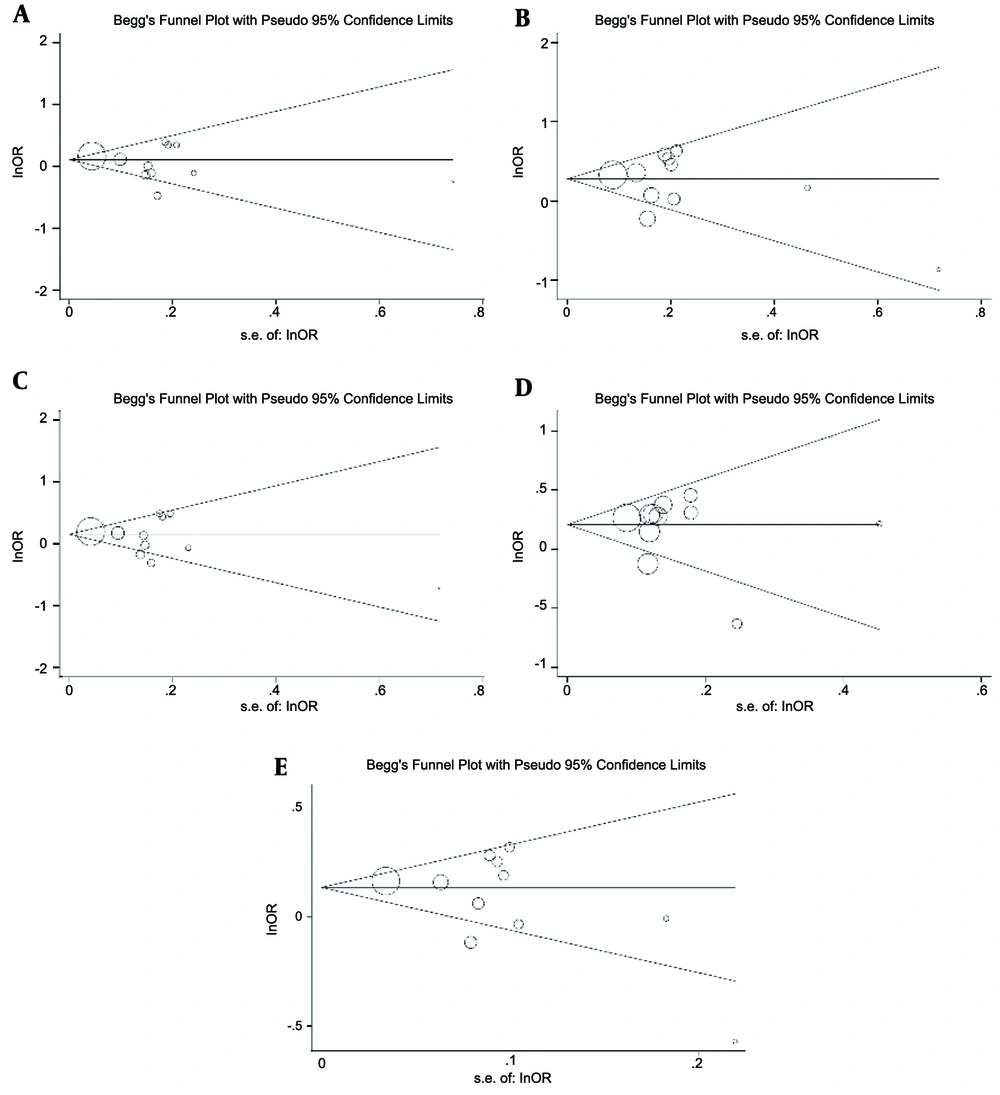
As shown in Table 2, inter-study heterogeneity was detected in all genetic models; therefore, the random-effects model was applied for pooled analysis. In the meta-analysis of the overall population, the Begg’s funnel plot and Egger’s tests did not indicate the presence of publication bias (Figure 3 and Table 2).
3.3. Sensitivity Analysis
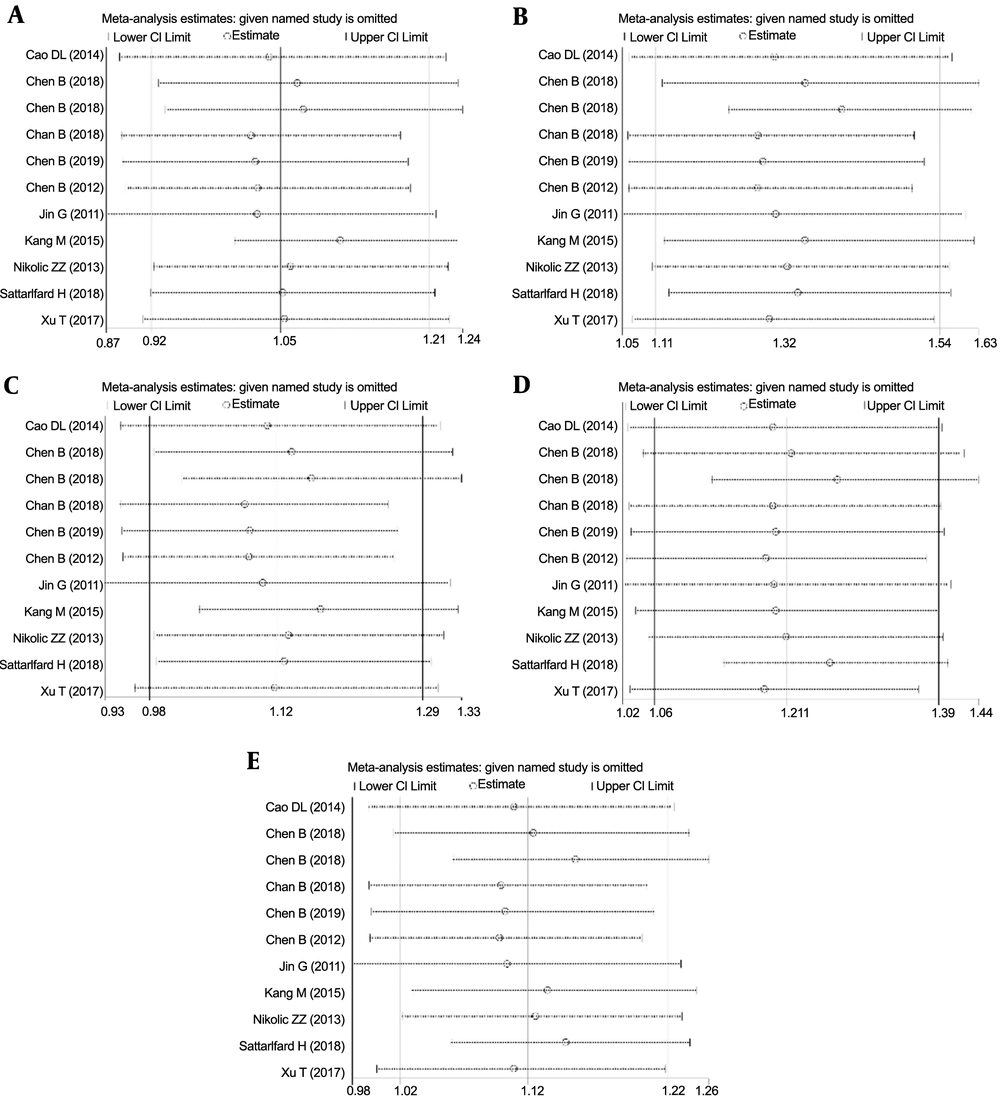
We did not find any significant changes in the pooled OR and corresponding 95% CI in the homozygous and recessive genetic models (Figure 4) when individual study results were sequentially omitted, verifying the stability and reliability of the pooled results.
4. Discussion
LncRNAs, a novel class of RNAs, have recently become a hot topic of attention due to their fundamental functions, which might be related to their oncogenic and/or tumor-suppressive activities (30, 31) in cellular and molecular mechanisms that drive cancer (18). LncRNAs interact with biological macromolecules (DNA, RNA, and protein) to partake in diverse regulatory activities, such as chromatin remodeling, RNA splicing, and editing (32, 33), as well as the regulation of gene expression at the epigenetic and post-transcription levels (34-36). Genome-wide Association Studies (GWAS) have revealed that lncRNAs have an important role in cancer initiation and progression (37, 38). The expression and function of lncRNAs could be affected by genetic variations in the lncRNAs gene. In this regard, numerous investigations have examined the relationship between the POLR2E rs3787016 polymorphism and various cancers, including squamous cell carcinoma (ESCC) (23), prostate (20-22, 24), thyroid (26), breast (27, 28), cervical (28), liver, and lung cancer (25). In the current study, we conducted a meta-analysis to address the precise role of POLR2E rs3787016 in overall cancer susceptibility. The pooled analysis of 11 eligible studies encompassing 8,761 cancer cases and 10,534 controls revealed that the rs3787016 polymorphism of the POLR2E gene significantly increased the risk of overall cancer in homozygous, recessive, and allele genetic models. Further stratified analyses indicated that this variant was particularly associated with the risk of prostate and breast cancer and increased overall cancer susceptibility in Asian and Caucasian populations. In line with our findings, a previous meta-analysis of four studies (comprising 5,841 cases and 6,702 controls) proposed an association between rs3787016 polymorphism and cancer susceptibility (39), whereas another seven studies (including 7,310 cases 8,554 controls) revealed a correlation with overall cancer risk (25). The statistical power of our meta-analysis is higher than that of previously published meta-analyses due to the inclusion of a larger sample size.
Our current investigation has several weaknesses that should be considered: 1) Heterogeneity existed between studies, which may be the result of differences in cancer type and/or ethnic background, 2) The number of studies used for stratified analyses was relatively small (four studies for prostate cancer, two studies for breast cancer, and two studies for Caucasian population), rendering limited statistical power, and 3) Only one SNP in the POLR2E gene was analyzed. Due to these limitations, the findings should be interpreted with caution.
In conclusion, our meta-analysis suggests that the rs3787016 polymorphism of POLR2E is associated with increased cancer susceptibility. Well-designed, large-scale, case-control studies are warranted to further verify and validate our results.


