1. Background
The correlation between Anti-Müllerian hormone (AMH) and Body Mass Index (BMI) in women of reproductive age remains unclear. The AMH is a glycoprotein and a member of the transforming growth factor-beta (TGF-β) family (1). It is a homodimeric glycopeptide found in reproductive-age women, primarily secreted by granulosa cells in the ovaries (2). The AMH synthesis reaches its peak in secondary, preantral, and small antral follicles up to approximately 4 mm in size, ceasing in granulosa cells when follicles grow to 4 - 8 mm. Due to its relatively stable serum levels throughout the menstrual cycle, AMH is considered a reliable marker of ovarian reserve and is widely used to predict ovarian responsiveness to specific reproductive treatments, including ovulation induction (3). While AMH is a valuable and feasible marker, it is not a definitive measure of ovarian reserve. In some cases, AMH levels may contradict other metrics, such as antral follicle count (AFC), which is obtained through ovarian ultrasonography (4).
Elevated AMH levels, often two to three times higher than those in non-PCOS women (5), are associated with polycystic ovarian syndrome (PCOS). The PCOS is an endocrine disorder diagnosed when at least two of the three Rotterdam criteria are met: Ovulatory dysfunction, clinical and/or biochemical evidence of hyperandrogenism, and the presence of polycystic ovaries on ultrasound, defined as at least 12 follicles in each ovary measuring 2 - 9 mm in diameter or an ovarian volume exceeding 10 mL (6). Despite various definitions of PCOS, the Rotterdam criteria are widely accepted and were endorsed in the International Evidence-Based Guideline for the assessment and management of polycystic ovary syndrome (7). Although PCOS has been linked to elevated AMH levels, the impact of BMI on serum AMH values in this population remains uncertain.
The World Health Organization (WHO) defines obesity as a BMI of ≥ 30 kg/m2, which poses a significant health risk affecting multiple organ systems. Among its adverse effects is reduced fertility, characterized by prolonged time to conception and decreased success rates in assisted reproductive technologies (8, 9). Given the widespread use of AMH as an indicator of fertility, understanding its potential correlation with BMI is crucial.
2. Objectives
This study aims to evaluate the hypothesis that BMI is correlated with AMH levels in both PCOS and non-PCOS groups.
3. Methods
3.1. Patient Selection
This cross-sectional study was conducted at a single center, analyzing records of 522 patients managed at a private Obstetrics and Gynecology clinic in Adiwaniyah, Iraq, from January 2022 to October 2024. Of these, 256 patients had been diagnosed with PCOS cohort, while 266 did not have PCOS (non-PCOS cohort). The PCOS status was determined based on a history of PCOS diagnosis using the International Classification of Diseases 10th Revision (ICD-10) code. Additionally, the diagnosis had been confirmed according to the Rotterdam Criteria (6). The sample size was approved by an academic statistical consultant within the relevant committee.
Inclusion criteria required participants to be female, at least 19 years old, and to have both BMI and AMH test results available during the study period. Both obese and non-obese women were selected from patient records. Patients were categorized into two BMI groups: Those with a BMI ≥ 30 kg/m2 and those with a BMI < 30 kg/m2.
Exclusion criteria included individuals lacking both AMH and BMI data. Additionally, patients with diabetes, systemic diseases, or galactorrhea were excluded, as well as those with endocrine disorders related to 17α-hydroxyprogesterone, prolactin, or thyroid-stimulating hormone (TSH) levels. The study also excluded patients who had used medications affecting the hypothalamic-pituitary-ovarian axis or insulin-sensitizing agents such as metformin within the preceding three months. Women who had used contraceptives within the past four weeks or engaged in regular exercise during the study period were also excluded.
Venipuncture was performed to collect five milliliters of blood. The MINI VIDAS, VIDAS 3, and BIOMÉRIEUX AMH immunoassay systems were used to measure AMH levels following the manufacturer’s guidelines. Standard procedures were followed for serum sample collection. Blood samples were left at room temperature for 5 - 10 minutes to allow complete clotting, then centrifuged at 2000 - 2500 revolutions per minute (rpm) for five minutes to separate the serum from cells and other blood components. The serum was then transferred to a labeled plastic screw-cap container. The VIDAS AMH immunoassay used a sandwich design with two AMH-specific antibodies to determine hormone levels in the serum.
3.2. Variables Collected
The collected data included weight and height, which were used to calculate BMI using the formula BMI = weight (kg)/height2 (m2). Serum AMH levels were measured using the MINI VIDAS, VIDAS 3, and BIOMÉRIEUX immunoassay systems. Additional recorded variables included the patient's age and the type of infertility, categorized as either primary or secondary. Furthermore, patients were classified as having PCOS or not, based on the Rotterdam Criteria.
3.3. Statistical Analysis
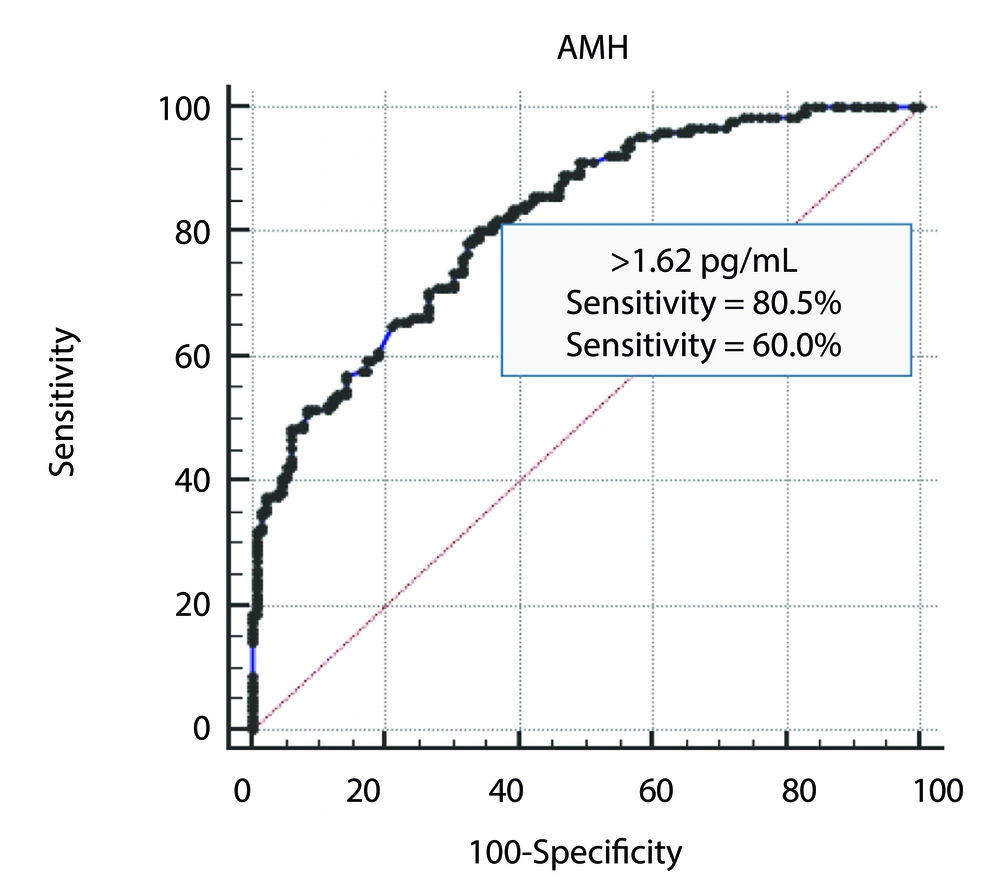
Statistical analysis was conducted using SPSS (version 26) and Microsoft Office Excel 2010. Descriptive statistics included minimum, maximum, mean, and standard deviation. The statistical methods employed in this study included the chi-square test, one-way analysis of variance (ANOVA), independent samples t-test, receiver operating characteristic (ROC) curve analysis (Figure 1), and Pearson correlation. A P-value of ≤ 0.05 was considered the threshold for statistical significance.
4. Results
The general characteristics of the infertile patients included in this study are presented in Table 1. A total of 522 infertile women were enrolled, of whom 256 were diagnosed with PCOS (PCOS group), while 266 did not have PCOS (non-PCOS group). The mean age of all participants was 32.55 ± 7.68 years, with an age range of 19 to 51 years. The mean age of the PCOS group was significantly lower than that of the non-PCOS group, 28.67 ± 5.50 years versus 36.28 ± 7.64 years, respectively (P < 0.001).
| Characteristic | Total (n = 522) | PCOS (n = 256) | Non-PCOS (n = 266) | P-Value |
|---|---|---|---|---|
| Age (y) | 32.55 ± 7.68 (19 - 51) | 28.67 ± 5.50 (19 - 42) | 36.28 ± 7.64 (20 - 51) | < 0.001 b |
| BMI (kg/m2) | 29.9 ± 5.43 (17.1 - 42.8) | 31.16 ± 5.55 (17.1 - 42.8) | 28.69 ± 5.04 (19 - 42.6) | < 0.001 b |
| Infertility | 0.338 | |||
| Primary | 264 (50.6) | 124 (48.4) | 140 (52.6) | |
| Secondary | 258 (49.4) | 132 (51.6) | 126 (47.4) |
Abbreviations: n, number of cases; BMI, Body Mass Index; AMH, anti-müllerian hormone; PCOS, polycystic ovarian syndrome.
a Values are expressed as mean ± SD (range) or No. (%).
b Significant at P ≤ 0.001.
The mean BMI of all enrolled women was 29.9 ± 5.43 kg/m2, ranging from 17.1 to 42.8 kg/m2. The mean BMI of the PCOS group was significantly higher than that of the non-PCOS group, 31.16 ± 5.55 kg/m2 versus 28.69 ± 5.04 kg/m2, respectively (P < 0.001).
Among all participants, primary infertility was observed in 264 women (50.6%), while secondary infertility was reported in 258 women (49.4%). There was no significant difference in the proportions of primary and secondary infertility between the PCOS and non-PCOS groups (P = 0.338).
A comparison of the mean AMH levels between women with and without PCOS is shown in Table 2. The mean AMH level in all participants was 3.11 ± 2.96 ng/mL, with a range of 0 to 14 ng/mL. The AMH level was significantly higher in the PCOS group compared to the non-PCOS group, 4.70 ± 3.23 ng/mL versus 1.59 ± 1.57 ng/mL, respectively (P < 0.001).
| Characteristic | Total (n = 522) | PCOS (n = 256) | Non-PCOS (n = 266) | P-Value |
|---|---|---|---|---|
| AMH (pg/mL) | 3.11 ± 2.96 (0 - 14) | 4.70 ± 3.23 (0.26 - 14) | 1.59 ± 1.57 (0 - 8.11) | < 0.001 b |
Abbreviations: n, number of cases; AMH, anti-müllerian hormone.
a Values are expressed as mean ± SD (range).
b Significant at P ≤ 0.001.
Receiver operating characteristic curve analysis was used to determine the cutoff value for AMH, which could predict the diagnosis of PCOS with the best combination of sensitivity and specificity. The results are shown in Figure 1 and Table 3. The cutoff value was > 1.62 pg/mL, with an area under the curve of 0.818 and a significant P-value of < 0.001. The sensitivity was 80.5%, the specificity was 60%, and the accuracy was 81.8%.
| Characteristic | Results |
|---|---|
| Cutoff value of AMH (pg/mL) | > 1.62 |
| AUC (95 % CI) | 0.818 (0.782 to 0.851) |
| P-value | < 0.001 a |
| Sensitivity (%) | 80.5 |
| Specificity (%) | 60.0 |
| Accuracy (%) | 81.8 |
Abbreviations: AMH, anti-müllerian hormone; AUC, area under curve; CI, confidence interval.
a Significant at P ≤ 0.001.
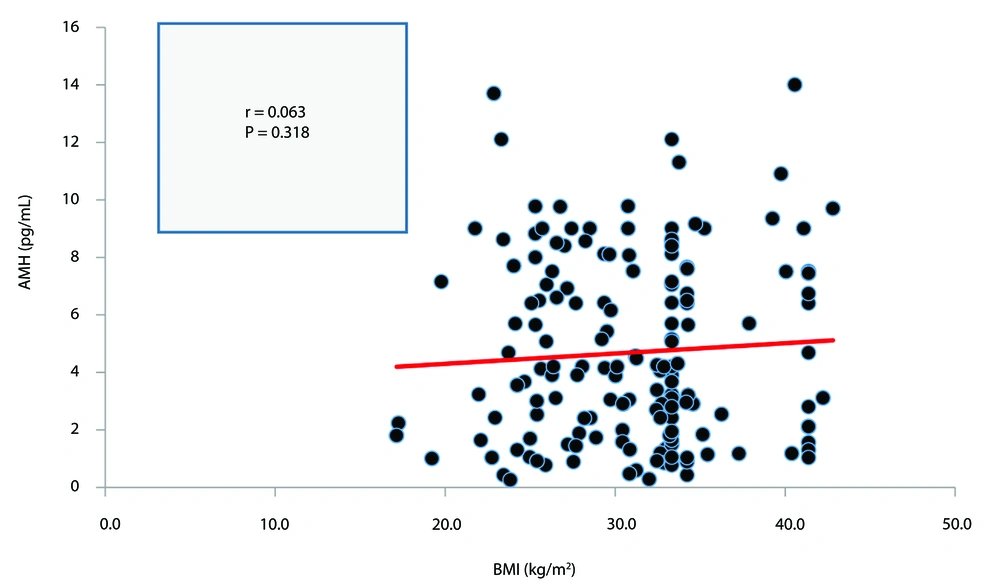
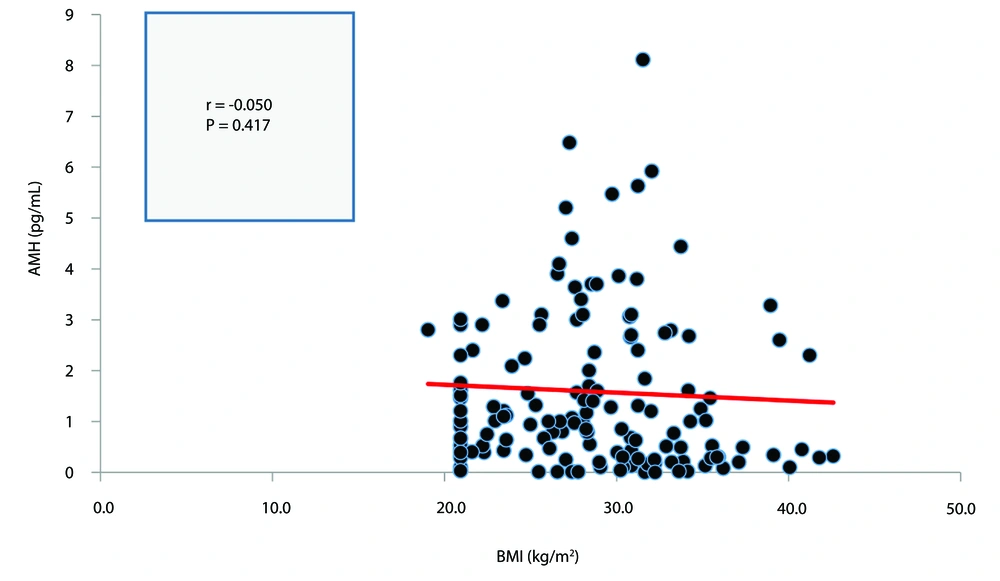
The correlation between BMI and serum AMH in both the PCOS and non-PCOS groups is presented in Figures 2, and 3, respectively. Neither correlation was statistically significant (P > 0.05).
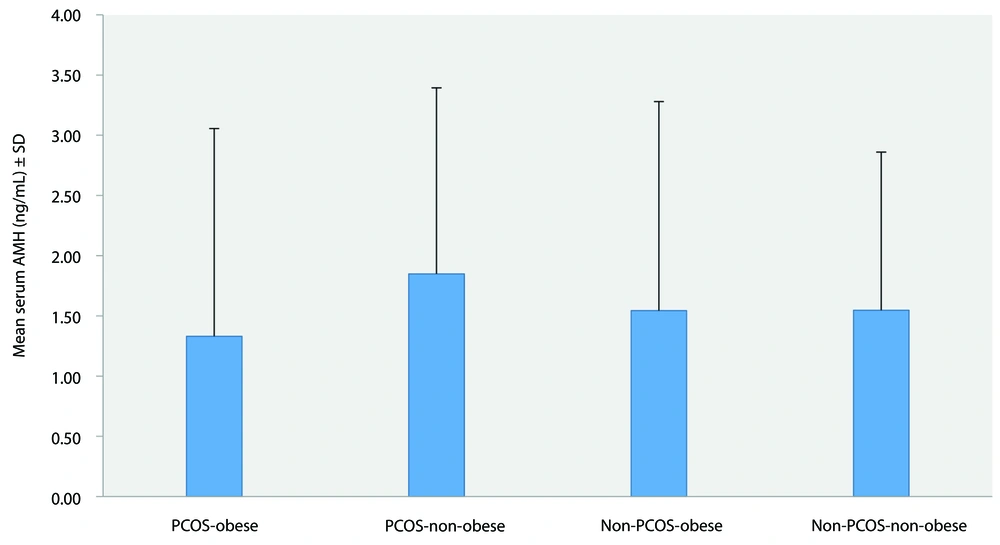
A comparison of mean serum AMH levels according to obesity status in both the PCOS and non-PCOS groups is shown in Figure 4. The mean AMH levels were 1.33 ± 1.72 ng/mL in the PCOS-obese group, 1.85 ± 1.54 ng/mL in the PCOS-non-obese group, 1.54 ± 1.74 ng/mL in the non-PCOS-obese group, and 1.55 ± 1.31 ng/mL in the non-PCOS-non-obese group. The comparison revealed no significant difference (P = 0.302).
5. Discussion
The general characteristics of the infertile patients recorded in this study are presented in Table 1. The mean age of all participating women was 32.55 ± 7.68 years, ranging from 19 to 51 years. The mean age of the PCOS group was significantly lower than that of the non-PCOS group, 28.67 ± 5.50 years versus 36.28 ± 7.64 years, respectively (P < 0.001). This finding is consistent with the studies conducted by Tannus et al., Louwers and Laven, van Keizerswaard et al., and Guo et al. (10-13).
The mean BMI of all enrolled women was 29.9 ± 5.43 kg/m2, with a range of 17.1 - 42.8 kg/m2. The mean BMI of the PCOS group was significantly higher than that of the non-PCOS group, 31.16 ± 5.55 kg/m2 versus 28.69 ± 5.04 kg/m2, respectively (P < 0.001). This result aligns with findings reported by Barber et al., Zeng et al., Barber and Franks, and Amiri et al. (14-17).
Primary infertility was observed in 264 women (50.6%), while secondary infertility was reported in 258 women (49.4%). No significant variation was found in the proportions of primary and secondary infertility between the PCOS and non-PCOS groups (P = 0.338). This finding contrasts with the results of Deshpande and Gupta (18), who concluded that primary infertility was significantly more prevalent than secondary infertility in PCOS patients, and with the findings of Javadian et al. (19).
A comparison of the mean AMH values between women with and without PCOS is shown in Table 2. The mean AMH value in all cases was 3.11 ± 2.96 ng/mL, with a range of 0 - 14 ng/mL. The AMH level was significantly higher in the PCOS group compared to the non-PCOS group, 4.70 ± 3.23 ng/mL versus 1.59 ± 1.57 ng/mL, respectively (P < 0.001). This finding is consistent with the study by Evliyaoglu et al. (20), who suggested that AMH is the strongest diagnostic marker for PCOS, as well as with the study by Piltonen et al. (21). However, van der Ham et al. (22) disagreed, stating that AMH levels alone are insufficient for PCOS diagnosis.
A comparison of mean serum AMH levels according to obesity status in both the PCOS and non-PCOS cohorts is shown in Figure 4. The mean AMH levels were 1.33 ± 1.72 ng/mL, 1.85 ± 1.54 ng/mL, 1.54 ± 1.74 ng/mL, and 1.55 ± 1.31 ng/mL in the PCOS-obese, PCOS-non-obese, non-PCOS-obese, and non-PCOS-non-obese groups, respectively. The comparison revealed no significant difference (P = 0.302). This finding aligns with the study by Simoes-Pereira et al. (23), which found that BMI does not significantly affect AMH levels. Additionally, other studies conducted on non-PCOS populations have also reported an absence of correlation, including those by Chiofalo et al., Hardy et al., and Zeng et al. (24-26). These studies questioned the reliability of AMH as a marker of ovarian reserve in women with obesity. However, others, such as Bernardi et al. (27), reported a significant inverse relationship between obesity and AMH levels.
Conflicting outcomes have also been observed among PCOS populations, with some studies identifying a negative correlation (28-31), while others did not (24). Furthermore, certain data suggest that a correlation may only be evident at extreme levels of obesity. Bhandari et al. found an association between AMH and BMI among individuals with BMIs exceeding 51 kg/m2, while Bernardi et al. reported a similar trend in those with BMIs over 40 kg/m2 (27, 32, 33). They found that in the PCOS group, obese patients had the lowest AMH levels, while underweight patients had the highest AMH levels. Given these discrepancies, we aimed to clarify the existence of a link between BMI and AMH by ensuring that our study population accurately reflected a broad range of BMI categories.
In conclusion, our analysis found no correlation between AMH and BMI across the entire study cohort, regardless of PCOS status. No significant changes were observed in serum AMH levels between patients with BMIs over 30 kg/m2 and those with BMIs below 30 kg/m2. This finding is comparable to the review by Oldfield et al. (34).
5.1. Study Limitation
The primary limitation of this study is that it was conducted in a single clinic. Therefore, we recommend further studies with larger and more diverse populations to validate our findings.
5.2. Conclusions
Our analysis revealed no correlation between AMH and BMI in the entire study cohort, regardless of PCOS status. No significant differences were observed in serum AMH levels between patients with BMIs over 30 kg/m2 and those with BMIs below 30 kg/m2.


