1. Background
Over the last few decades, there has been a growing interest in evaluating the performance of different health care organizations (1). Public hospitals have become the center of attention, as they play the key role in delivering medical services to the community, let alone consuming up to half of the total health care expenditures (2, 3). In recent years, the costs of diagnostic and therapeutic procedures and the expectations of the patients from health care professionals have increased while resources have become limited. Accordingly, health care professionals need to act more efficiently in allocating scarce resources (4, 5). In healthcare systems, the nature of outputs differs from other organizations, thus evaluating performance and measuring efficiency in health care are more difficult, and there is disagreement regarding the best approaches (1, 6). Nonetheless, measuring hospital performance can be useful for stakeholders, including managers who evaluate the hospital’s current status and monitor its activities over time, clients who must choose between different health care providers, providers who improve the quality of their health services to attract more consumers, and finally policymakers who establish more efficient mechanisms for allocating scarce resources (7). In Iran, many studies have evaluated hospital performance with different models, but none of them has tracked the trends in capacity utilization measures over a period of years, or compared the results with national standards to provide a picture of changes in performance. Different models for assessing hospital performance are the rational goal model (8), open system model (9), internal process model (10), and Pabon Lasso model (11). Each model uses specific criteria and thus reflects different and separated aspects of performance. Among the various approaches, Pabon Lasso model includes 3 indices: bed turnover (BTO), bed occupancy rate (BOR), and average length of stay (ALS) (11). This model provides helpful snapshot for health care managers, with considering the relationship between indicators, monitoring, and evaluation of heath care systems (12).
2. Objectives
In this study, we used Pabon Lasso (PL) model to investigate trends of hospital performance at Shahid Faghihi Hospital, Shiraz, Iran from 2008 to 2012.
3. Materials and Methods
In this cross-sectional descriptive study from March 2008 to March 2012, all admission records were retrieved from the Hospital Information System (HIS) of Shahid Faghihi Hospital, a public teaching hospital in Shiraz, the capital of Fars Province, Iran. As the second largest teaching hospital in the province, Shahid Faghihi Hospital has 358 active beds and 3 emergency departments (medical, surgical, and gynecological) and 15 inpatient wards. The outputs retrieved from HIS included chart numbers, admission ward, date of admission and discharge, and outcome. All data were stored in SPSS (version 11.5). To ensure that our interpretation of the indicators was reliable, we checked the quality and consistency of the number of active beds, occupied bed days, inpatient days, discharges, and deaths as raw data to be used as the numerators and denominators of the indicators. The hospital performance indicators were average length of stay, bed turnover, bed occupancy rate, and turnover interval, which were calculated with the following definitions and formulas.
3.1. Definitions
Average length of stay (ALS): This measure refers to the average number of days that a patient is admitted in a hospital. It is calculated by dividing inpatient days by the number of admissions.
Bed turnover (BTO): Bed turnover is a measure of the productivity of hospital beds and represents the number of patients treated per bed in a specified period of time (usually 1 year). We calculated this index by dividing the number of beds by total admissions.
Bed occupancy rate (BOR): This indicates the percentage of beds occupied by patients in a specified period, usually 1 year. Bed occupancy was calculated as BOR = (ALS × admissions / number of beds × 365) × 100.
Turnover interval (TI): This measure is related to BTO. It measures the average time that beds are unoccupied between successive inpatients, and was calculated as TI = (365/BTO)-ALS.
Mortality rate: In this study, mortality rate was estimated by dividing the number of deaths by sum of the numbers of discharges and deaths.
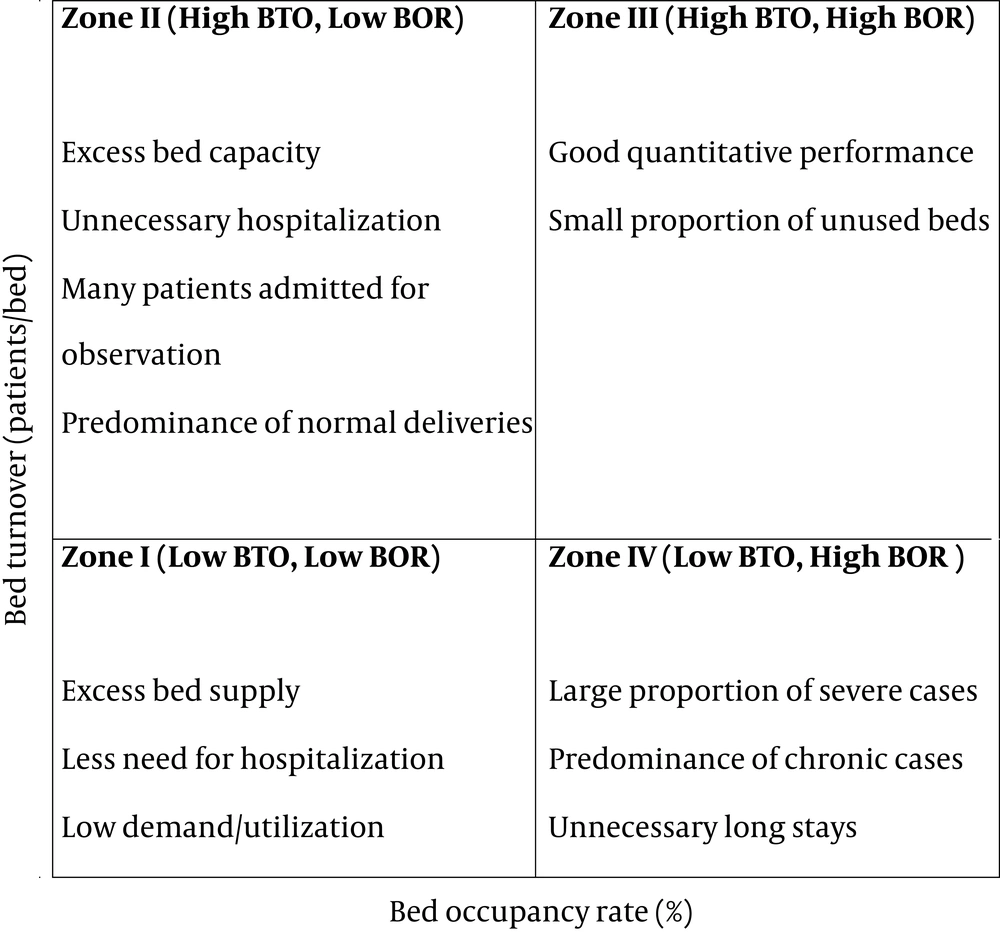
Efficiency: In this study, efficiency indicates the optimal utilization of resources in terms of high occupancy and high turnover. PL technique is a graphical method that uses 3 indicators (BTO, BOR and ALS) concurrently to assess the relative performance of hospitals. In Figure 1, the horizontal and vertical demarcations represent the mean values of bed occupancy rate and bed turnover.
4. Results
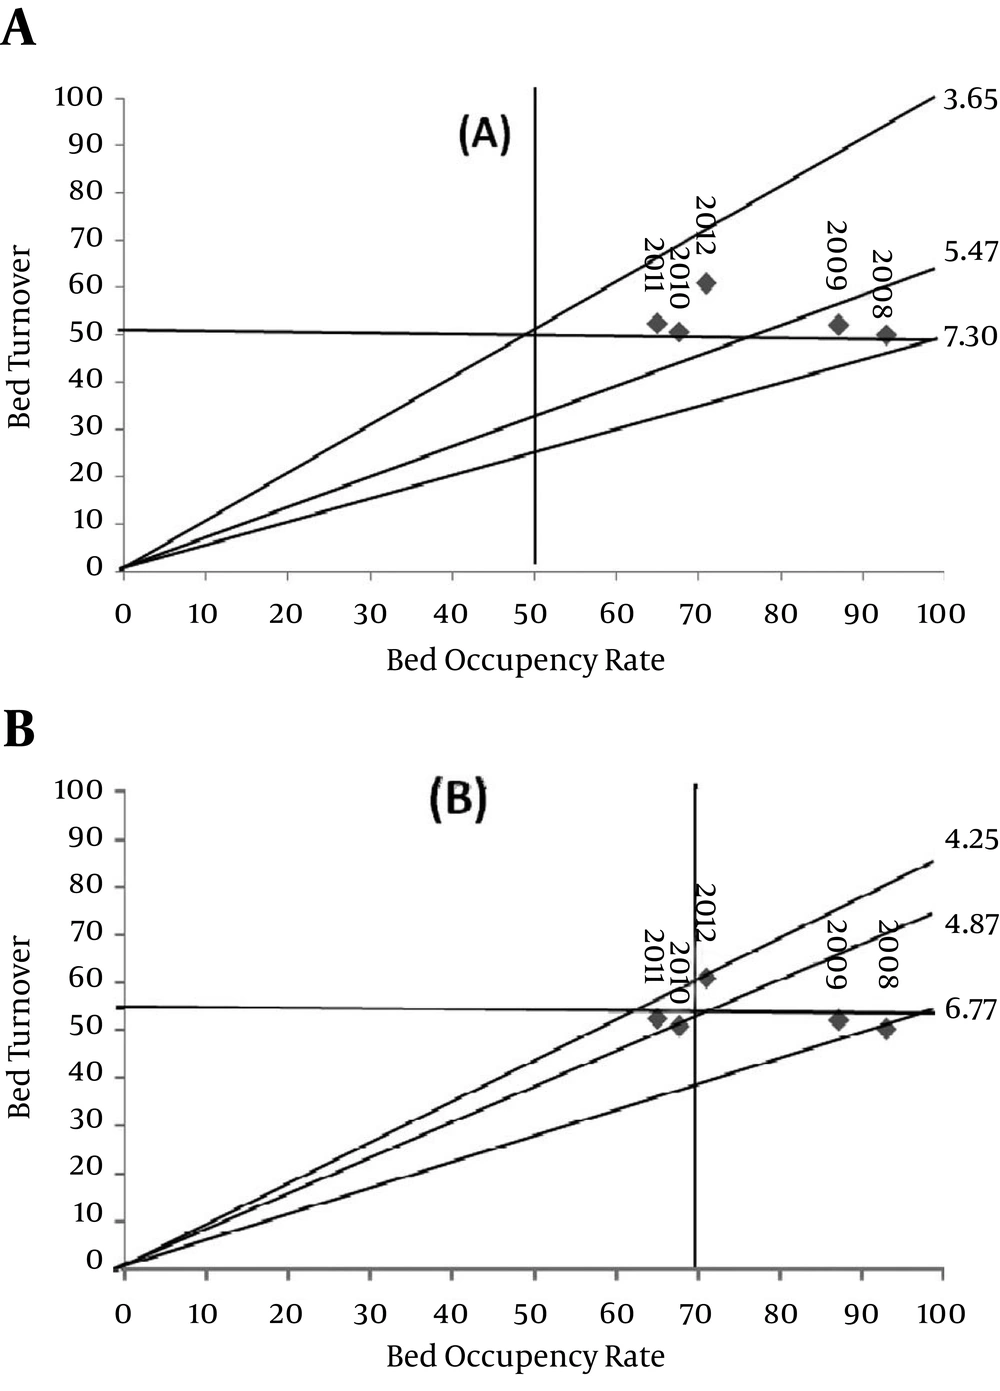
From 2008 to 2012, data from the HIS showed that 95514 patients were discharged from Shahid Faghihi Hospital. Table 1 presents the data for the number of active beds, active bed days, occupied bed days, number of deaths and number of discharges during the study period. The highest occupied bed day was recorded in 2008 and the lowest one in 2011. Except for 2010, the number of deaths and discharged patients increased steadily during the study period. The 5-year trends in hospital performance indices are shown in Table 2. The mean (median) hospital stay decreased from 6.77 (3.11) days in 2008 to 4.25 (2.70) days in 2012. In 2008, bed turnover was 50.03 times/year, the bed occupancy rate was 92.9% and turnover interval was 0.51 days, whereas in 2012 these indices were 60.8 times/year, 70.9% and 1.74 days, respectively. Figure 2 illustrates the location of Shahid Faghihi Hospital in the 4 quadrants of PL model during the study period. In panel A, the horizontal and vertical lines indicate the mean values for bed occupancy rate and bed turnover. During the 5-year study period, the hospital was situated in zone 3 of the model. If the vertical line is set at the accepted norm according to the national standard of more than 70% bed occupancy rate (Figure 2, panel B), performance at our hospital was situated in zone 4 for 2008-2009 and zone 1 for 2010-2011. The hospital was located in zone 3 only in 2012, which indicates a good degree of efficiency and an optimal level of performance.
| Year | Active Beds | Active Bed, d | Occupied bed, d | Deaths, No. (%) | Discharges |
|---|---|---|---|---|---|
| 2008 | 358 | 130670 | 121425 | 702 (3.9) | 17914 |
| 2009 | 358 | 130670 | 113886 | 758 (4.1) | 18635 |
| 2010 | 358 | 130670 | 88426 | 781 (4.3) | 18130 |
| 2011 | 358 | 130670 | 84907 | 800 (4.3) | 18757 |
| 2012 | 363 | 132495 | 93987 | 1029 (4.7) | 22078 |
| Total | 1795 | 655175 | 502632 | 4070 (4.3) | 95514 |
| Years | Length of Stay, d | Bed Turnover, Times/year | Bed Occupancy Rate, % | Turnover Interval, d | |
|---|---|---|---|---|---|
| Mean ± SD | Median | ||||
| 2008 | 6.77 ± 9.8 | 3.11 | 50.1 | 92.9 | 0.51 |
| 2009 | 6.11 ± 8.9 | 3.05 | 52.1 | 87.1 | 0.90 |
| 2010 | 4.87 ± 6.6 | 2.96 | 50.6 | 67.6 | 2.32 |
| 2011 | 4.52 ± 5.9 | 2.89 | 52.4 | 64. 9 | 2.43 |
| 2012 | 4.25 ± 5.8 | 2.70 | 60.8 | 70.9 | 1.74 |
| Total | 5.26 ± 7.6 | 2.94 | 53.2 | 76.7 | 1.59 |
5. Discussion
Statistical indicators are measures used to evaluate hospital performance. Despite their limitations, statistical indicators can provide data that are useful in efforts to improve hospital performance (7, 13). In this study, we used 3 main capacity utilization measures (ALS, BOR, and BTO) to evaluate overall performance at a large public hospital in Shiraz, Iran. Features that distinguish our study from prior surveys in our country are the 5-year duration of the study period and use of PL model to determine trends in hospital performance. The average values for each of 3 capacity utilization measures at our hospital during the 5-year study period were ALS 5.2 ± 7.6 days, BOR 76.7%, and BTO 53.2 times/year. Although ALS showed a downward trend, this value was higher than the target level according to Iranian national standard (less than 3.5 days) (14). An increase in the number of active beds and greater availability of paraclinical services in the context of active bed management may explain the decrease in ALS during recent years. This decrease is in line with a study by Jonaidi et al. the only study that examined 3-year trends in hospital performance in Tehran (15). During the first 4 years of the study period (2008-2011), BOR paralleled the downward trend in ALS. In 2012, ALS went lower than in 2011, whereas BOR in 2012 was 6% higher than in 2011. The increase in the number of admissions may explain the increase in BOR. In 2012, BOR achieved the target value of > 70% according to the national standard. At the hospital studied by Jonaidi et al. BOR increased by 3%, during the period from 2006 to 2008, and was consistently higher than 70% (15). Except for 2010, BTO tended to increase steadily; the overall value was 53.21 times/year, which was lower than the figure for the centers studied by Goshtasebi et al. in 2006 (67.73) and Bahadori et al. in 2009 (85.44). The trend in TI was upward from 2008 to 2011, but this indicator decreased sharply in 2012 in connection with the increase in BTO and decrease in ALS. Overall, this indicator was within the optimal range according to the national standard (less than 2) (3, 4, 14). When all 3 measures were considered simultaneously in PL model, Shahid Faghihi Hospital was located in zone 4 during 2008-2009, a result that reflected long-term hospitalizations and perhaps the underuse of outpatient services. During 2010-2011, because of no significant changes in the number of discharges or active beds and the downward trend in ALS and BOR, the hospital was located in zone 1. In 2012, both BTO and BOR increased, and the hospital was relocated to zone 3, i.e. an acceptable degree of efficiency and optimal level of performance. Several changes at different levels of our health system in recent years may explain the trends toward improvement at our hospital. For example, measures to favor technical and allocative efficiency have been implemented, the allocation of limited resources at the national level has been improved, and adherence to quality control programs such as ISO and clinical governance has been supported at the state level. Another factor that has been effective in improving hospital statistical indicators is the intensification of periodic evaluations in order to assess the impact of new interventions and strategies on performance.
The following potential limitations should be considered too. First, the capacity utilization measures and PL model are simplistic methods for evaluating the hospital performance, and they do not take the quality of services provided by hospitals into account. Second, in our country, hospital information systems are not designed for research projects, so data mining and data extraction were very difficult and time consuming. We conclude that the trends identified at our hospital show evidence of relative improvements in all capacity utilizations measures in 2012. However, in the light of population aging, changes in disease patterns from communicable to no communicable, and limitations in available resources, policymakers and managers should continuously apply new interventions to further increase the hospitals’ performance capacity.

