1. Background
Access to health resources and issues related to inequality in their distribution are important policy concerns for policy makers, managers and researcher in the health sector. WHO report published in 2006 estimated that there are 59 millions of health workers in the world distributed unequally between countries. The report indicated that about 37% of health workers live in the United States and Canada, while only 10% of the global burden of disease in the world is related to these regions. Moreover, about 3% of health workers live in African regions, but these regions have more than 24% of the global burden of diseases (1, 2).
It is believed that access to and utilization of health services among people should not be affected by race, gender, religious, regions and etc. (3). However, since misdistribution of health resources may have a negative impact on health status of population, it is important for health policy-makers to know how health resources are distributed across provinces or states of countries (2). There are many human and physical resources in the health sector. Physicians and hospital beds are usually considered as two of the most important resources in the health system (4), which their misdistribution could adversely affect health status of population, losing health resources and increasing healthcare cost for health system and patients (5, 6).
Increase in the number of health resources such as physician and hospital beds does not necessarily improve health status of population. The distribution of health resources is important and considered as one of the social determinants of health (7). Previous studies examined the level of inequality in distribution of health resources using many measures such as health input population ratio, Gini coefficient, Rabin Hood index, Atkinson index, Thiel index and Concentration index (8-11). Most studies conducted in Iran examined inequality in distribution of health resources in population level (12-14) and there are a few number of studies focusing on distribution of health resources based on health need index (3, 4).
2. Objectives
This study focused on three following research questions. First, how physicians and hospitals beds are distributed across provinces of Iran between 2001 and 2011. Second, whether health resources are distributed based on the population level or health need index. Third, whether the trend in the distribution of physicians and hospital beds is toward inequalities or equalities. Finally, this study could provide useful information for health policy makers for better health resources allocation (physicians and hospital beds) policies across the provinces in Iran.
3. Patients and Methods
This was a cross-sectional and retrospective study. The study setting was Iran. Iran consists of 31 provinces, based on the census 2011, with a population of around 75,149,669 people and located in the Eastern Mediterranean WHO Region (EMRO) with an area of 1,648,195 km2.
In this study, each province was considered as an analysis unit. The data on the number of physicians (general physicians and practitioners) per 10000 populations (PPR), hospital beds per 10000 of populations (HBPR), as well as the number of hospitalized patients were obtained from the Iranian Statistical Center (ISC) and ministry of health (15). In the current study, the number of hospitalized patients was used as health need index (HNI). In addition, data analysis was performed by STATA V.12 (StataCorp LP and USA) and Excel Software.
3.1. Inequality Measures
In the current study, according to other studies (2, 4, 11, 16, 17), to examine inequality in distribution of physicians and hospital beds, the Gini coefficient, Concentration Index and Rabin Hood index were used.
3.1.1. Gini Coefficient and Concentration Index
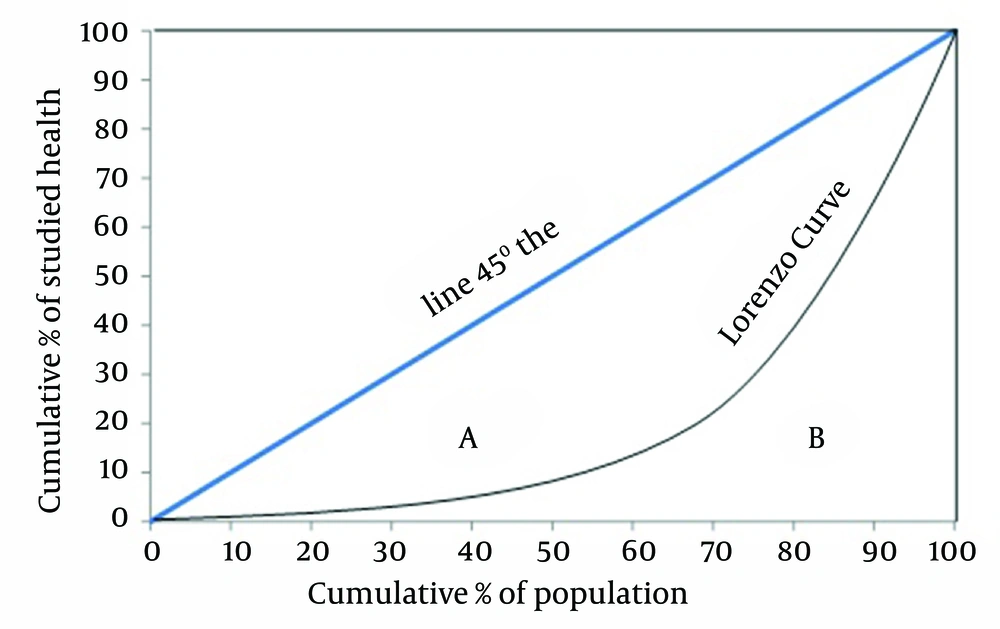
The Gini coefficient is derived from the Lorenz curve (Figure 1) and is used commonly for measuring inequality in distribution of health care resources. It varies between 1 (perfect inequality) and zero (perfect equality). By Lorenz curve, the Gini coefficient is calculated using the following equation:

Where:
G = Gini coefficient, A = the area between the Lorenz curve and the 45° line, A + B = the whole area under the 45° line.
In the Lorenz curve, the cumulative % of health variable and the cumulative % of population are shown on the Y-axis and X- axis, respectively (4, 7). In addition, we used the following Equation to to calculate the Gini coefficient and its standard error (SE) (18).

Where:
G: Gini coefficient: the mean value of distribution, y: health variables in the province, N: total number of provinces.
Also, the Jackknife variance estimator for the Gini coefficient is derived from the following equation:

Where:
V = the value estimators; Gi = the value of Gini coefficient; N = total number of provinces.
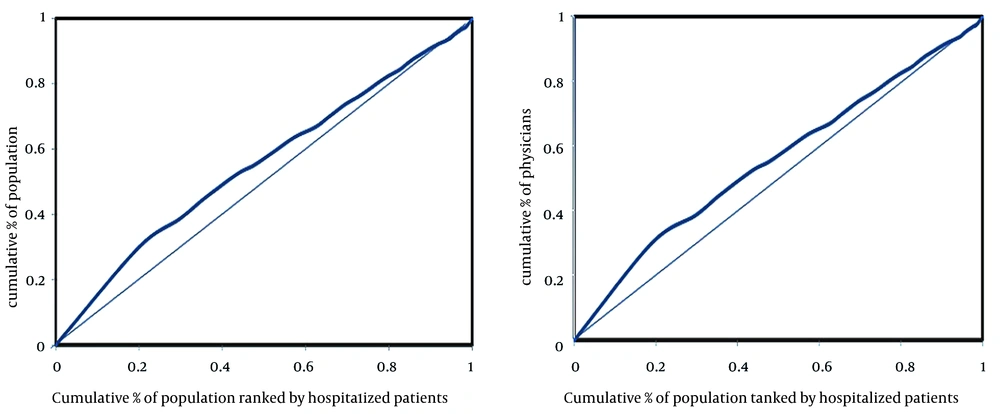
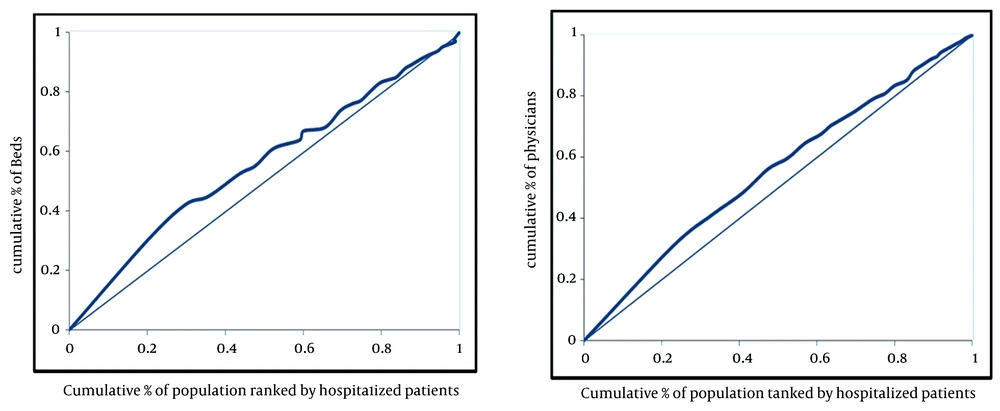
In the concentration curve, the Cumulative % of health variable (physician and hospital beds) is plotted on Y-axis and the cumulative % of population ranked by number of hospitalized patients placed on X-axis. The concentration curve can be lied above (negative value) and below (positive value) the 450 line. The concentration index is defined as two times the area the area between the concentration curve and the 450 line (4, 19) and takes values between -1 and +1. In the current study, negative value (concentration curve above the 450 line) indicates that there are fewer physicians or hospital beds in the provinces with more health need index, and vice versa. Moreover, the concentration index is equal zero when there is no inequality in distribution of physician or hospital beds in the provinces of Iran.
We used the following Equation to to calculate the Concentration index (20).

Where:
P is the cumulative % of the population ranked by number of hospitalized patients; L is the cumulative % of the health variable (physician or hospital beds).
3.1.2. The Rabin Hood Index
The Rabin Hood index is based on the Lorenz curve and takes values between zero (perfect equality) and 100 % (perfect inequality). This index is equivalent to the maximum vertical distance between the Lorenz curve and the 450 line. In the current study, this index indicates the percentage of total number of physicians or hospital beds that should be transferred from provinces above the mean for the country to those below that figure to achieve equality in the distribution of physicians or hospital beds in all provinces (21, 22). We used the following equation to calculate the Rabin Hood index:

Where:
R: Robin Hood index; i: the number of quintile; n: total number of quintile; A: Access in quartile i (%) and N: Need in quartile i (%).
4. Results
In 2011 compared to 2001, the total population in Iran increased about 11%, while the number of physicians and hospital beds increased by 69% and 26%, respectively. In 2001, the highest and lowest PPR belonged to the provinces of Semnan (5.8) and Northern Khorasan (0.55), while in 2011, they related to the provinces of Chaharmahal va Bakhtiari (9.8) and Northern Khorasan (1.6), respectively. In 2001 the highest and lowest values of HBPR related to the provinces of Yazd (25) and South Khorasan (7.9), respectively. While in 2011, Yazd (27.8) and Bushehr (9.15) provinces had the highest and lowest values of HBPR, respectively. On average, PPR for Iran was 3.02 in 2001, while it was 4.6 in 2011. In addition, HBPR for Iran in 2001 and 2011 were 9.4 and 16.2, respectively.
The Gini coefficient for PPR and HBPR based on population level and HNI is presented in Table 1. The current study showed that the Gini coefficient of PPR and HBPR based on population level in 2011 were 0.16 and 0.47, respectively. While based on HNI, they were 0.48 and 0.47, respectively.
| 2001 | 2011 | |||
|---|---|---|---|---|
| Population Level | HNI | Population Level | HNI | |
| HPR | 0.19 (0.027) | 0.48 (0.17) | 0.16 (0.028) | 0.47 (0.143) |
| HBPR | 0.16 (0.02) | 0.38 (0.13) | 0.13 (0.027) | 0.37 (0.115) |
Gini Coefficient for PPR and HBPR Based on Population Level and PHN in 2001 and 2011 a
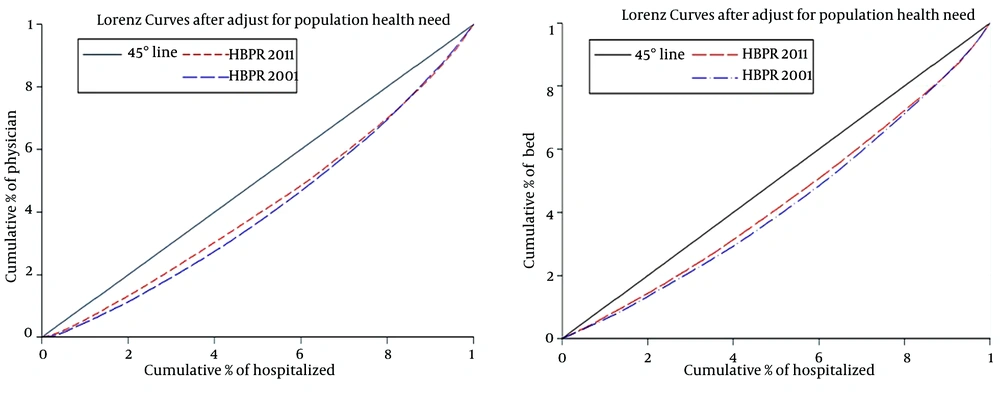
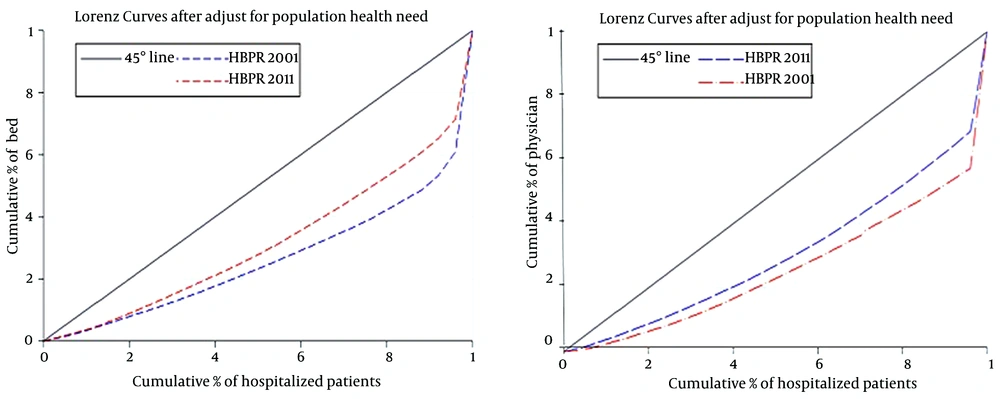
The Lorenz curves of the distribution of PPR and HBPR in Iran based on population level and health need index are shown in Figures 2 and 3, respectively. As can be seen in Figures 2 and 3, the distance between Lorenz curve and 450 Line for PRR and HBPR based on HNI was higher compared to the population level.
The Concentration index for HBPR in 2001 and 2011 were -0.11 and -0.10, respectively. However, value of this index for PPR in 2001 and 2011 were -0.13 and -0.11, respectively. The concentration curves for HBPR and PPR ranked based on the number of hospitalized patients for Iran in 2001 and 2011 are shown in Figures 4 and 5, respectively.
The Robin Hood index for PPR and HBPR in 2001 and 2011 are shown in Table 2. The Robin Hood indexes for PPR and HBPR in 2001 were 14% and 7%, respectively; while in 2011 were 11% and 5 %, respectively.
5. Discussion
Inequality in distribution of health resources is a persistent issue for healthcare researchers, practitioner and health policy makers worldwide. Increase in the quantity of health resources did not necessarily decrease geographical inequality, even though all provinces have more physicians or hospital beds. So this issue that how they were distributed is also important and demonstrated in previous studies in Japan (21) and Albania (22). The aim of this study was examination of the status of access and need to physicians and hospital beds in provinces of Iran for the years 2001 and 2011.
Previous studies conducted in Iran examined inequality in distribution of health resources based on population level. They concluded that distribution of health resources was appropriate and equally distributed (13, 14). Moreover, in Iran, the number of studies is few focusing on distribution of health resources based on health need index. In this study, the level of inequality in distribution of physicians and hospital beds were evaluated based on the health need index (number of hospitalized patients) and the population level. The results of our study implied that inequality in distribution of physicians and hospital beds based on HNI was three times higher compared to the population level. The overall inequality in distribution of physicians and hospital beds based on population level and HNI has been slightly decreased.
The Gini coefficient for physicians (hospital beds) based on population level in 2001 was 0.19 (0.16) and in 2011 was 0.16 (0.13), while this value based on HNI for physician (hospital beds) in 2001 was 0.48 (0.38) and in 2011 were 0.37 and 0.47, respectively. This finding is consistent with studies conducted in Albania (8) and Iran (4, 12). A study by Theodorakis et al. (8) demonstrated that the Gini coefficients for general physician in Albania based on population level was 0.154 and based on need index was 0.288, which were lower compared to the results of our study. Their study was different with our study from two aspects. First, in their study the consultation rate was considered as need index, while in our study the number of hospitalized patients was used. Second, in their study general physicians were only assessed, while in our study general physicians and practitioners were considered together. A study by Omrani-Khoo et al. about the distribution of nephrologists and hemodialysis beds among provinces of Iran in 2011 indicated that the Gini coefficient of nephrologists was 0.38 (4). Moreover, the results of a study performed in Japan in 2006 showed that the Gini coefficient for all physicians in 2006 was 0.33, which was in accordance with our study (23).
The Robin Hood index for physician and hospital beds in 2011 were 11% and 15 %, respectively. These results indicate that to have an equal distribution, 1.3 hospital beds and 0.5 physician per 10000 populations should be redistributed in the country. Omrani-Khoo et al. found the value of Robin Hood index as 24% for hemodialysis beds regarding health need (number of patients) (4). The concentration index for physician and hospital beds in 2011 were -0.11 and -0.10, respectively. This implies that in provinces with more HNI, there were fewer physicians or hospital beds and Vice versa. In Omrani-Khoo et al. study, the concentration index for nephrologists regarding health need was -0.31, which was consistent with our findings (4). Munga et al. found that the concentration index for health workers in Tanzania in 2004 were -0.26 for all districts, -0.29 for urban districts and -0.22 for rural districts, respectively. They concluded that there is a large inequality in distribution of health workers across districts in Tanzania (19). Totally, when the burden of disease is equally distributed among provinces and in population level, the use of population level to resources allocation may be effective, but if distribution of diseases burden is unequal, the use of need indicators, such as the number of patients, mortality rate and so on, is more reasonable and enhance the efficiency of health system. This study had some limitations: first, we used data from Iranian Statistical center that may have potential incompleteness and measurement errors in the registry data. Second, this study assessed distribution of health resources among provinces of Iran; hence generalizability of the results within provinces or in the individual level may be limited. Third, we used the number of hospitalized patients as health need index; while the higher rate of hospitalization in a given province can be explained by higher accessibility of hospital beds in each province. This means that the real inequality is even higher than what reported here.
This study showed that PPR and HBPR in Iran increased from 2001 to 2011, but inequality in their distribution was slightly decreased. It was shown that increase in the number of health resources did not necessarily decrease misdistribution. In addition, our findings showed that inequality in distribution of physicians and hospital beds based on level of population was lower compared to the health need index. It was shown that physician and hospital beds are distributed according to the population level in the country.
