1. Introduction
The Act (Amateur Sports Law) of American federation government, passed in 1972, makes it illegal for a federally funded institution to discriminate on the basis of sex or gender. In sports rule, the part of legislation often return to the attempt to increase the equality of women's sports in colleges (1-4). During the past decade Iranian women's sports in colleges has got better. For the first time in 1995 the quality of competitions and number of athletic fields in females were few. But in sixth period of these competitions numbers of athletics field increased and the quality got better. The assessment of anthropometric characteristics in different fields of sports has increased in the last decay. It has been demonstrated that the specific anthropometric profile could indicate whether the player would be suitable for a specific field of sport (5-8) The measuring of morphological characteristics of athletes can be important in relating body composition to sports performance (9). Awareness of a successful athlete’s body composition is essential for selecting talent people (10). On the other hand, central obesity or increased waist circumference could increase the risk for some diseases, such as diabetes, hypertension and cardiovascular disease. Improving body composition or fitness are decreased risk of cardiovascular disease and improved basal metabolic rate, as well (9, 10). There isn't enough data on the morphological characteristics of young female athletes. Therefore, the aim of this study was to find the anthropometric characteristics of females in colleges to use this for identification of talented women's players and find the reasons that affect their athletic performance.
2. Methods
2.1. Subjects
The present study was conducted on 251 young female subjects of age group 18-25 years. The subjects were randomly selected from the different colleges who gathered to do sport competitions in student athletic race in . A questioner is used for each Subject, to write their name and family name, field, university, age and sport background, and their height, weight, waist and hip circumferences is mentioned at the end of this sheet. All procedures were approved by the university’s institutional review board and all participants provided written informed consent before taking part in the experiment.
2.2. Data collection
Measurements were performed following the standardized techniques adopted by the International Society for the Advancement of Kinanthropometry (ISAK) (11). All measurements were taken by the same investigator. All anthropometries were measured by well-trained personnel. The technical error of measurement (TEM) was lower than 1% for all measurements. The instruments were calibrated prior to use. Anthropometric variables included body mass, height, weight, hip and waist circumferences. Height was measured without shoes on a stadiometer (Seca Corp, , ) to the nearest 0.1 cm, and the weight was recorded light Clothing on a portable scale (model 765, Seca Corporation, hamburg, ) to the nearest 0.1 kg. BMI was calculated as weight/height (2) where weight was expressed in kilograms (kg) and height in meters (m).
Practical issues in population studies rendered anthropometric index further used for characterizing abdominal obesity (5). The waist circumference (WC) alone is a preferred indicator for abdominal obesity mainly because of its close connection with visceral fat and the simplicity of measurement (12-14). A high waist to hip ratio (WHR) reflects the body shape and indicates a smaller hip circumference (HC) as well as an excess of visceral fat (12-14).
Waist circumference was measured at the smallest horizontal trunk circumference and hip girth was measured at the largest horizontal circumference around the hip and buttocks, with non-stretching fiberglass or metal tapes (SECA, Hamburg, Germany), to the nearest 0.1 cm. WHR was, then, calculated as waist circumference divided by hip circumference. We couldn't measure their previous sizes, because of limitation of study.
2.3. Criteria
Overweight was determined as a body mass index of 25 or more (BMI values: underweight < 18.5, normal weight 18.5-25, overweight 25-29.9, and obese > 30 kg/m2) (15, 16). Abdominal obesity by WC was defined as WC ≥ 80 cm in female, according to Asian’s criteria (5). The criterion of abdominal obesity of high WHR was defined as WHR ≥ 0.85 in female (17).
2.4. Statistical Analysis
The data were expressed as the mean values and their standard errors (S.E.). The variables were analyzed by one-way analysis of variance (ANOVA). When a significant effect was found between groups, Tukey or LSD post hoc tests were performed. Pearson correlations performed between exercise break off and other anthropometric characteristics. All analyses were performed using SPSS 16. The statistical significance level was set at P ≤ 0.05.
3. Results
The anthropometric characteristics of the study participants are shown in Table 1.
251 subjects by the mean age of 22 years old examined randomly. These students took apart in tennis field 14.7%, badminton 17.5%, in chess 7.6%, swimming 4.8%, physical fitness 19.9%, basketball 12.4%, foot sol 10%, shooting 5.2% and running 6%.
Averagely they took apart 19 hours/month in sport exercising.
63.3 % of these athletes cut their athletic periods 1/2 years by any reason. 45.8 % of them had national score. 21.9% of them had province score and 9.6% of them had small province score.
3.1. The average of in female athlete students:
According to table 1and 2, the mean of weight and height were about 55.5 kg and 1.61m respectively and the mean of BMI was 21.7 kg/m2. The average of BMI in female athlete in different fields was between 21-23 kg/m2. Therefore, the average of MBI in all fields was normal and statistically, there is no significant difference between groups.
3.2. The mean of waist and hip circumference in female athlete students and the ratio of them:
According to table 1and 2 the average of waist and hip circumference in these women were 70.98cm and 94.89cm respectively. According to international standards of WHO the females who their waist circumference is over then 80cm and hip circumference is more than 90cm, are obese. In this study, it was observed that 92% of whole female athletes’ waist circumference was less then 80cm and 8% of them were over 80 cm. Statistically, there is no significant difference among different groups (P < 0.8).
According to table 1 and 2, the average of waist to hip circumference ratio was 0.75. According to international standards if waist to hip ratio in males and females be over than 0.9 and 0.8 respectively, they are obese. 88.4% of athletes were less than 0.8 and 11.6% of them were more than 0.8. The average of waist to hip circumference ratio in all athletic fields were less than 0.8 and there is no statistically significant correlation among different groups (P < 0.06).
3.3. The average of waist to height circumference ratio in female students:
According to table 1 and 2, the average of waist to height circumference ratio was 44.11. According to international standards if waist to height ratio in males and females be over then 50, they are obese. 91.6% of athletes are less then 50 and 8/4% of them are over than 50. The average of waist to height circumference ratio in all athletics fields are less than 50 and there is no statistically significant correlation among different groups (P < 0.06).
3.4. The average of exercise break off in female athlete students:
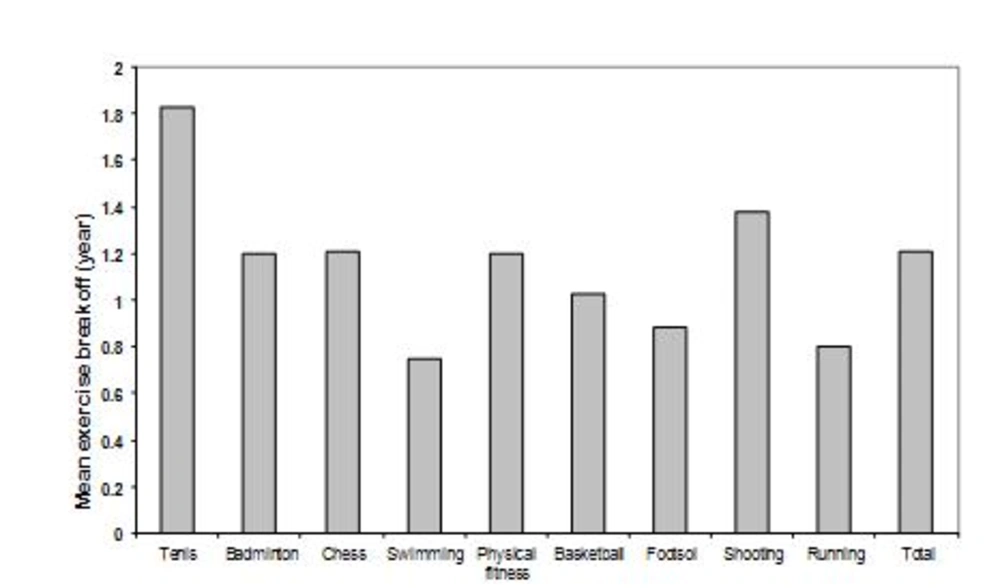
According to fig 1, the mean of exercise break off in these females was about 1 year and 2 months. The average of exercise break off in Tennis was about 1 year and 2 month and in shooting was about 1 year and 4 months.
3.5. The correlation between waist to height circumference ratio with the average of exercise break off:
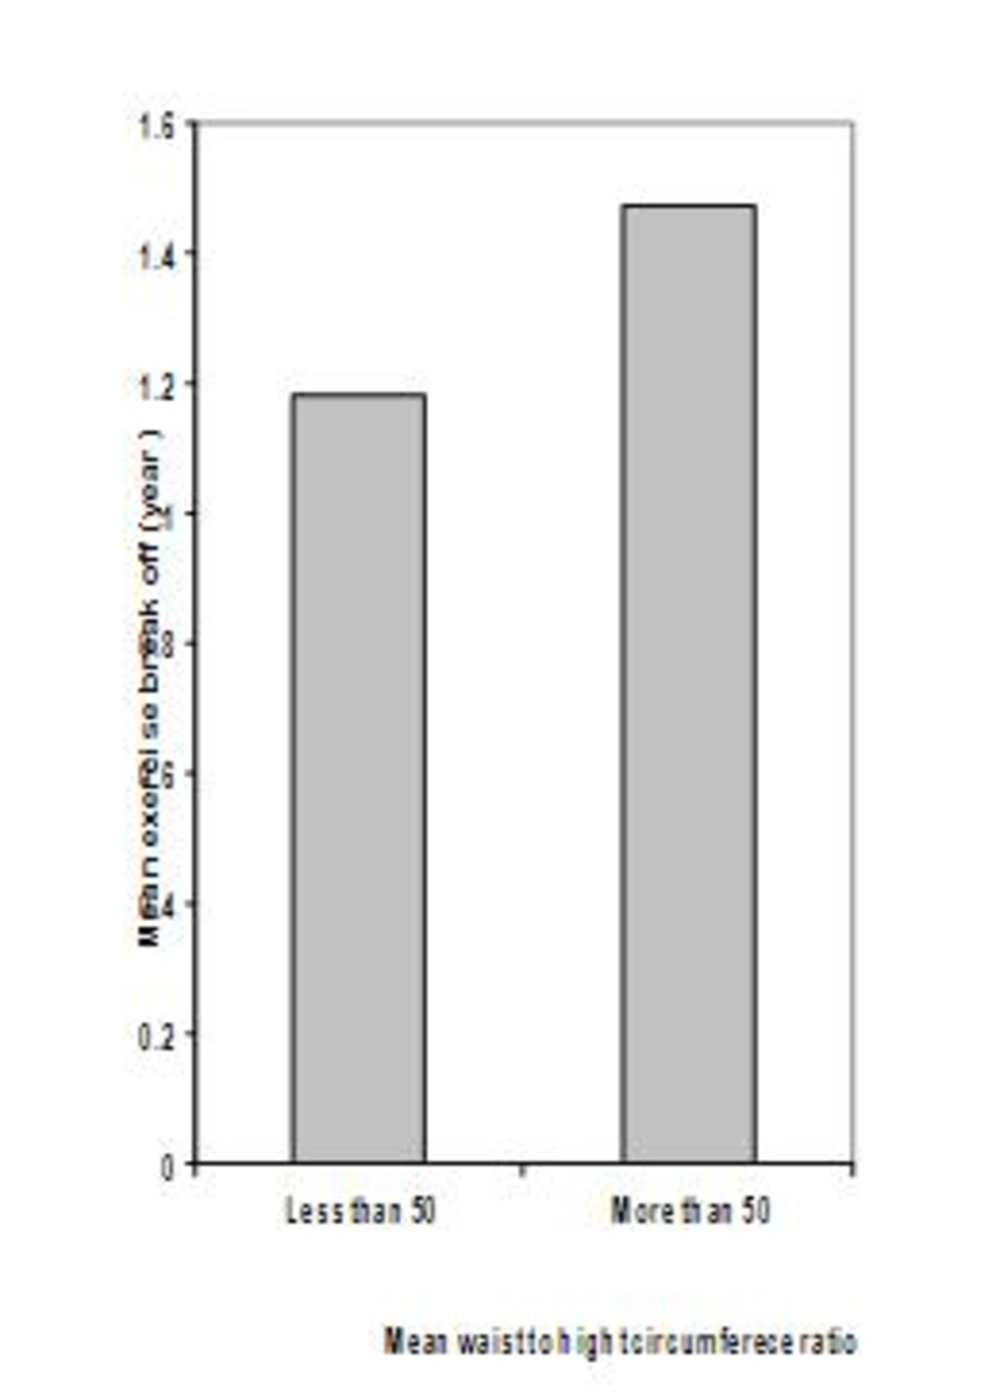
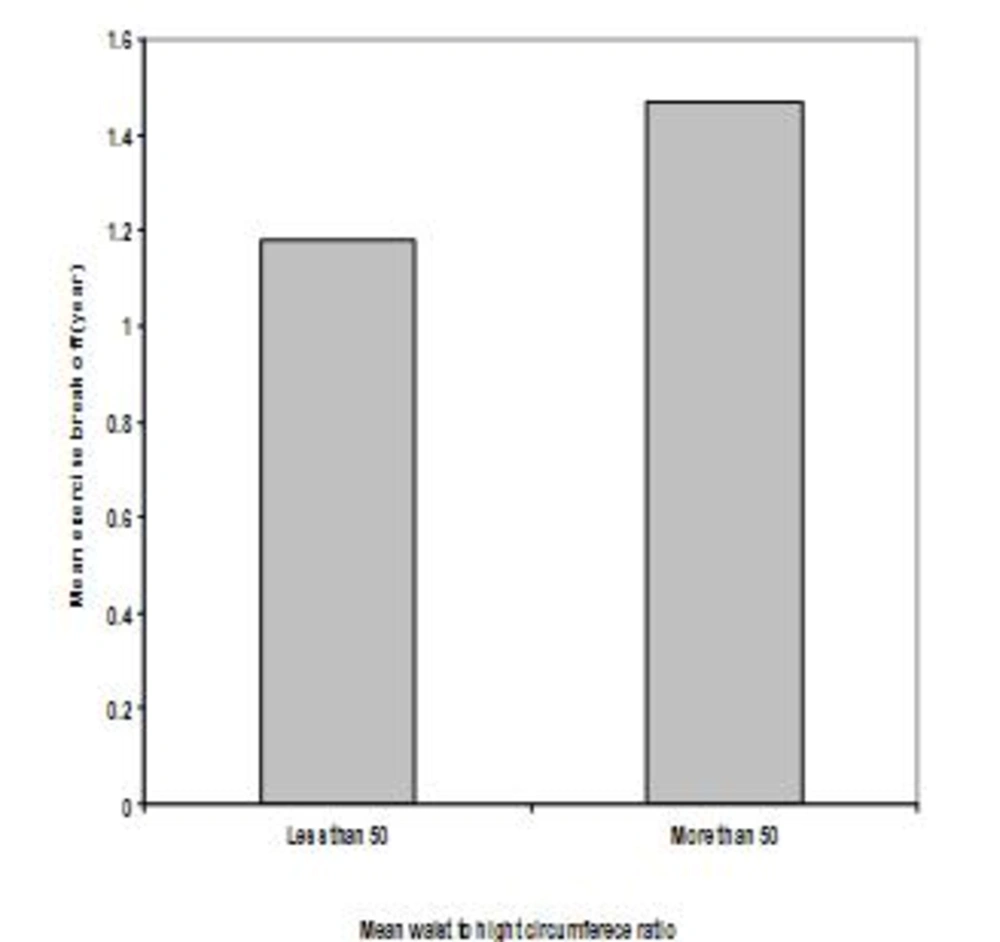
According to figure 2, the people who had 1 year and 5 months break off had mare then 50 average of waist to height ratio and were obese. But the people, who had 1 year and 2 months break off, were less than 50 and were normal.
6 .The correlation between BMI with the average of exercise break off:
According to figure 3, the people who their break off were more than 1 year and 6 months, had over weight and their BMI was between 25-29.9. But in females athlete who their break off was about 1 year and 2 months had normal weight and their BMI were less than 25 kg/m2.
4. Discussion
Students were asked whether or not they regularly practiced sports. This was the criterion used to determine the activity status of the students. In this stdy we showed (Table 1) that the students who practiced sports regularly have lower BMI than those who did not. Carnethon) demonstrated a negative correlation between the intensity of physical exercise and BMI (18). Our study indicated that BMI in 6.4% of athletics team’s member was between 25-30 and they have over weight. According to koutlete index the overweight not only is the main cause of danger in people health but also by the point of fitness view, exercising in champion level is not favorite. 0.8% of athletes by BMI over 30 has more unstable situation. Doing full struggle exercise for this group of athletes is stressful. The equations derived in the present study appear to estimate BMI in young women less accurately than any of the previously reported equations (2).
The association of BMI and the average of exercise break off were demonstrated to the students by the establishment of a positive correlation between their obtained data of BMI and their exercise break off. It was mentioned to the students that several investigators reported that BMI tends to overestimate fatness in athletic with the high exercise break off.
| Minimum | Maximum | Mean ± SD | |
|---|---|---|---|
| Age, years | 18 | 30 | 22.09 ± 2.20 |
| Weight, kg | 36.5 | 89 | 55.56 ± 6.81 |
| Height, m | 1.45 | 1.8 | 1.61 ± 0.05 |
| Waist Circumference, cm | 58 | 1 | 70.98 ± 5.68 |
| Hip Circumference, cm | 80.5 | 118 | 94.89 ± 5.07 |
| Body Mass Index(BMI), kg/m2 | 16.41 | 32.69 | 21.27 ± 2.46 |
| Waist to Height ratio | 36.31 | 59.39 | 44.11 ± 3.79 |
| Waist to Hip ratio | 0.66 | 0.92 | 0.75 ± 0.04 |
aThe average of BMI, waist and hip circumference and the ratio of them; (P < 0.8).
bThe average of waist to height circumference ratio; (P < 0.06).
| field | Weight (kg) | Height (M) | Waist (cm) | Hip (cm) | BMI (kg/m) | Waist/Height | Waist/Hip |
|---|---|---|---|---|---|---|---|
| Tenis | 54.97 | 1.62 | 70.89 | 94.91 | 20.83 | 43.68 | 0.74 |
| Badminton | 54.96 | 1.61 | 71.04 | 94.23 | 21.26 | 44.15 | 0.75 |
| Chess | 53.63 | 1.59 | 69.92 | 94.36 | 21.07 | 43.85 | 0.74 |
| Swimming | 56.29 | 1.61 | 71.41 | 95.20 | 21.65 | 44.31 | 0.74 |
| Physical fitness | 53.5 | 1.60 | 69.58 | 92.85 | 20.87 | 43.47 | 0.74 |
| Basketball | 59.11 | 1.64 | 72.19 | 97.24 | 21.94 | 44.00 | 0.74 |
| Footsol | 55.68 | 1.63 | 71.08 | 95.18 | 20.93 | 43.64 | 0.74 |
| Shooting | 57.76 | 1.60 | 74.00 | 97.00 | 22.48 | 46.17 | 0.76 |
| Running | 55.53 | 1.61 | 69.59 | 94.96 | 21.31 | 44.85 | 0.76 |
| Mean | 55.56 | 1.61 | 70.98 | 94.89 | 21.27 | 44.11 | 0.75 |
aThe average of BMI, waist and hip circumference and the ratio of them; (P < 0.8)
bThe average of waist to height circumference ratio; (P < 0.06)
Sayyah et al, 2006, indicated the average of BMI in female athlete students was about 21.48 + _2.62. As it is observed Body Mass Index (BMI) in participated females’ athlete students has not so much differences (19). There was a significant correlation between BMI and physical fitness in males and females (20). Olson et al., (1995) indicated the positive correlation for heart rate and negative for BMI and age (20). Toubita showed that there is reversed relation between BMI and VO2 MAX. Athlete medicine college of U.S.A suggests the people for decreasing BMI should decrease amount of energy receiving and increase physical exercises. To access this aim, decreasing amount of energy between 500 to 1000 kcal is suggested. By decreasing fat in diet to less that 30% of whole of total received energy in a day, weight decreasing will accelerate. Taking part in physical exercises for minimum 150 min in a week that is by middle intensity will has an obvious effect on health (21). Garry et al., 2001, indicated that there is a special correlation between BMI and lipoprotein assimilation in football profession players (22). He declared that sport exercises improve the level of lipoprotein. Meanwhile high levels BMI cause unsuitable lipoprotein level. This study showed that there was negative significant correlation between BMI and LDL (P < %1) and positive significant correlation with HDL and cholesterol (22).
In the present study, according to table 1-2, the average of WC to HC ratio is about 0.75+-%41that is standard amount (less than 0.8 in women). Tri-chopoulou et al, 1995, analyzed physical exercise and inside energy of body and their correlation with WC to HC ratio in females and males and this ratio is mentioned by the title of several chronic diseases factors (23). Moreover, in our study in some of athletes, WC to HC ratio and WC to height, was over than standards limitation, that WC is 8% of students were over than 80 cm and the ratio of WC to HC ratio in 11.6% of students were over than 0.8 and the ratio of WC to height in 8.4% of athlete students were over than 50. These indexes indicated extra local fat that beside BMI index is a suitable criterion to test and examine physical fitness.
In this study, it was also indicated that there is a correlation between BMI and exercise break off and also between the ratio of WC to height and to exercise break off. Those students who their, exercise break off were over than 1 year and 2 month, had BMI increasing and also faced by increasing of the ratio of WC to height.
In conclusion, most of student in various sport fields were in normal zone of BMI and waist circumference to hip circumference ratio were normal. This study suggests that waist circumference (WC) and hip circumference (HC) based on the residual method is a useful indicator of abdominal obesity in females. Meanwhile, waist to hip ratio and waist to height ratio also showed the central obesity. Although the WC has been widely accepted indicator for abdominal obesity in western countries, whether the predictive power of WC may be extrapolated into Asian countries still remains controversial (24-26). One of the usages of Anthropometric characteristics like WC, HC and height is in clothing industry development that can use these indexes to design athlete’s wear in many cases optimum clothes. By using this information, athlete clothing manufactures can use these averages. Finally by considering some findings about BMI and the WC to HC ratio and WC to height, suggest to completion and exercise responsible to design special programs for these specific athletes. Moreover, this study showed that the students who break the exercise off for 1.6 year were overweight. The mean weights to height circumference ratio of students who break the exercise off for 1.4 year were more than50. Therefore, it can probably affect their athletic performance.


