1. Background
Coeliac disease (CD), known as gluten sensitivity, is an autoimmune condition characterized by the atrophy of small intestine. It has been estimated that CD affects 1% of the western population (1). CD affects a wide age spectrum encompassing pediatrics, young and elderly people. The diagnosis of CD is currently dependent on a combination of clinical, histological, and serological approaches (2). The susceptibility to CD is attributed to the presence of certain HLA alleles (HLA-DQ2 and HLD-DQ8) as the dominant factor in the development of CD. Adherence to a long-term gluten-free diet (GFD) is necessary for the management of CD.
Evaluating the disease activity in CD patients requires performing the screening tests routinely. In addition, the efficiency of new therapeutic strategies (such as gluten proteases and immunomodulators) for CD can be validated by using sensitive screening markers (3). Being highly invasive in nature, using sensitive screening markers is not amenable by intestinal biopsies and therefore, it necessitates the application of non-invasive markers. On the other hand, available serological markers of CD can be useful in the diagnosis phase; however, these markers have limitations for predicting relapse or remission during the course of CD (1, 4).
Fecal calprotectin (FC) is a relatively new inflammatory marker for intestinal pathological changes. It has been used for monitoring common intestinal inflammatory diseases including inflammatory bowel disease (IBD), Ulcerative colitis (UC), and Crohn’s disease (CD) (5-7). FC also elevates in colitis and gastrointestinal neoplasms (8, 9). Accordingly, FC has been superior to traditionally available markers of inflammation such as C-reactive protein for reflecting intestinal atrophy (10). Furthermore, FC has been suggested as a reliable marker for predicting the relapse of intestinal inflammation in IBD (8). FC also has the potential to be used as a point of care test by patients in their homes (5).
2. Objectives
The role of FC as a disease indicator in CD is uncertain. There are a few studies on this issue representing inconclusive remarks. We aimed to assess the diagnostic capacity of FC in newly diagnosed CD children.
3. Methods
3.1. Study Population
This study included 70 newly diagnosed CD children recruited from the pediatric ward of Amir-Al-Momenin Hospital in Zabol city, the southeast of Iran. As controls, 70 healthy age and sex-matched children were recruited from the same geographical region. The sample size was determined based on the availability of newly diagnosed CD children and the report of Biskou et al. (11). The individuals with systemic disorders, family history of intestinal inflammatory disease, and history of taking a gluten-free diet (GFD) were excluded. The study was performed during June 2016 - September 2017. It was approved by the Ethics Committee of Zabol University of Medical Sciences. We followed the principals of the Declaration of Helsinki.
3.2. Serological Assessment
Blood samples were drawn (5 mL) from each participant in the morning. The samples were immediately transferred to the laboratory of the hospital where sera were separated by centrifuging at 5000 rpm. The serum samples were kept at -20ºC until use. The levels of IgA anti-tTG were determined using specific ELISA kits (AESKULISA tTg-A New generation, Germany). The titers of higher than 20 U/mL were considered positive (12, 13).
3.3. Intestinal Biopsy
Upper endoscopy was performed to obtain biopsy samples. Histological diagnosis was made based on the observation of villous atrophy in at least one biopsy from the bulb and four biopsies from the distal duodenum. The biopsies were observed by the same experienced pathologist. Only were those children with a Marsh score of 3 included in the study.
3.4. FC Measurement
Stool samples were obtained in the morning in sterile containers and stored in a freezer (-20ºC) until use. A specific ELISA kit (Calprotectin ELISA, EuroImmun, Germany) was purchased. The protocol was followed as noted in the manufacturer’s instructions.
3.5. Statistical Analysis
Statistical methods were performed in SPSS 19 software. Shapiro-Wilk test was used to determine the normality of data distribution. Descriptive measures (means, standard deviations, and frequencies) were deployed to present the data. Independent sample t-test and Fisher’s exact test were considered to assess any association between intended variables. Receiver operating characteristic (ROC) analysis was used to ascertain the validity of FC levels for the diagnosis of CD. The significance level was considered at P < 0.05.
4. Results
Overall, women constituted 83 out of 140 participants (59.7%). In the sample of children with CD, females and males constituted the ratios of 64.3% (45/70) and 35.7% (27/70), respectively. In healthy children, there were 38 (55.1%) and 32 (44.9%) females and males, respectively. The gender distribution showed no significant difference between the two groups (P = 0.1). The mean age of the participants was 7.3 ± 4.1 (range 1 to 18 years old). Three was no significant difference in the mean age between children with CD (6.3 ± 3.4) and without CD (8.3 ± 4.5, P = 0.2).
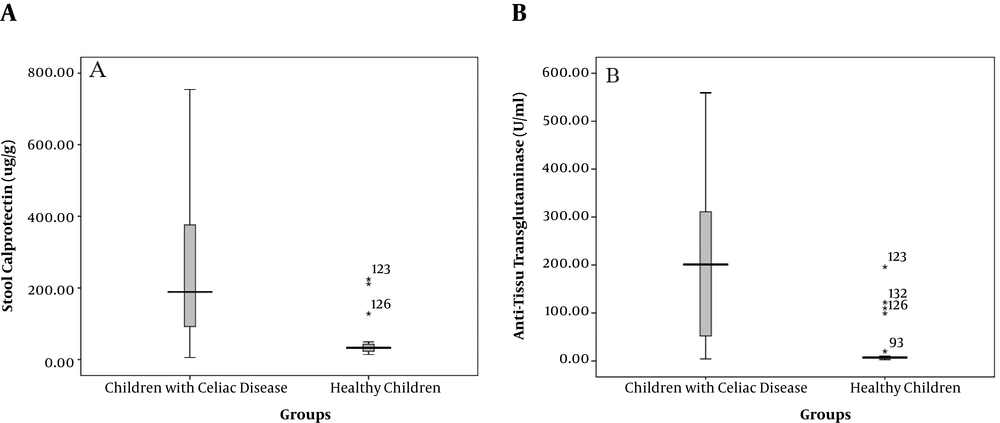
The mean level of FC was significantly higher in patients (239.1 ± 177.3 μg/g) than in healthy controls (38.5 ± 34.6 μg/g, P < 0.001). Accordingly, 90% of children with CD had the FC levels of higher than 50 μg/g while only 4.3% of the healthy controls showed values above this cutoff (Table 1). In addition, the titer of anti-tTG was significantly higher in patients than in healthy children (205.9 ± 156.2 U/mL vs. 6.7 ± 2.1 U/mL, respectively, P < 0.001, Figure 1).
| Fecal Calprotectin Level | Celiac Disease (N = 70), No. (%) | Healthy Controls (N = 70), No. (%) | P Value |
|---|---|---|---|
| < 50 µg/g | 7 (10) | 67 (95.7) | < 0.001a |
| > 50 µg/g | 63 (90) | 3 (4.3) |
The Ratios of Normal and Abnormal Fecal Calprotectin Levels in Children with CD and Healthy Children
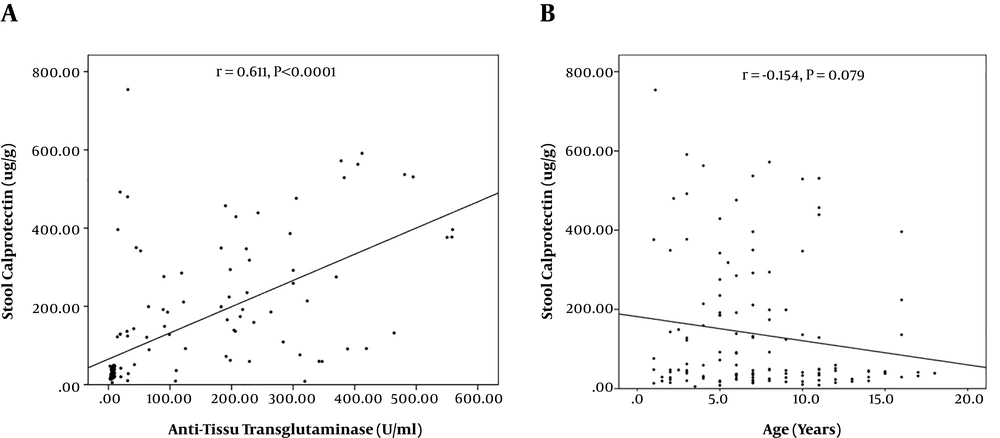
There was a significant correlation between the FC level and anti-tTG titer (Figure 2A). However, the correlation was not statistically significant between FC and age (Figure 2B).
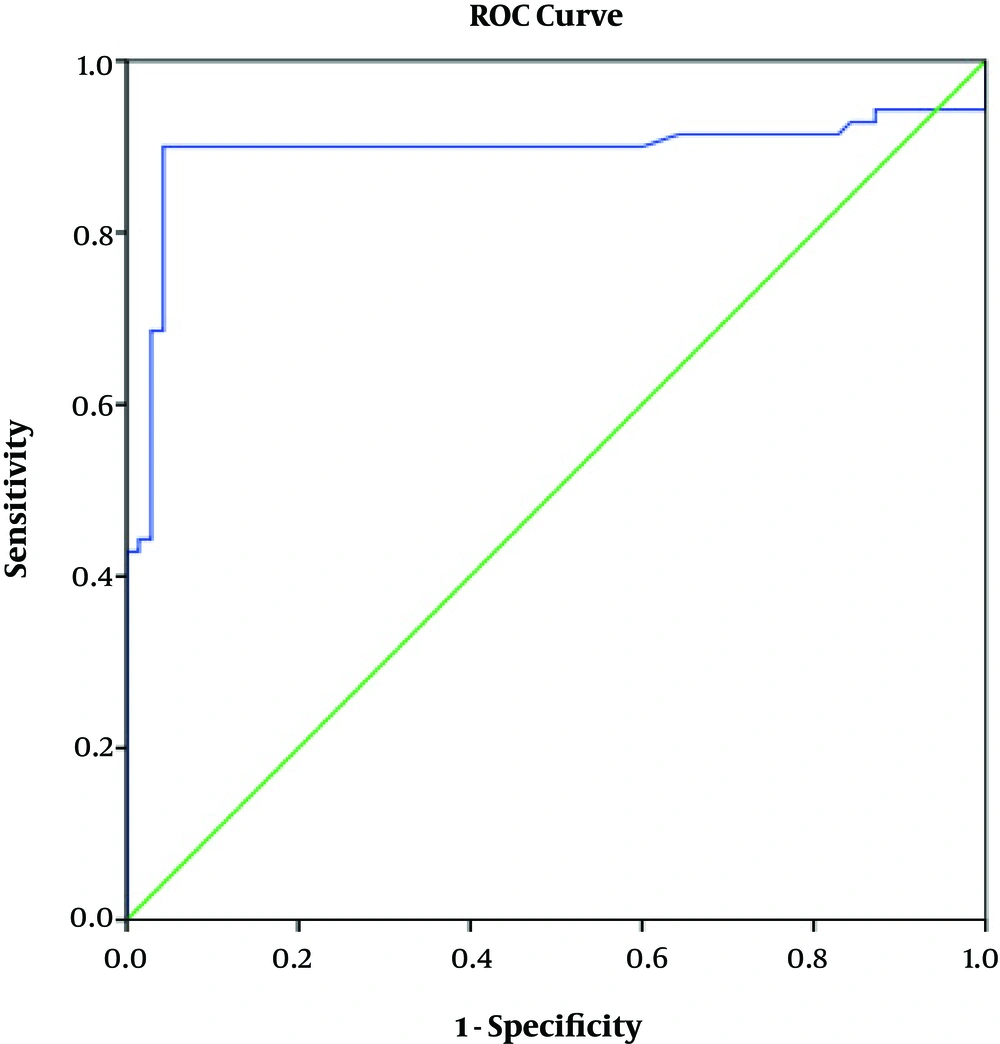
ROC curve analysis revealed a high AUC value for the FC level regarding the diagnosis of CD (AUC = 0.893, 95% CI: 0.827 - 0.960, P < 0.001, Figure 3). At the level of 50 μg/g, FC rendered the sensitivity and specificity of 90% and 92%, respectively, for the diagnosis of CD. Positive predictive value (PPV) and negative predictive value (NPV) of FC at this cutoff value were 95.5% and 90.5%, respectively.
5. Discussion
FC has been suggested as a potential biomarker for the diagnosis and evaluation of a variety of intestinal inflammatory conditions. FC promotes important biological activities encompassing anti-microbial, antiproliferative, and immunomodulation functions (8). In the present study, we found that the mean FC level was significantly higher in children newly diagnosed with CD (239.1 ± 177.3 μg/g) than in healthy children (38.5 ± 34.6 μg/g, P < 0.001). At the cutoff value of 50 μg/g, FC showed high diagnostic validity for CD (AUC = 0.893, 95% CI: 0.827 - 0.960, P < 0.001). It has been asserted that the elevated levels of FC could appropriately distinguish between intestinal inflammatory conditions from non-pathological conditions (14). In a Canadian study, the mean level of FC in children with CD (Marsh score II/III) was 67.5 μg/g with a wide range (4.9 - 3068 μg/g) at diagnosis. This value fell within the range of 1.11 - 736.5 μg/g (mean 33 μg/g) after one year of GFD administration (4). In another report of 29 newly diagnosed CD children, it was revealed that the FC levels were significantly higher in patients than in controls (15). In a recent report, children with total villous atrophy showed higher FC levels (13.8 ± 9.3 mg/L) than those with partial atrophy (3.7 ± 1.8 mg/L) (15). Similarly, 17 children newly identified with CD had higher FC levels than healthy children (11). According to the report by Tola et al. (16), the mean value of FC was significantly higher in adults with CD than in healthy ones. Nevertheless, the elevated FC levels were observed mainly in those patients with active CD (55.6%) compared to individuals with treated CD (13.6%) (16). In two reports in adult patients with CD, the FC levels were not significantly different between newly diagnosed cases and healthy counterparts (17, 18). In general, these observations highlight the potential applicability of FC for the monitoring and diagnosis of CD.
As another finding, we detected a strong significant correlation (r = 0.611, P < 0.001) between the FC level and IgA anti-tTG titer in the patients. Anti-tTG antibodies of IgA class are the most common and validated serological markers for diagnosis of CD. In comparison, no significant association was detected between FC and Marsh score, clinical symptoms, or anti-tTG titer in adults with CD (18). The levels of FC were higher in serologically diagnosed children (89.6 μg/g) than in histologically diagnosed children (51.4 μg/g), indicating a potential correlation between the FC levels and IgA anti-tTG titer (4). The levels of FC can be influenced by the clinical picture of CD as symptomatic children may show higher FC levels than children with no signs and symptoms (19). Accordingly, the FC levels were higher in newly diagnosed children in comparison with those under GFD (19). Intestinal atrophy seems to be a dominant feature influencing the FC levels in CD patients (15). Here, we detected markedly higher FC levels in the patients that all had villous atrophy (Marsh score 3) while previous reports incorporated children with lower Marsh scores (4, 11, 15). However, FC was associated with neither the grade of intestinal inflammation nor with the clinical picture of CD in a report by Montalto et al. (17). This may be due to the impact of some other individual, physiological, or environmental factors modulating the FC levels in patients with CD. Nevertheless, the incorporation of FC with serological findings can provide high diagnostic accuracy.
A point of concern regarding the use of FC in the monitoring of pediatric inflammatory diseases is uncertainty regarding a valid and consensus cutoff value. Some have suggested a cutoff value of 50 μg/g; nevertheless, the range of FC could be very wide that limits the FC diagnostic potential (7, 20). In the current study, we found that the 50 μg/g threshold resulted in high sensitivity, specificity, PPV, and NPV (90%, 92%, 95.5%, 90.5%, respectively) for CD diagnosis. However, the elevated levels of FC may be diagnostic for intestinal inflammation, but its normal value may not necessarily exclude a pathological condition (21). Accordingly, it is suggested that the FC levels be interpreted taking into consideration other available non-invasive markers such as CRP, serological findings, and fecal lactoferrin (22, 23).
5.1. Conclusions
FC can be considered as a screening complementary tool for detecting CD with high sensitivity and specificity. One of the main benefits of measuring the FC level could be obviating the need for performing invasive screening methods. However, due to the broad range of this parameter, there is a need to develop diagnostic criteria incorporating FC with other clinical and serological diagnostic features.


