1. Background
Tuberculosis (TB) remains one of the world’s deadliest contagious diseases. In 2016, about 10.4 million people developed TB with a mortality rate of 1.3 million individuals (1). Continuous monitoring of new cases and evaluating epidemiologic trends of TB should be performed at least in periodical epidemiologic investigations (1). A number of studies indicate that TB is significantly detected more commonly in certain time points of the year, although the pattern may be specific for each population (2-7). Tabatabaee et al. suggested a specific study on social and environmental determinants of TB incidence in Fars province (8). There are only two reports addressing TB seasonal pattern in Iran; both of which emphasized the highest incidence in late spring to early summer (9, 10). To the best of authors’ knowledge, no studies are conducted in Fars province to evaluate possible seasonal pattern regarding TB incidence.
2. Methods
The current retrospective, cross sectional study was conducted on all patients documented with pulmonary TB (defined as clinical symptom plus either positive sputum acid-fast bacilli smear or positive culture for Mycobacterium tuberculosis) diagnosed in Fars province from 21 march 2006 to 30 march 2011. Patients with only extra-pulmonary TB and treated empirically were excluded. The main resource of information was the Fars TB registry database affiliated to Shiraz University of Medical Sciences. The study protocol was approved by the Ethics Committee of Shiraz University of Medical Sciences (IR.SUMS.REC.1392.4610).
In order to investigate the monthly distribution and seasonal pattern of TB incidence, based on symptom initiation date, disease frequency was determined throughout each month and season. Statistical analysis was performed using SPSS software (SPSS Inc., Chicago, IL, USA, version 18). A two-sided P value of < 0.05 was considered as the level of significant. The chi-square test and one-way analysis of variance (ANOVA) were used when appropriate.
3. Results
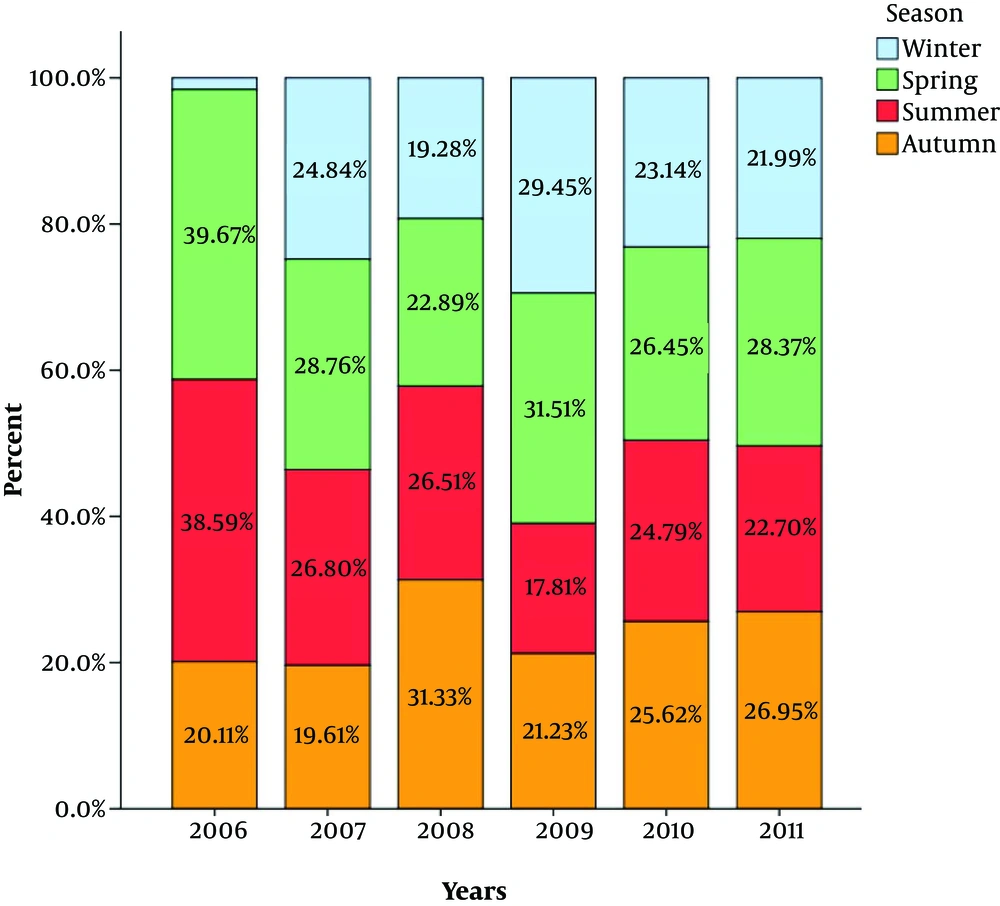
A total of 934 patients with pulmonary TB with a mean age of 44.3 ± 21 years (95% confidence interval (CI): 42.9 - 45.6) were studied of whom 319 (42.2%) were male and 615 (65.8%) female. Table 1 represents frequency of patients across months/seasons based on diagnosis dates. The highest proportion of patients were diagnosed in May and June representing 10.7% and 10.2% of all cases, respectively (P = 0.033) (Figure 1). The peak of TB incidence was during spring (> 29%) (P = 0.004).
| Season, Month | Frequency (Monthly Percent) | Frequency (Seasonal Percent) |
|---|---|---|
| Winter | 198 (21.2) | |
| January | 76 (8.1) | |
| February | 67 (7.2) | |
| March | 55 (5.9) | |
| Spring | 273 (29.2) | |
| April | 77 (8.3) | |
| May | 100 (10.7) | |
| June | 96 (10.2) | |
| Summer | 244 (26.1) | |
| July | 87 (9.3) | |
| August | 79 (8.5) | |
| September | 78 (8.3) | |
| Autumn | 219 (23.4) | |
| October | 73 (7.8) | |
| November | 76 (8.1) | |
| December | 70 (7.5) | |
| Total | 934 (100) |
Seasonal and Monthly Distribution of TB Incidents
Both seasonal and monthly variations of TB incidence were independent of patient’s age (P = 0.4 and 0.5, respectively) and gender (P = 0.3 and 0.8, respectively). The proportion of patients presenting in spring and summer decreased significantly over the study period (Figure 1).
4. Discussion
The current study findings were in accordance with previous reports by Moosazadeh et al. (9-11). Apart from domestic experiences, worldwide studies uniformly reported a dynamic change of pulmonary TB incidence over different time intervals throughout the year (2, 7, 12, 13). Not only pulmonary TB, but also extra-pulmonary TB shows such seasonal pattern of incidence (14, 15).
Various theories explain such seasonal trends in TB-involvement; one explanation entails winter crowding, which increases the probability of transmission and subsequent rising in spring and summer. However, the crowding theory is questioned by a study conducted in Netherlands in 2013. Top et al. argued that such variations might have originated from reporting bias (15).
Another reason involves a hampered immune function caused by vitamin-D deficiency in cold seasons (3, 16). According to the relatively high sun exposure even in cold seasons in Fars province, it might be doubted that vitamin D deficiency is responsible for seasonal trends for pulmonary TB.
In the current study, neither age nor gender was significantly correlated with the temporal variations. Similarities between male and female patients regarding TB trends were previously reported from Hong Kong (17). Regarding age, however, evidence suggests increased seasonal fluctuation among patients younger than 15 (2) or older than 60 years (18).
Over the study period, there was a gradual decrease in peak seasonal patterns reflecting a change towards homogenous distribution of TB over different periods of the year. This finding may be due to reporting bias or change in the temperature or rate of immigration from the neighboring countries.
One limitation of the current study was the relatively small number of subjects studied along with short duration.
In conclusion, pulmonary TB has a weak seasonal pattern in Fars province with peak incidence in warm seasons independent of patients’ age and gender. Seasonal fluctuations decreased over the recent years, though the exact underlying mechanism should be studied further.
