1. Background
Depression is a common mental disorder globally, with a high rank of disease burden (1). It is the fourth major cause of disability and has a considerable non-fatal burden of disease (2-4). The World Health Organization (WHO) has estimated that by 2020, depression will be the second most common health-related problem after cardiovascular disease (5).
Although accurate information about the prevalence of depression is not available in many countries, it appears to vary widely in its prevalence (6). Depression is the most prevalent, debilitating, and costly mental illness in the United States. Approximately 12% of youth and 16.6% of the adult population had the diagnostic criteria of depression, including major depression (7).
A national study in Iran has demonstrated that the prevalence of depression was approximately 20%. Depression was found to be the biggest health problem among mental disorders in terms of disability-adjusted life years (DALYs) by the National Burden of Disease and Injury in Iran (8). It is the third major cause of disability and has been considered to increase the years of life with disability in Iran from 2007 to 2017 (9).
Previous studies show that depression has been related to various socioeconomic factors (10), including age, sex, heredity, lifestyle, local social structure, workplace, cultural, and environmental status, which are effective in determining the health of individuals (11). According to the relationship between socioeconomic, cultural, and environmental factors with depression, the use of spatial models is necessary to find the geographical distributions and the other related factors.
The geographical distribution of this phenomenon is important, especially in the field of health research and health economics (12). Modeling the spatial distribution of disease is helpful to assess whether health care resources should be uniformly distributed or they should be primarily available in certain areas (13). In many classical statistical methods, the correlation between observations that can cause inflammation of variances is not considered in data analysis.
In fact, we face non-independent observations in most sciences in which they are correlated to each other in terms of location. This is called spatial correlation and such data are known as spatial data. For analyzing spatial data, a new branch of statistics that is called spatial statistics has been developed.
One of the statistical methods used in spatial statistics is the spatial generalized linear mixed model (14). With the assumption of independence in observations, a linear relationship is established between the mean of the observations and covariates using a link function in these models. A generalization of the models mentioned above is a generalized linear mixed model. The correlation between observations is considered a latent variable by adding random effects and independent assumption of observations change to conditional independence. Generalized linear mixed models are used when spatial-dependent data and spatial responses are both discrete distribution of the exponential family (15).
2. Objectives
This study was done with the aim of determining the spatial modeling of depression and its related factors using a generalized linear mixed model with a spatial random effect in Mashhad. This can be used to identify spatial correlation, hot spots, and related socioeconomic factors.
3. Methods
3.1. Data and Participants
The study of Mashhad stroke and heart atherosclerotic disorders (MASHAD) was conducted at Mashhad University of Medical Sciences. It was started in 2010 and will continue until 2020 (16). In the present study, complementary spatial data were added to the baseline of this cohort study. Subjects were drawn from three regions of Mashhad, which is located in North-East of Iran, using a stratified cluster random sampling design and finally, 9415 subjects were enrolled as described before. The protocol was approved by the Ethics Committee of MUMS and written informed consent was obtained from all subjects before the study (ir.mums.rec.1394.622). After identifying eligible participants, they were contacted to arrange an appointment for the formal physical examination. The demographic data were obtained in a personal interview and for depression testing, the Beck’s depression inventory II (BDI-II) was used to measure the severity of depression symptoms.
3.2. Geographic Region
Mashhad is the second most crowded city in Iran. The first step was to provide the standard GIS format based on areas under the control of each of five health centers in Mashhad. According to the subject’s address on the map, the specific code of residential block was obtained and Arc GIS was used to present the scattering of interesting factors.
3.3. Input Variables
After cleaning and preparing data, final data contains 9415 records and 5 variables, were divided into 4 input variables as predictor variables and one outcome or target variable. The depression-dependent variable in this model is to form a binary variable measured at the locations. The cut-off for depression was determined using the Beck scores as follows: 0 - 13, minimal; 14 - 19, mild; 20 - 28, moderate; and 29 - 63, severe (17). The cut-off point for depression was > 19 because of the binary response variable. Subjects having moderate and severe depression were classified as depressed and the rest were classified as non-depressed.
Independent variables are age, sex, marital status at four levels, and socioeconomic status at three levels. The socioeconomic status variable in this study was extracted using factor analysis and clustering, based on the variables of education, income, and the number of household members.
3.4. Spatial Generalized Linear Mixed Model
Let Yi (i = 1, …, n) is the response variable and xi (i = 1, …, n) is observations vector on p explanatory variables. Then the generalized linear model is g(µi) = xiT β, where β is p-dimensional vector of regression coefficients, µi is the value of E (Yi) and g(.) is the link function. Yi is independent response variable and follows an exponential family of distributions. The generalized linear model is not appropriate for analyzing spatial data or repeated measures because of not considering the correlation between observations. In such cases, generalized linear mixed model is used that is
Where β is a p × 1 dimensional vector of fixed effects for the covariates of xij and bi is a q × 1 dimensional vector of random effects for any individual or clusters associated with the covariates of zij. Yij is conditionally independent and follow an exponential family of distributions. When the response variable is discrete and there is a spatial correlation between observations, a spatial prediction is applied using the spatial generalized linear mixed model. Suppose that
Where β is a p-dimensional vector of regression coefficients and g(.) is the link function. xT(si) β and u(si) are the spatial fixed effect and the spatial random effect of the model, respectively. Logit function is the link function for binomial data, i.e. g (μ) = log [μ/(1−μ)]. Spatial correlation is important in such models and for checking that a Monte Carlo test can be utilized by variogram. Exchanging the data values across the locations is possible when we do not have a spatial correlation. So we can do the test by transposing data locations and calculating the variogram for each of them. Variogram “envelopes” compute by minimum and maximum values at each bin and eventually, we plot the variogram of the original data to examine whether it is inside the envelopes (18).
An important issue in SGLMM is predicting latent variables in locations with no observation, which requires estimation of parameters and latent variables in situations where the response variable is observed. In practice, model parameters are unknown and should be estimated. A general method for estimating parameters is the maximum likelihood approach, which is done using numerical algorithms because of the complexity and lack of closed form for the likelihood function. Researchers have introduced several numerical methods for the numerical approximation of these integrals. Christensen estimated parameters of SGLMM with the normality assumption of latent variables using maximum likelihood method and Monte Carlo algorithm (19).
3.5. Modeling
Logit link function was used for the spatial generalized linear mixed model. The model was as follows for individual probability of depression in location (si)
Where u(si) (i = 1, ..., 9415) is a Gaussian random field with mean zero and covariance function. A Gaussian covariance function was used that is
σ2 represents the variation of the spatial correlation that arises with spatial heterogeneity and denotes the range (the maximum distance when there is a spatial correlation between observations).
R and ArcGIS were used for data analysis and investigation of the research hypothesis. Spatial analysis was performed using the geoR package in R (version 3.1.2). The model parameters were estimated by a Markov chain Monte Carlo (MCMC) algorithm in the package geoRglm that is an extension of geoR package (18).
4. Results
4.1. Description of the Participants
The percentage of male and female among 9415 participants were 3802 (40.4%) and 5613 (59.6%), respectively. The total prevalence of moderate and severe depression was 20.6%.
Table 1 provides a description of demographic features of the population, comparing the two groups of depressed and non-depressed participants. The overall mean age of subjects was 48.07 ± 8.26 years and there was no significant difference in the mean age between the two groups (P = 0.39). A significantly higher prevalence of depression was observed among females (P < 0.001) and divorced people (P < 0.001). The prevalence of depression has a direct relation with socioeconomic status (P < 0.001).
| Variables | Total (N = 9415) | Depressed (N = 1940) | Non-Depressed (N = 7457) | P Valueb |
|---|---|---|---|---|
| Mean age, y | 48.07 ± 8.26 | 47.9 ± 8.4 | 48.1 ± 8.2 | 0.39 |
| Sex | < 0.001 | |||
| Male | 3802 | 565 (14.9) | 3237 (85.1) | |
| Female | 5613 | 1375 (24.5) | 4238 (75.5) | |
| Marital status | < 0.001 | |||
| Married | 8799 | 1752 (19.9) | 7047 (80.1) | |
| Single | 54 | 15 (27.8) | 39 (72.2) | |
| Widow | 444 | 132 (29.7) | 312 (70.3) | |
| Divorced | 118 | 41 (34.7) | 77 (65.3) | |
| Socioeconomic | < 0.001 | |||
| Low | 1869 | 519 (27.8) | 878 (72.2) | |
| Moderate | 5152 | 1040 (20.2) | 374 (79.8) | |
| High | 2394 | 381 (15.9) | 109 (84.1) |
aValues are expressed as mean ± SD or No. (%).
bMean differences by depression status are tested using two-tailed t-tests for age and chi-square tests are used for others.
4.2. Geographical Distribution of Depression Prevalence
Health care is provided to the Mashhad population by five health centers and according to our investigation, the highest prevalence of depression occurred in Health Center No. 5 (26.67%) (Table 2).
| Health Center | Sample Size | Depressed, No. (%) |
|---|---|---|
| Health Center 1 | 3414 | 787 (23.05) |
| Health Center 2 | 1543 | 205 (13.3) |
| Health Center 3 | 2892 | 541 (18.7) |
| Health Center 4 | 209 | 46 (20.1) |
| Health Center 5 | 1357 | 362 (26.67) |
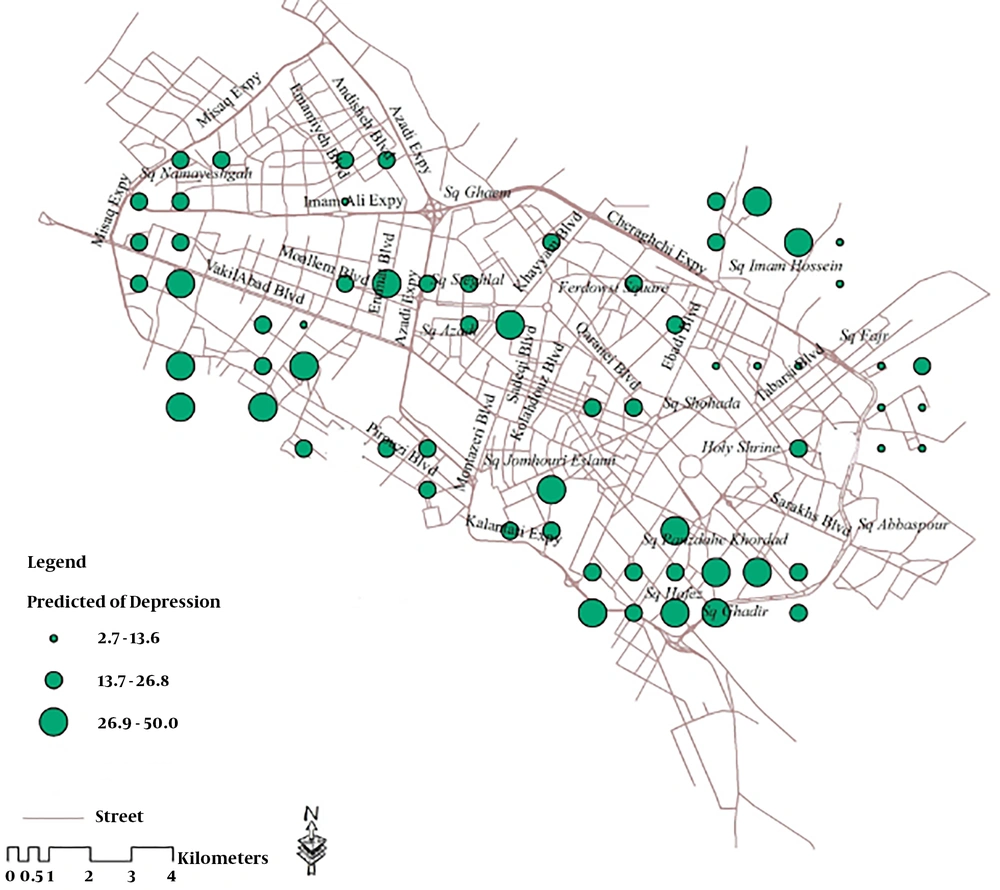
The prevalence of depression based on longitude and latitude is illustrated in a point map (Figure 1) that by considering holy shrine as the city center, this map shows depression is growing as the distance from the city center increases.
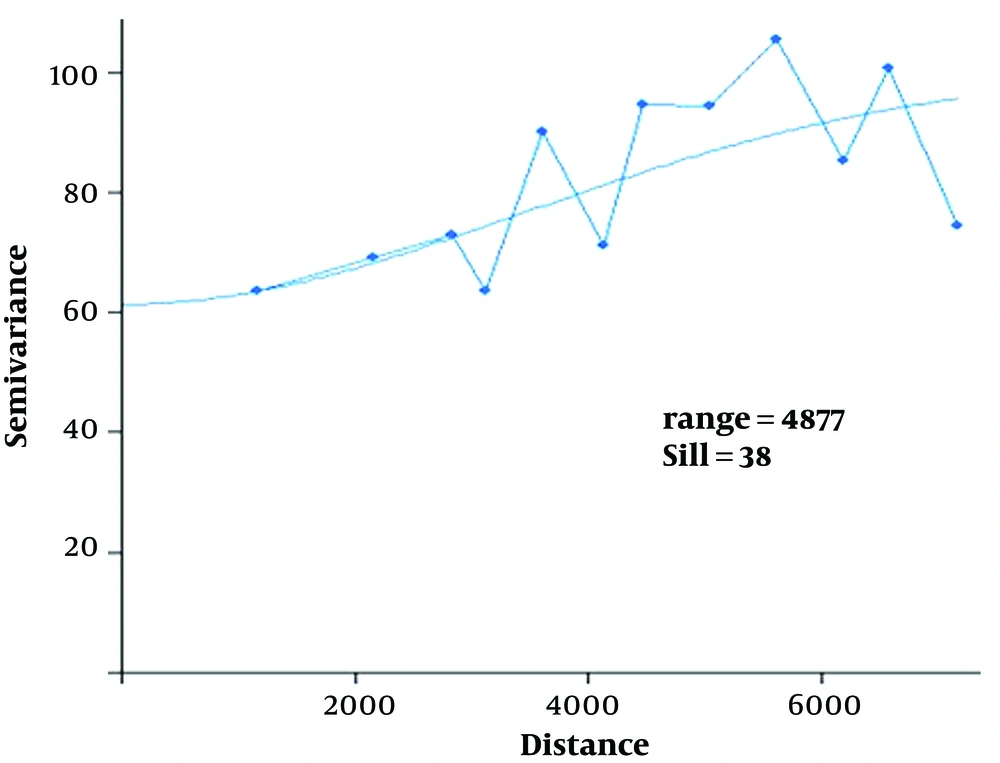
An exploratory analysis tool that is widely used in geostatistics is the variogram (20). The empirical variogram represents the relationship between that separation distances, binned into intervals. There was a significant spatial correlation at a distance less than 5000 meters (Figure 2). Also, based on Moran’s I-statistic, there was a significant spatial autocorrelation among the prevalence of depression in different areas (P < 0.001).
Results from the non-spatial and spatial logistic mixed models are given in Table 3. In general, sex, marital, and socioeconomic statuses were associated with depression after adjusting for spatial correlation. The final spatial model is as follows:
| Variables | Non-Spatial Model, Odds Ratio (CI 95%) | Spatial Logistic Mixed Model, Odds Ratio (CI 95%) |
|---|---|---|
| B0 | 0.27 (0.17, 0.4) | 0.07 (0.06, 0.08) |
| Age, y | 1.003 (0.99, 1.01) | 0.93 (0.94, 0.9) |
| Sex | ||
| Male | Reference | Reference |
| Female | 1.8 (1.6, 2.0) | 1.72 (1.5, 1.9) |
| Marital status | ||
| Married | Reference | Reference |
| Single | 1.4 (0.77, 2.6) | 1.68 (0.85, 3.3) |
| Widow | 1.5 (1.01, 2.2) | 1.22 (0.9, 1.6) |
| Divorced | 1.26 (1.07, 1.6) | 1.77 (1.13, 2.7) |
| Socioeconomic(sec) | ||
| Low | 1.9 (1.63, 2.22) | 2.58 (2.03, 3.3) |
| Moderate | 1.2 (1.07, 1.4) | 2.2 (1.89, 2.6) |
| High | Reference | Reference |
| Spatial dependence | ||
| φ | - | 1.13 (0.92, 1.4) |
| σ2 | - | 20.1 (6.1, 66.6) |
4.3. Spatial Prediction
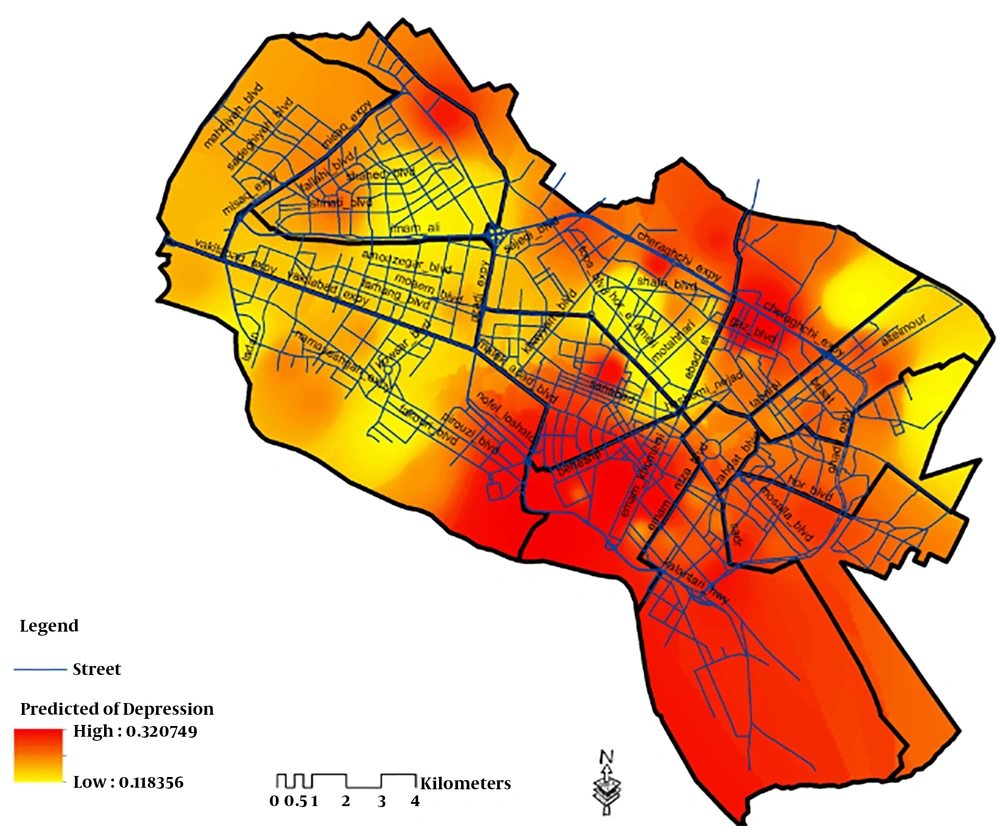
The predicted prevalence of the final spatial model is illustrated on a map (Figure 3). This map showed the areas with the lowest risk to highest risk of depression in the area of study. The accuracy of the model was evaluated with the area under the receiver operating characteristic curve (ROC AUC) and 95% confidence interval for it. The AUC = 0.67 with confidence interval, CI 95% = (0.64, 0.705).
5. Discussion
The present study shows that the overall prevalence rate of depression was 20.6% in Mashhad and it is significantly higher in females. These results supported a study carried out in Tehran that showed the overall prevalence rate of depression was 22.5%, 29.2% in females and 16% in males (21). The prevalence rate of depression is one of the most useful information for planning secondary and tertiary prevention activities in every society (22).
In this study, age was not a risk factor for depression, while marital status was associated with depression. Married people have comparatively low depression rates. These results were supported by previous studies (23-25).
Also, socioeconomic status was significantly related to the depression, which is consistent with several previous pieces of evidence, including studies by Freeman et al. (26), Domenech-Abella et al. (27), Hoebel et al. (28), and Azizoddin et al. (29).
Our findings on the relationship between socioeconomic status and depression showed that a higher socioeconomic status was associated with a lower index of depression. These results were also supported by the predicted prevalence map based on the model (Figure 3). Iran’s urban population studies have also shown that socioeconomic status is associated with depression (30, 31).
A study conducted in Korea to investigate whether gaps between socioeconomic stratum and subjective social class affect the prevalence of depressive symptoms. In this study, they fitted a generalized linear mixed model with a binary distribution. It was found the gap between socioeconomic stratum and perceived position in the social hierarchy explains a substantial part of inequalities in the prevalence of depressive symptoms (32).
Using a geographical information system (GIS) enabled us to identify spatial patterns of depression. Geographical maps based on the spatial generalized linear mixed model showed the prevalence of depression varies in different parts of Mashhad. The highest rate was observed in areas being served by Health Center No. 5, which may be explained by at least two reasons: marginalization and airport noise pollution. According to the population information of Mashhad University of Medical Sciences, the most marginalized population was observed in this area (69.6%). This population is very poor and the urban facilities are very low in those areas. Another reason is the airport noise pollution in this area. Studies have shown that people who live near airports are exposed to a greater extent of various diseases, including mental disorders (33-35). Mashhad International Airport is the second-high traffic airport in Iran and is located close to the residential areas under the supervision of Health Center No. 5, which is known as the main source of noise pollution in this area.
Few studies have previously investigated the ecological distribution of depression. In this cross-sectional study, exploratory spatial data analysis showed the rate of depression increases by distance from the city center. The rate of depression is higher in marginalized areas of the city and also it can be seen a significant spatial correlation in the prevalence of depression.
A previous study report that living near depressed people induces depression, so depression is contagious (36). The important spatial result of the present study is a significant spatial correlation that means depression is spatially contagious. Therefore, depression may spread from hot spots to other areas.
5.1. Conclusions
Our findings represent an important contribution to public health in our community. The prevalence of depression is relatively high in our community, so developing action plans is essential to prevent this disease. Owing to the spatially contagious of depression screening strategy, mapping techniques and spatial analysis are useful for identifying hot spots which require government intervention to treat the depressed population and prevent further spread of disease.


