1. Background
Life expectancy is an indicator commonly used to represent the overall development of a country. This indicator has increased steadily in most countries of the world over the past 10 years (1). Based on the World Health Organization’s global report, the average global life expectancy at birth increased by 7 years between 1998 and 2025. There are 26 countries with life expectancy at birth of more than 80 years. The life expectancy increase is associated with improved access to safe water, medical progress, and children's vaccination; it directly reflects the levels of health, nutrition, and income and indirectly the stats of employment and shelter (2).
More than 60 million children die every year worldwide. There are many differences in the mortality of under-five children between high- and low-income countries (3). The under-five mortality rate in the Eastern Mediterranean region was 57 per 1000 live births in 2012 that ranked second in the world after the African region. Iran with an under-five mortality rate of 18 per 1000 live births is ranked eleventh in the Eastern Mediterranean region (3). Reducing the mortality rate of under-five children has been recognized by the United Nations as one of the high-priority global goals. The fourth Millennium Development Goal (MDG4) could reduce under-five mortality by two-thirds between 1990 and 2015 (4, 5). Although progress has been made in reducing the under-five mortality, it is estimated that only 10 out of 67 countries with high mortality rates have achieved this goal (5). By controlling the socioeconomic and geographic factors, under-five mortality in developing countries has declined by 2.7% per year (6). In spite of population growth in developing countries, the under-five mortality rate declined overall from 12.7 million in 1990 to almost 6 million in 2015 (7).
There is an important relationship between the health system and the economy in today’s world (8). Gross domestic product (GDP) per capita is a criterion for measuring the economic performance of a community. Increasing GDP per capita is essential to achieve economic welfare (9). GDP per capita is one of the main predictors of country-level income and it has been used in health modeling outcomes, mortality trends, estimates of cause-specific mortality, finances, and health system implementation, among others (10). High life expectancy has a relationship with high income per capita in countries (11). Life expectancy and per capita income correlate across countries and at any time, especially at low levels of income (6). A study conducted in Brazil showed a positive correlation between GDP per capita and life expectancy (12). A study of life expectancy in the Middle East and Eastern Mediterranean region showed that GDP was a positive predictor of life expectancy (1). A meta-analysis study conducted to estimate the relationship between income and under-five mortality indicated that pooled estimate of the relationship between income and under-five mortality was 0.45 (0.11 - 0.79) before adjusting for covariates and 0.28 (0.19 - 0.37) after adjusting for covariates, which showed a meaningful relationship (13).
2. Objectives
Since life expectancy and under-five mortality are the important health indicators in any country and GDP is a very important indicator in relation to these indicators and due to the lack of such a comprehensive study in Iran, we conducted the current study to examine the correlation of life expectancy and under-five mortality with GDP in Iran during 1990 - 2015.
3. Methods
This was an ecological study.
3.1. Study Variables
The variables used in this study were life expectancy at birth, GDP (per capita, purchasing power parity (PPP) (current international $), and under-five mortality rate (per 1,000 live births). The data for the period of 1990 - 2015 were extracted from the World Bank database available at https://data.worldbank.org.
3.2. Analysis Methods
To describe the data, we used descriptive statistics such as mean and standard deviation. The Pearson correlation coefficient was used to examine the correlation between the variables under study after establishing the normalization condition by the Kolmogorov-Smirnov test. Furthermore, scatter plots were used for the schematic representation of the data correlation. All analyses were done using Stata 14 and Excel 2010 software. To examine the correlation between the variables, the significance level was set at α = 0.05.
4. Results
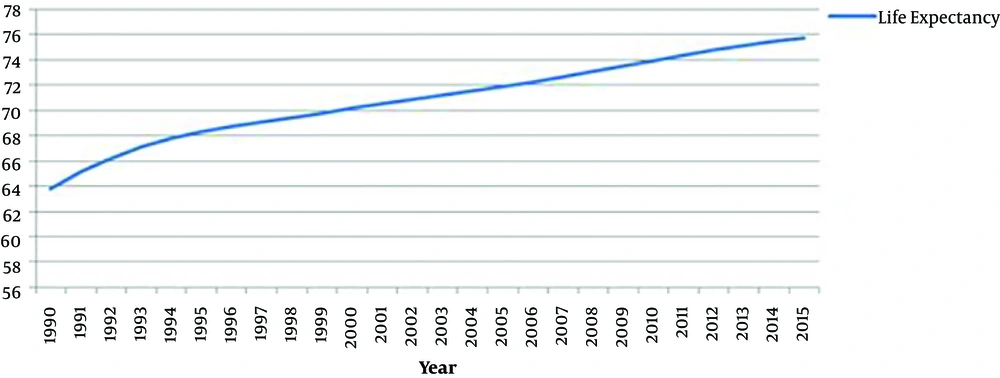
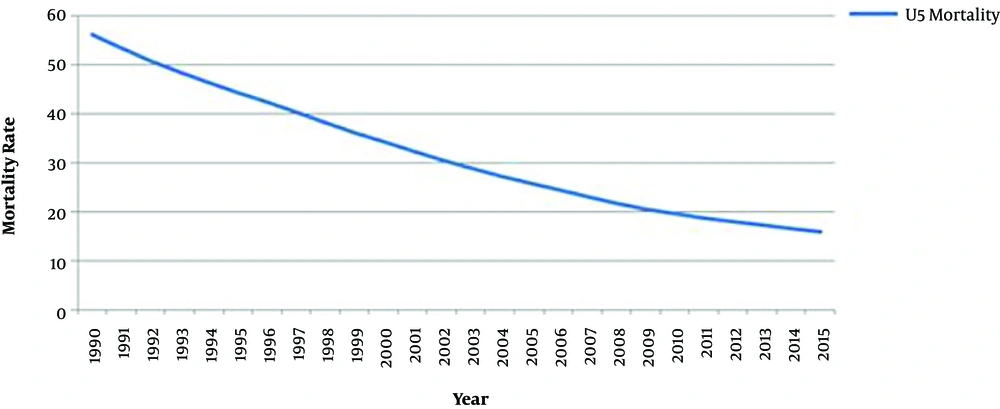
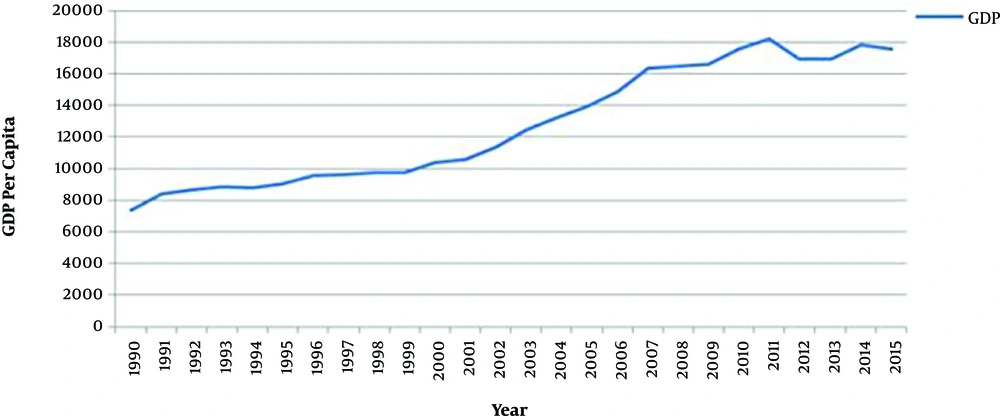
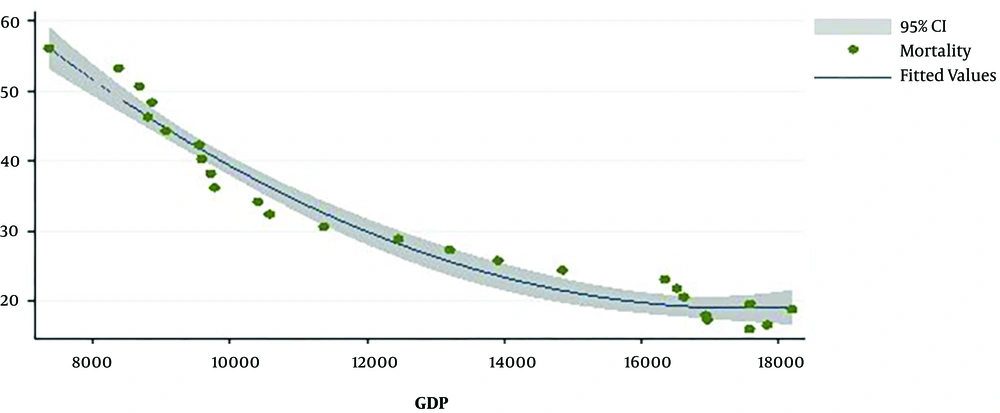
The mean life expectancy, under-five mortality, and GDP per capita in Iran were 70.86 years (at birth), 31.98 per 1000 live births, and 12,734.35 current international $, respectively, during 1990 - 2015 (Table 1). The mean life expectancy increased from 63.82 years in 1990 to 75.73 years in 2015. Moreover, under-five mortality declined from 56.1 per 1,000 live births in 1990 to 16 per 1,000 live births in 2015 (Figures 1 and 2). The GDP per capita increased from 7363.3.13 $ in 1990 to 17571.2 $ in 2015 (Figure 3).
| Variables | 1990 | 2015 | Mean ± SD (1990 to 2015) |
|---|---|---|---|
| Life expectancy (years) | 63.82 | 75.73 | 70.86 ± 3.25 |
| GDP (per capita, current international $) | 7363.3 | 17571.2 | 12734.35 ± 3710.89 |
| Under-five mortality (per 1000 live births) | 56.1 | 16 | 31.98 ± 12.52 |
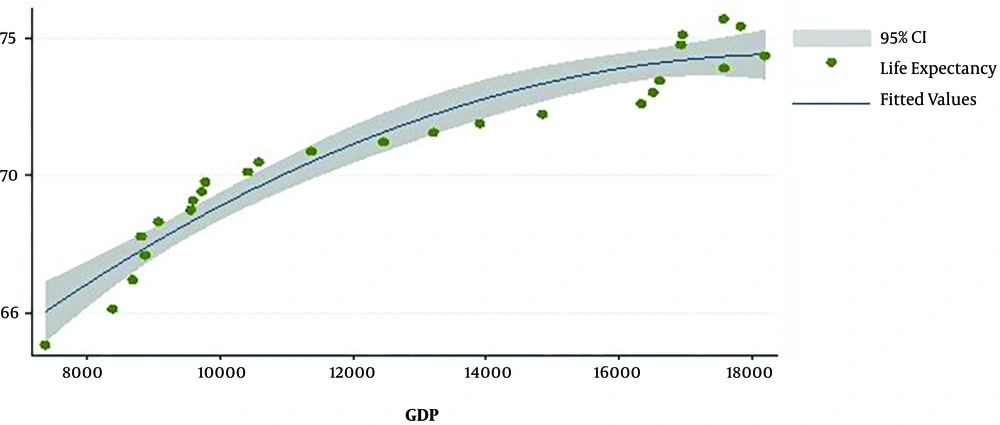
There was a significant positive correlation between GDP and life expectancy (r = 0.94, P < 0.001). It means that with increasing one of the variables, the other variable will also increase. The GDP had also a significant negative relationship with under-five mortality (r = -0.95, P < 0.001). Finally, a significant negative correlation was found between under-five mortality and life expectancy (r = -0.99, P < 0.001). The diagrams (scatterplots) of the correlation between life expectancy and GDP and between GDP and under-five mortality are shown in Figures 4 and 5, respectively.
5. Discussion
The results of this study showed that life expectancy had an increasing trend in Iran from 1990 to 2014, which was consistent with the trend of life expectancy in the United States, Western Europe, and Japan. In Eastern Europe and Russia, life expectancy had different trends and was declining in some years, possibly due to dangerous lifestyles and the high rate of smoking and alcohol consumption in eastern Europe and the collapse of the Soviet Union and sudden political, economic, and social changes in Russia (14). Moreover, under-five mortality reduced by 72% in the years of conducting the present study. This rate was higher than the mean reduction in childhood mortality in the world (52%) (15) and indicated appropriate conditions in Iran in terms of medical and health indicators. The studies carried out in Bangladesh (16) and Hong Kong (17) also showed a declining trend of under-five mortality. However, this trend was increasing in Hong Kong within 2013 - 2015 and the researcher attributed it to increased birth asphyxia, pre-term delivery, congenital cardiovascular diseases, and immobility. If these factors are not controlled, they will appear to increase the under-five mortality rate in other countries in the near future.
Similar to studies by Aghion et al. (18) and Kennelly et al. (19), there was a strong positive correlation between GDP and life expectancy in the present study. Swift (20) showed that a one percent increase in life expectancy would increase the total GDP and the GDP per capita by 6% and 5%, respectively. Furthermore, the total GDP and the GDP per capita had dramatic effects on life expectancy in many countries (20). Thus, it could be concluded that the causal relationship between GDP and life expectancy might be positive and mutual so that an increase in each factor could lead to an increase in the other one, showing improved economic and health indicators and human development indices of countries. Of course, it should be noted that if the GDP growth is followed by an increase in income inequalities, it can have negative effects on life expectancy in society (12). Therefore, policy-makers should not only focus on increasing incomes, but the fair distribution of incomes must always be considered by statesmen, as well. Another point to be noticed is the existence of a strong negative correlation between life expectancy and the under-five mortality rate. This strong correlation can be attributed to the fact that increased life expectancy in the past years was mainly due to the reduced under-five mortality rate and it is likely that life expectancy was not increased significantly in over-five age groups.
5.1. Conclusions
From 1990 to 2015, life expectancy and under-five mortality rate in Iran had increasing and decreasing trends, respectively, but the slopes have been gradually milder in recent years. Given the strong correlation between GDP and life expectancy and under-five mortality, and the declining growth of GDP in previous years and even declined GDP in some years, we suggest that the share of GDP allocated to the health sector be increased to maintain the increasing trend of life expectancy and reduce the under-five mortality rate. This is an investment that can, in turn, increase GDP in coming years.
