


1. Background
Increasing business competition in various industries in recent decades has forced organizations to improve the efficiency of their processes. For this reason, managers have realized that it is not enough to just produce a quality product, but also, there is a need to pay more attention to the supply of products according to customers’ demands and their desired quality and cost. In such circumstances, organizations found that they had to manage the units supplying their inputs, distribution centers, and after-sale services to the customer (1). With such an attitude, the supply chain theory and its management were introduced (2).
Supply chain management is a new scientific topic that has attracted the attention of many experts and scholars and created great changes to the field of the production of industrialized materials (3). In addition, sustainable supply chain management has become a strategic necessity for today’s organizations, especially those providing health services (4). Therefore, for any organization, including health organizations, it is necessary to identify the factors and variables affecting the sustainability of supply chain management to enhance their performance in these areas and increase their chances of success in creating and managing the supply chain based on sustainability principles (5).The supply chain in healthcare systems is, in fact, an integrated process in which suppliers, manufacturers, and distributors of health services work together to obtain raw materials and turn them into end products (which is the provision of health care to patients) (6). Supply chain management is a set of the methods used to effectively integrate suppliers, manufacturers, distributors, and customers so that the required products (i.e., health-oriented services) are delivered to customers (and patients) at a certain quantity and quality and at a specific time and place to minimize the costs of the entire chain (7). As a result, it can be said that supply chain management seeks to reduce the chain’s costs, including the cost of transporting goods from manufacturers to distribution centers (hospitals and other centers providing health services), and to increase the quality of the services delivered to patients, especially during emergencies and unexpected accidents. Therefore, to achieve this goal, determining the optimal number and location of emergency service distribution centers, as a critical strategic issue, is one of the main decisions that should be made in relation to a supply chain (8). During the occurrence of macro-level emergencies and urgent situations related to public health, including natural hazards such as earthquakes, floods, etc., or epidemics such as influenza, Ebola, etc., the supply chain distribution network must provide the necessary requirements for all patients in a timely manner. This network can include national strategic storage centers, local or state agencies for the receipt, storage, and staging of drugs, local drug depots, and distribution sites, or other drug distribution agencies (9). In order for this system to be effective, detailed plans must be implemented immediately. In addition, policymakers must have clear ideas about how to facilitate the flow of materials through the system and be aware of how planned capacities affect the flow of general needs (10). In other words, it should be noted that following a crisis and at the time of providing pre-hospital relief and triage services, in fact, the distribution system is the last link in the supply chain and provides the products generated by health care organizations without intermediaries. In a planned logistic system, the distribution center transfers medical and health products and equipment to its warehouses and supplies them to the consumer market. Thus, products reach retailers and consequently the final consumer with the lowest cost and in the shortest possible time (11). Therefore, an inventory always plays a major role in the success and prospects of a supply chain, especially for hospitals in critical situations, so inventory levels throughout the supply chain of pharmaceuticals and health items should be coordinated (12).
In more general terms, supply chain management seeks to reduce supply chain costs, including the cost of transporting goods from manufacturers to distribution centers (hospitals and other health service providers), to increase the quality and quantity of the services delivered to patients during emergencies and unexpected accidents during providing relief (13). The provision and allocation of the health care resources needed by victims during disasters are challenging issues and play an important role in reducing human and financial losses (8). On the other hand, triage is one of the practical concepts used at the times of crises and disasters. Triage means prioritizing the provision of care to patients to achieve the goal of "maximum service provision to the most of people". This is important due to the lack of enough resources needed to provide simultaneous services to patients and victims (14). However, it should be noted that to achieve this goal following crises, in addition to the correct triage of patients, it is necessary to determine the number and optimal location of emergency service distribution centers as a critical strategic issue in the supply chain (15). Therefore, due to the importance of the subject, this study was conducted to present a model for the distribution of emergency first aid in pre-hospital triage, accompanied by a practical example, to promote health provision during crises.
2. Methods
A two-level mathematical model was proposed using nonlinear programming to introduce a new location for the establishment and activation of triage service distribution centers for the injured. The model was designed at the two-level supply chain of manufacturer-distribution centers in the pre-hospital relief cycle. The proposed hybrid model sought to strike a balance between the concepts of efficiency, cost, and dispersion. By increasing the coverage of health services, the quantity and quality of the services provided during crises can be improved, upgrading the triage of injured patients and increasing the profits and effectiveness of medical services in the shortest possible time. This model was combined with the data envelopment analysis model to select optimal locations for providing emergency first aid services, in terms of financial and non-financial criteria, taking into consideration the dispersion of distribution centers. This model helps select suitable candidate locations for triage to boost its performance. The efficiency of each place was measured according to the criteria set for them, such as the coefficient of access to emergency services, responding to more patients in the shortest time possible, the security coefficient, the cost of establishing the new center, and the presence or absence of other types of medical facilities in the area (e.g., field hospitals, etc.).
To calculate the efficiency of the locations among existing data envelopment analysis models, the simultaneous aggregation model was chosen to be able to simultaneously determine the efficiency of all decision-making units (candidate locations for the triage of injured patients) and the total efficiency of all units. The total efficiency of all decision-making units was optimized (16). In other words, although the simultaneous consideration of both the inventory and supply chain costs has been the subject of various studies for years, the relationship between inventory and distribution costs, which is mostly nonlinear, has received less attention. Consequently, less attention has been paid to the location of distribution centers, taking into account the costs of the supply chain, especially at the time of crises, in order to provide triage and relief services to patients.
2.1. Model Introduction
This model is based on the problem of minimum scatter and maximization, which seeks to maximize the minimum polar distance for each facility and maximize the total efficiency for all decision-making units. Polar distance is the overall distance of a facility from other facilities. The examination of different models shows that most previous models locate facilities only based on the principle of dispersion, ignoring the concept of efficiency. For this reason, in the model proposed in the present study, we tried to solve this problem by combining the scattering model and simultaneous aggregation of data envelopment analysis to examine the efficiency of all candidate locations for simultaneously providing triage services to patients and the injured (5). On the other hand, due to the implementation of this model to select the location of health service distribution centers, inventory system costs were also considered in selecting the location of these centers and the amount of the goods and services allocated to them. Therefore, the purpose of this model is to select a maximum of V locations from n candidate locations to provide triage services to patients and determine the amount of the health goods or medical services allocated to patients so that the coverage of patients and injured in non-accident crises is maximum. The anticipation of these centers should be enhanced according to the principles of dispersion, efficiency, and cost minimization. It should be noted that to calculate the efficiency of potential locations in providing triage services, inputs and outputs must be considered for each decision-making unit according to the definition of the problem. Adverse factors, such as the costs of deploying a crisis team, should be managed as inputs, and desirable parameters such as profitability, access to primary emergency services, reliability in service delivery, and flexibility in patient care, which their main goal is to maximize service provision in the shortest time and at the lowest cost, should be considered as output. As a result, in contrast to most research, the cost of deployment and the benefits of providing services, as objective functions, were not considered in this study. However, these parameters were used as input and output criteria to prevent the proliferation of objective functions and properly calculate the point efficiency. It is considered as a function of data envelopment analysis. In the following, hypotheses, indices, parameters, and decision variables have been initially introduced, and then the model has been presented (16).
2.2. Assumptions
- The two-tiered inspection chain consists of a manufacturer and a few distribution centers.
- The capacity of the service provider is assumed to be unlimited.
- The shortage of primary therapeutic items is unauthorized.
- The demand for the desired product (first aid and vectors) over time is constant.
- The model is multi-period.
- The model is considered as a single commodity (essential goods).
- Facilities have not been pre-deployed.
- The manufacturer uses the production system at the time (JIT) so that when the order is issued, distribution centers start to generate and send health services and goods. As a result, the maintenance costs of the manufacturer are negligible.
- Maintenance costs are proportional to an average inventory.
2.3. Index
- K = {1, ..., n}, is the set of candidate locations for the triage of patients and injured during the crisis.
- I = {1, ..., m}, the input set of each candidate location for triage (decision units).
- J = {1, ..., s}, the output set of each candidate location for triage (decision units).
2.4. Parameters
- D: The annual demand for the product manufactured by the V center.
- Hk: The maintenance rate per unit item per unit time of the distribution center located at "k".
- Ak: The fixed cost of the goods (including office and non-office costs, telecommunications, and payroll) at the distribution center located at "k".
- Sk: The maximum rate of goods and relief services at the U.S. Service Distribution Center, located at the "k" location (based on market studies and space constraints during the crisis).
- Ck: The cost of generating and transporting each health service unit from the manufacturer to the distribution center at the location "k" per unit of distance.
- M: A very large and positive number.
- A: A very small and positive number.
- Dkz: The distance between the "k" and "z" places.
- Iik: The value of "i" is the input of the "k" location.
- Ojk: The value of jth place output k.
- V: The maximum number of the facilities that must be located in accordance with the management’s opinion.
2.5. Decision Variables
- qk: The amount of the allocated product reaching the distribution center located at "k" in each period.
- Q: The total services or health items assigned to service provider centers in each period.
- yk: The zero/one variable (i.e., the decision to activate the distribution center at the place "k" is equal to 1, and otherwise it is zero).
- ek: The amount of the inactivity of the location "k".
- Vk: The weight of the "i" input of the "k" location.
- Ukj: The weight of the "j" output of the "k" location.
- Hdk: The minimum polar distance of the "k" location from other facilities deployed for triage and relief.
In this section, first, inventory system costs are expressed based on the assumptions mentioned, and then the initial structure of the proposed model will be described. Generally speaking, a healthcare provider center, from the buyer-seller viewpoint, spends money for buying, ordering, and storing pharmaceutical or medical supplies. However, since the present study deals with the two-level supply chain of the distributor-distributor, these costs were modified. Consequently, based on the assumptions mentioned and the type of the problem, it is conceivable to imagine costs related to production, startup, and maintenance for the manufacturer. As a result, only the cost of functions, called the cost of production (including the expenses related to manpower and setting up and supplying raw therapeutic materials) and transportation of drugs and even the injured and patients, should be paid by healthcare providers. In the case of the distribution centers that both store drugs and distribute health goods and medical equipment, the costs of maintenance and ordering are calculated as follows:
a. Producer Annual Cost and Shipping Cost (ACPT)
b. Annual Cost of Distribution Centers (AOCs)
c. Annual Maintenance Costs in Health Care Distribution Centers (AIHCs)
Throughout the entire period (T), the inventory assigned to the distribution centers gradually changed to zero and was actually sold during the period "Tk" at a rate of "Sk" for each center from "qk". Therefore, in order to calculate the annual maintenance cost, we must first calculate the average of "Ik" inventory in each distribution center and then apply the maintenance rate. As a result, we have:
Finally, the cost function of the inventory system is formed as equation (4). The dispersion and efficiency functions are also expressed in terms of equations (5) and (6) using the Max-Min Sum dispersion model, as well as the aggregation model of data envelopment analysis:
Given the proposed target functions, the "Z1" objective function minimizes the annual cost of the inventory system. The "Z2" target function seeks to maximize the minimum polar distance, and the "Z3" target function maximizes total efficiency for all locations (k). The limitations of the three above-mentioned functions are as follows:
a. Limitations of the Z1 Function
The relationship (7) shows that the total goods allocated to all selected distribution centers in each period are equal to the Q relationship (8), indicating that the annual allocation of the desired product to the distribution center located at "k" should be smaller than the annual sale volume of the selected distribution center. The relationship (9) also ensures that if a place is selected, the minimum commodity will be assigned to it so that in the absence of a product for assignment, an additional place is not chosen.
Q > ɛ; qk ≥ 0
b. Z2 Function’s Limits
The relations (10) and (11) are used to define the polar distance. The relation (10) states that if no facility is located at "k", then Hdk is allowed to be a very large sum. When a facility is located at "k", Hdk is limited to less than or equal to the sum of the distances between "k" and all z locations (where there is an easy facility). In cases where a facility is not located at a potential location, there is no weighted distance in the aggregate. Equation (11) (11) ensures that the value of Hdk is always zero if the facility does not fit in "k".
c. Functional Limits of Z
The relationship (12) ensures that the rational sum of the inputs of each decision-maker is equal to zero and one. This relationship should be considered for all decision-making units. The relationship (13) shows the inefficiency rate for the balanced sum of the output of each decision maker. This relationship must also be considered for all decision-making units. The relationship (14) shows that the rational sum of the output must be less than the sum of the corresponding inputs. Relations (15) and (16) show that the weight of inputs and output is non-negative. Limit (17) also ensures that the output of each location and any output is less than or equal to 1.
d. Common Constraints
Equation (18) (18) ensures that the maximum V facilitates locating. This limitation is effective when the target functions are optimized by selecting a smaller number of distribution centers. In such a way, it is possible to prevent the launch of distribution centers beyond the number required to meet the demand and charge additional costs.
yk = 0, 1 k = 1, …, n
2.6. Problem Solving Method
Since the first objective function was introduced, is a nonlinear model of fraction type, grade two, and the number is integer, it categorized in the group of difficult issues. In the meantime, the model deficit mode is more complicated than the other models. As a result, first of all, we had to try converting the deficit function to a nonlinear, simple, and modular one. Then using one of the multi-objective functions’ solving methods, the model is transformed into a model with a target function that is an integer in the nonlinear programming problem group. Therefore, as stated above, the simplicity of the proposed model is described as follows:
By changing the variable:
then we assume:
so we will have:
In the following, by multiplying in the face and denominator, the first objective function is converted into:
Also, the limit of:
instead of:
and the relations between (20) and (21), instead of relations (8) and (9), which have been stated in the basic model, were added to the set of constraints. We also have:
2.7. Proof
Zk ≤ Myk
In other words, by minimizing, actually, we will minimize the sentence and prove it. In the final stage of simplification, the cost of ordering the first objective function is also eliminated by changing the variable from the product of a variable zero and one in the real number. As a result, we have the relation (22) as the final form of the objective function.
Relationships (22) to (24) are also added as the restrictions of the change of the new variable to the set of constraints:
Therefore, the problem found in the first objective function is resolved, and the functions of the proposed model are as follows:
As it is known, the mentioned target functions are in conflict with each other, and optimization, with respect to a target function at a specific time, leads to a deviation from the optimal response in other target functions. As a result, to optimize the three target functions, we need to use a method that simultaneously optimizes all goals. In such a situation, a comprehensive benchmark method acts to find a compromise among all purposes so that the total deviation of all targets from their optimal values (Zi *) is minimized. As a result, the ultimate goal function is expressed using the comprehensive approach method as follows:
It should be noted that in this method, we can assign different weights to target functions to consider the decision-maker’s point of view. In this formula, wi, as the weight of objective functions, is based on the decision of the decision-maker and the relationship. With this approach, if a higher-order management yields a target function, the solution obtained in the simulation mode is closer to the optimal response of the desired function. In this equation (25), at first, the optimal values of each objective function (Zi *) are calculated independently of the others, with all the constraints of the problem being calculated, and the new objective function is created according to what is shown in the relationship. As a result of this objective function, which is obtained by the comprehensive method approach, the problem is solved in such a way that the difference between each objective function and its optimal value is minimized. By reconfirming the model, including the new objective function and the principal model constraints, the relative optimal values of each of the target functions are obtained. The important point in the independent optimization of the objective functions is that at the time of z1 minimization, if the value of the variable "t" is calculated, it will retrieve a value greater than zero, and based on the planned deficit of the result from the objective function (Z1P), the answer of the optimal problem will be (Z1 *). But if the value of zero is obtained for "t", then the following function is implemented, and the answers from this model are the answer to the problem:
Max = t
st: AX ≤ B
This model has all the main constraints of the problem (a), as previously stated, and a new constraint called Z1 = Z1P has also been added to this set. Also, the upper bound obtained for the variable "t" is used in the single-objective method of the comprehensive measure, preventing the repetition of these steps as an input parameter.
3. Results
3.1. Numerical Examples and Data Analysis
In this section, to see the performance of the proposed model, the following example is discussed, and the results of its solution are presented using Lingo 8.0 software. The answer to Lingo software for the first function, which is a type of minimization, is globally optimal. The reason for this is that the first objective function is quadratic and has constraints. As a result, the effective response derived from the hybrid model presented in (25), with respect to the set of weights of w3, w2, and (w1), is also optimal because all other functions are linear. Under the above conditions, Lingo software performs the optimization of the functions in the Quadratic mode. Finally, the cost of deploying the distribution center in each location, as an input and the profitability of each distribution center, and access to the distribution center at each location, as output are defined in this section. According to Mazaheri et al. (17), the distance between the candidate locations (Table 1) and the input and output values of each location (the decision unit) have been shown in Table 2. Other numerical parameters such as the cost rates and sale capacity of each candidate location were simulated and listed in Table 3, as well as Figures 1 and 2. Also, the results of the independent optimization of the target functions have been shown in Table 4, and the relative values of objective functions with different weights have been shown in Table 5.
| Candidate Place (Triage Direction) | 1 | 2 | 3 | 4 | 5 | 6 | 7 | 8 | 9 | 10 |
|---|---|---|---|---|---|---|---|---|---|---|
| 1 | 0 | 47 | 71 | 31 | 46 | 89 | 97 | 29 | 64 | 59 |
| 2 | 47 | 0 | 43 | 71 | 27 | 47 | 60 | 23 | 72 | 55 |
| 3 | 71 | 43 | 0 | 80 | 26 | 29 | 28 | 61 | 50 | 29 |
| 4 | 31 | 71 | 80 | 0 | 58 | 104 | 107 | 58 | 51 | 57 |
| 5 | 46 | 27 | 26 | 58 | 0 | 46 | 51 | 38 | 46 | 27 |
| 6 | 89 | 47 | 29 | 104 | 46 | 0 | 17 | 70 | 79 | 58 |
| 7 | 97 | 60 | 28 | 107 | 51 | 17 | 0 | 82 | 74 | 55 |
| 8 | 29 | 23 | 61 | 58 | 38 | 70 | 82 | 0 | 76 | 63 |
| 9 | 64 | 72 | 50 | 51 | 46 | 79 | 74 | 76 | 0 | 21 |
| 10 | 59 | 55 | 29 | 57 | 27 | 58 | 55 | 63 | 21 | 0 |
| Candidate Place (Triage Direction) | 1 | 2 | 3 | 4 | 5 | 6 | 7 | 8 | 9 | 10 |
|---|---|---|---|---|---|---|---|---|---|---|
| First Entry (depot cost of hospital) | 50 | 40 | 86 | 73 | 51 | 7 | 85 | 30 | 4 | 100 |
| First output (profitability) | 69 | 46 | 61 | 18 | 53 | 73 | 95 | 36 | 87 | 52 |
| Second outcome (Access rate to primary emergency services) | 7 | 27 | 66 | 98 | 63 | 51 | 52 | 99 | 8 | 10 |
| Candidate Place (Triage direction) | Ak | Sk | Ck | hk |
|---|---|---|---|---|
| 1 | 40 | 390 | 43 | 2.29 |
| 2 | 28 | 350 | 39 | 1.96 |
| 3 | 25 | 550 | 42 | 2.74 |
| 4 | 39 | 490 | 30 | 1.54 |
| 5 | 37 | 375 | 43 | 1.75 |
| 6 | 29 | 210 | 40 | 2.01 |
| 7 | 32 | 525 | 37 | 0.99 |
| 8 | 21 | 270 | 32 | 1.5 |
| 9 | 41 | 180 | 38 | 1.81 |
| 10 | 33 | 600 | 35 | 1.95 |

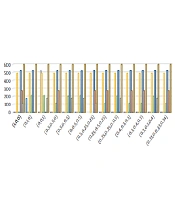
The cost and sale rates for each triage location

The relative values of objective functions with different weights
| The Objective Function | Model type and Answer | The Optimal Value of the Target Function (zi*) | Selection Points |
|---|---|---|---|
| z1 | INLP- Global Optimum | 68135.75 | 4-7-8-9-10 |
| z2 | ILP- Global Optimum | 1348 | 1-4-6-7-10 |
| z3 | ILP- Global Optimum | 7.302222 | 3-4-6-9-10 |
| (w1, w2, w3) | Distribution Center 1 | Distribution Center 2 | Distribution Center 3 | Distribution Center 4 | Distribution Center 5 | Distribution Center 6 | Distribution Center 7 | Distribution Center 8 | Distribution Center 9 | Distribution Center 10 |
|---|---|---|---|---|---|---|---|---|---|---|
| (1, 0, 0) | 0 | 0 | 0 | 490 | 0 | 0 | 525 | 270 | 115 | 600 |
| (0, 1, 0) | 175 | 0 | 0 | 490 | 0 | 210 | 525 | 0 | 0 | 600 |
| (0, 0, 1) | 0 | 0 | 520 | 490 | 0 | 210 | 0 | 0 | 180 | 600 |
| (0.5, 0.5, 0) | 0 | 0 | 0 | 490 | 0 | 115 | 525 | 270 | 0 | 600 |
| (0.5, 0, 0.5) | 0 | 0 | 0 | 490 | 0 | 205 | 525 | 0 | 180 | 600 |
| (0, 0.5, 0.5) | 0 | 0 | 0 | 490 | 0 | 210 | 520 | 0 | 180 | 600 |
| (0.5, 0.25, 0.25) | 490 | 525 | 270 | 115 | 600 | |||||
| (0.25, 0.5, 0.25) | 0 | 0 | 0 | 490 | 0 | 115 | 525 | 270 | 0 | 600 |
| (0.25, 0.25, 0.5) | 0 | 0 | 0 | 490 | 0 | 205 | 525 | 0 | 180 | 600 |
| (0.4, 0.3, 0.3) | 0 | 0 | 0 | 490 | 0 | 115 | 525 | 270 | 0 | 600 |
| (0.3, 0.4, 0.3) | 0 | 0 | 0 | 490 | 0 | 115 | 525 | 270 | 0 | 600 |
| (0.3, 0.3, 0.4) | . | . | . | 490 | 0 | 205 | 525 | 0 | 180 | 600 |
| (0.33, 0.33, 0.34) | 0 | 0 | 0 | 490 | 0 | 115 | 525 | 270 | 0 | 600 |
The subject is clearly shown in Figure 1.
According to the results presented in the Table 4, the proposed hybrid model seeks to strike a balance between the concepts of efficiency, cost, and dispersion. To evaluate the model’s performance, a variety of weights were assigned to the target functions so that a set of centers, based on different managerial comments, was observed. It is known that by increasing the weight of one of the objective functions by the decision maker, the hybrid model tries to return the resulting solutions to the independent optimal answer of the function. In general, the selection of points is based on the following seven conditions: (1) the efficiency of selected centers to maximize patients’ triage; (2) the minimal cost of the inventory system for initial services; (3) distribution of selected centers for maximum triage; (4) management commentary (a set of target functions); (5) fulfilling patients’ and injured people’s demands; (6) not exceeding the capacity of the service provider in triage centers; (7) preventing the establishment of an additional distribution center (e.g., field hospitals) to avoid the imposition of additional costs.
It can be said that the calculated value is actually a percentage of the total patient demand, which is covered by the center, and all demands are provided:
According to relation (27), it is seen that, as long as the demand is fully met, the selection of distribution centers and the allocation of goods based on sale capacities continue. Therefore, after selecting each location, to activate the distribution center by optimizing the target functions, the annual allocation of goods to that center is estimated based on its maximum possible capacity, as a percentage of the time required during the crisis. Then the annual appropriation of goods will be made to the next center to be selected. As a result, the total amount of the appropriations allocated to distribution centers is equal to the annual demand and all demand provided:
As a result, the model selected five other sites (4, 6, 7, 8, and 10) and activated a primary surplus service center to optimize all crisis management objectives. It is also important to note that among all of the weights examined, some of the candidate points for patient triage (such as 2 and 5) have not been selected by the combination model due to the lack of optimal conditions (inappropriate cost parameters and sale capacity, etc.).
4. Discussion
Today’s organizations are working to improve their organizational competitiveness in order to be able to compete in the global markets of the 21st century, which has a dynamic nature (18). Thus, the intense competition in today’s markets has forced business organizations to invest and focus more on supply chains, but it should be noted that achieving an efficient supply chain is not possible without proper planning and the integration of supply chain processes (19). As a result, in this study, with regard to the inventory system and location of facilities, a practical model was designed to determine the efficiency of distribution centers in managing the supply chain and allocating goods to health centers, especially hospitals, during crises to ensure the provision of appropriate pre-hospital triage services. This model focuses on maximizing the number of health-oriented service delivery centers and increasing their efficiency, as well as optimizing inventory costs to better meet patient demands and perform the triage of victims. In a study conducted by Shafiei Nikabadi et al. (3), in order to control the level of inventories in the supply chain, a two-level nonlinear mathematical model, including a manufacturer and a wholesaler, was presented to minimize the costs of various chain levels. The results of the recent study were in line with the findings of the model presented in this research. Shafiei Nikabadi et al. (3) also suggested that the amount of the inventory of each member of the supply chain could play a decisive role in reducing the cost of the product, leading to a greater market share.
In a research by Golmakani and Eskandar (20), provide a nonlinear programming model is proposed for locating emergency bases with the goal of minimizing the mean and standard deviation of emergency service time for a given region while satisfying the relevant constraints which is in line with the purpose of the present study. It was also stated in this research that by reducing these two indicators, not only the service time of the missions will reduce, but also the time of emergency services will be the same for different people as much as possible. In another study conducted by Nasiri et al. (21), an integrated mathematical model for planning and locating urban emergency centers, including locating bases, assigning ambulances to them, as well as routing ambulances, was presented to reduce patients’ waiting time. In addition, due to the unpredictability of demands, uncertainty was considered for this parameter, and for this purpose, a robust optimization model was formulated for planning, confirming the optimal location in the present study.
4.1. Conclusions
This study is the first to present a model to resolve model by the method of variable change method and integrate objective functions. Our results showed that in this model, unlike most similar studies, the cost of establishment and profit from providing services were not recognized as objective functions, but to prevent the increase of objective functions and properly calculate the efficiency of different locations, the titles of input and output criteria were considered as a function of data envelopment analysis, which was an innovative idea in this research. We also showed that the location of triage can influence the success of health units and reduce their shipping costs. Quotation, providing fair services to patients, and other purposes are to be used in this regard. On the other hand, in our model, only the cost function was considered as the costs of the production (including the costs of manpower, commissioning, and the supply of pharmaceutical raw materials) and transportation of drugs, as well as the transportation of injured patients to health care centers. Also, for the distribution centers that carry out the activity of storing drugs and distributing health goods or medical equipment, the maintenance and ordering costs should also be considered.
