


1. Background
Traditional medicine heavily relies on herbal extracts and active ingredients (1). Phenolic compounds have valuable properties such as anti-allergic, anti-inflammatory, antimicrobial, and antioxidant, which resulted in their extensive use in pharmaceutical, nutritional, cosmetic, and agricultural fields (2). One of the beneficial effects of phenolic compounds roots in their antioxidant properties (3). Phenolic compounds contain antioxidant properties due to their free hydroxyl group on their aromatic ring. Also, their antioxidant activity depends on the number of hydroxyl groups (4). Antioxidants can inhibit and control the oxidation process, by eliminating free radicals. Besides, antioxidants act as reductant, chelating, or aggregating singlet oxygen agents. Antioxidants are classified into two major groups of synthetic and natural. In general, synthetic antioxidants are phenolic compounds that contain varying amounts of alkyl substituents, whereas natural antioxidants can be phenolic compounds such as quinone and lactone (5). Phenolic compounds are divided into simple phenols, phenolic acids, coumarins, flavonoids, stilbenes, condensed tannins (procyanidins), lignans, and lignins (6).
Factors such as solvent type, sample to solvent ratio, extraction time, sound intensity, and temperature contribute to the extraction of phenolic compounds. The extraction process can be performed either through traditional techniques (e.g. Soxhlet and maceration) or new technologies (e.g. microwave or ultrasound) (7). Ultrasound extraction is one of the most important methods for extracting valuable compounds from plant sources that can be implemented at all scales. Two common systems for using ultrasound are probe and bath systems. Ultrasonic baths not only greatly reduce the size of the particles, but also increase their solubility (8). The ultrasonic bath is an efficient method for extraction from dried and powdered samples at industrial and large scales (9). In the ultrasonic probe system, the plant sample is in direct and continuous contact with the probe (ultrasonic waves), so it has a greater impact on plant tissues, but it has low repeatability, and its application is limited to low volume samples. Besides, sample contamination and foam production are more common than the ultrasonic bath. Ultrasound bath can be applied for a wide spectrum of samples simultaneously, and its repeatability is high. It is therefore preferred over the ultrasonic probe system (10).
Caper is a perennial plant that bears rounded, fleshy leaves with large white to pinkish-white flowers (11). Caper has about 250 species, most of which are wild and can grow in arid and semi-arid environments with adaptability to drought conditions (12, 13). Phytochemical studies reported that this plant contains several bioactive factors, including saccharides, glycosides, flavonoids, alkaloids, indoles, and phenolic acids, terpenoids, volatile oils, fatty acids, vitamin C, vitamins E, and steroids (14, 15). The root of the Caper contains pectin, saponin, a very small amount of essential oil, resinous substance, aminoglycoside, and capparirutine (16, 17). Also, its root skin contains stachydrin and a volatile substance with garlic aroma (18). Caper has anti-diabetic and blood lipid-lowering properties (19-21). Caper has been widely used in traditional medicine due to its diuretic, antihypertensive, and vasodilator effects (22).
Besides, it’s reported that, based on biological and chemical tests, aqueous and alcoholic extracts from the roots of this plant have antioxidant activity (23). Najafi et al. (24) investigated the chemical constituents of Caper fruit essential oil in the Sistan Region and optimized the extraction conditions of antioxidant compounds of fruit extract using the microwave method. The results of the analysis of essential oil extracted by water distillation using gas chromatography and gas chromatography-mass spectrometry (GC/MS) revealed 33 compounds in the essential oil that constituted the main ingredients of the essential oil of the fruit, including thymol (24.1%) and isothiocyanate (29.2%) (24). A study showed that ethanolic extract of the Caper fruit has the highest antimicrobial activity in Staphylococcus aureus. Analyzing the aqueous and ethanolic extracts revealed that leaves and fruit of the Caper contain the highest level of antioxidant properties (23).
2. Objectives
Due to the increasing tendency towards using natural compounds of medicinal plants in the treatment of diseases, the current study was designed to investigate the optimum conditions for aqueous and alcoholic extraction of phenolic and antioxidant compounds obtained from Caper root.
3. Methods
3.1. Chemicals
All solutions and chemicals were analytical grades. The reagents of Folin-Ciocalteu, Gallic Acid, Sodium Carbonate (Na2CO3), and Ethanol from Merck Company (Germany), Dual Distilled Water from Zolal Medical Company (Iran), and 2,2-diphenyl-1-picrylhydrazyl (DPPH) from Sigma Aldrich Company (USA), were purchased.
3.2. Identification and Preparation of the Plant
Caper plant was collected from Anbarabad farms in Kerman Province in March 2018 and was identified in the Herbarium and Systematic Laboratory of Islamic Azad University of Jiroft. The roots of the plant were dried at room temperature and using shadow. It was then powdered by a laboratory mill and passed through a 40-mesh sieve.
3.3. Ultrasound Extraction
Initially, 50 g of powdered root sample was mixed with 200 mL of ethanol solvent 70% (for alcoholic extract) and 50 g of powdered sample with 200 mL distilled water (for aqueous extract). Solvent and sample containers were placed in an ultrasonic bath (JK-DUC-8200LHC, China) with a temperature control system and a circulation system at a constant frequency of 35 KHz. Ultrasound treatment levels consisted of three-extraction time levels (10, 25, and 40 min) and three levels of sound intensity (40%, 70%, and 100%) (16). After the ultrasound treatments, the extracts were centrifuged at 7800 rpm for 30 minutes, and then the supernatant was separated and filtered (MF-Millipore Membrane Filter, 0.45 µm pore size). Vacuum rotary evaporator at 40°C and 200 rpm performed to the separation of alcoholic solvent. To remove the residual alcoholic solvent and the aqueous solvent, the extracts were spread in a plate and placed in a vacuum oven at 40°C. All extracts were stored in a freezer at -18°C until the tests (25).
3.4. Chemical Tests
3.4.1. Estimation of Total Phenolic Contents (TPC)
The total phenolic contents of each extract were determined by the Folin-Ciocalteu micro-method (26). Briefly, 100 µl of extract solution was mixed with 1 mL distilled water and 500 µL of Folin-Ciocalteu reagent, followed by the addition of 1.5 mL of Na2CO3 solution (20%) after 1 min. Subsequently, the mixture was stored in a dark place at room temperature for 120 min and its absorbance was measured at 760 nm. Gallic acid was used as a standard for the calibration curve. The phenolic content was expressed as gallic acid equivalents using the following linear equations based on the calibration curves. Equations 1 and 2 are used as the basis of gallic acid with the aqueous and ethanol solvents, respectively.
Where X is the absorbance and Y is the concentration as gallic acid equivalents (mg/g).
3.4.2. Determination of Anti-Radical Activity
The anti-radical activity was determined by the DPPH test using 2,2-diphenyl-1-picrylhydrazyl reagents (27). Afterward, 5 mL of DPPH solution (0.004%) was added to 50 µL of different concentrations of the extract prepared with ethanol and aqueous solvents. After mixing at room temperature, mixtures were stored in a dark place for 30 min. The absorbance of sample and control were read at 517 nm with a spectrophotometer (UV/Visible Spectrophotometer AQUARIUS, CE7500, UK). The antiradical activity was calculated using Equation 3:
3.5. Statistical Analysis
Response surface methodology (RSM) and Design Expert software (version 11) were used to investigate the effect of studied variables (extraction time and sound intensity) on the amount of phenolic compounds and the radical scavenging power of aqueous and alcoholic extracts. Based on the response surface design, the Box-Behnken model was selected to investigate the two variables at three levels, and 13 runs were performed to evaluate the extraction process and determining the optimal conditions (Table 1). As data were not distributed normally, the Mann-Whitney U test was used to compare aqueous and alcoholic extracts of the plant root. Data were analyzed using SPSS version 16. Statistical significance was considered when P-value < 0.05.
| Treatment | Extraction Time (X1), min | Sound Intensity (X2), % | TPC of Root Alcoholic Extracts, mg/g | IC50 of Root Alcoholic Extracts, µg/mg | TPC of Root Aqueous Extracts, mg/g | IC50 of Root Aqueous Extracts, µg/mg |
|---|---|---|---|---|---|---|
| 1 | 14 | 49 | 6.58 | 78.12 | 4.52 | 88.88 |
| 2 | 25 | 40 | 6.25 | 79.28 | 4.36 | 90.09 |
| 3 | 36 | 49 | 7.10 | 75.00 | 5.12 | 83.75 |
| 4 | 10 | 70 | 8.24 | 70.36 | 6.44 | 80.00 |
| 5 | 25 | 70 | 10.46 | 63.23 | 10.42 | 72.62 |
| 6 | 25 | 70 | 10.52 | 61.83 | 9.38 | 69.25 |
| 7 | 25 | 70 | 10.40 | 64.32 | 9.33 | 70.32 |
| 8 | 25 | 70 | 10.44 | 63.93 | 9.28 | 71.02 |
| 9 | 25 | 70 | 9.02 | 65.20 | 9.36 | 69.93 |
| 10 | 40 | 70 | 12.34 | 56.26 | 11.22 | 62.11 |
| 11 | 14 | 91 | 15.22 | 46.87 | 12.16 | 60.02 |
| 12 | 25 | 100 | 18.35 | 37.50 | 15.41 | 51.44 |
| 13 | 36 | 91 | 17.12 | 40.19 | 14.52 | 53.71 |
Treatments Designed in Response Surface Test and Response Values for Antioxidant Tests of Aqueous and Alcoholic Extracts of Plant Root
4. Results
4.1. Selecting the Best Model
The most appropriate model was selected using adjusted R-squared, if it was greater than 0.80, and non-significant lack of fit test. The quadratic model by Response Surface method (RSM) was used for statistical analysis of tests. After selecting the best model, to determine the overall equation according to the ANOVA analysis, parameters with a non-significant F test (P > 5%) were removed from the model. Then, the general equation was obtained using the given coefficients for each parameter. The model defined for each response is shown in Equation 4. In this equation, Y is the predicted response, b0 constant-coefficient, bi linear effects, bii squares effect, and bij interaction effects, as well as xj and xi, are encoded independent variables.
4.2. Effect of Extraction Time and Sound Intensity on Total Phenolic Compounds of Aqueous and Alcoholic Root Extraction
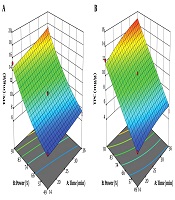
The simultaneous effect of extraction time and sound intensity on total phenolic compounds of the root is shown in Figure 1. The amount of total phenolic compounds extracted from Caper root with ethanolic and aqueous solvents were 10.93 mg/g and 9.35 mg/g, respectively. The mean total phenolic compounds of alcoholic and aqueous root extracts of Caper did not show any significant difference (P > 0.05). The high R2 coefficient between the actual and predicted values in this study indicates a very good correlation between the results obtained from the experimental method and the predicted values of the total phenolic compounds by statistical methods (Tables 2 and 3).
 and aqueous (B) extracts of plant root")
Three-dimensional diagram, the simultaneous effect of two extraction time and sound intensity variables on the amount of total phenolic compounds of ethanolic (A) and aqueous (B) extracts of plant root
| Source | Sum of Squares | df | Mean Square | F-Value | P-Value |
|---|---|---|---|---|---|
| Model | 177.58 | 5 | 35.52 | 71.66 | < 0.0001 |
| X1 | 8.44 | 1 | 8.44 | 17.03 | 0.0044 |
| X2 | 159.95 | 1 | 159.95 | 322.75 | < 0.0001 |
| X1 X2 | 0.4761 | 1 | 0.4761 | 0.9606 | 0.3597 |
| X12 | 0.0896 | 1 | 0.0896 | 0.1808 | 0.6834 |
| X22 | 8.70 | 1 | 8.70 | 17.56 | 0.0041 |
| Residual | 3.47 | 7 | 0.4956 | ||
| Lack of fit | 1.81 | 3 | 0.6048 | 1.46 | 0.3512 |
| Pure error | 1.65 | 4 | 0.4137 | ||
| R2 | 0.9808 | ||||
| Adj. R2 | 0.9672 | ||||
| Pred. R2 | 0.9145 |
ANOVA of the Quadratic Model of Total Phenolic Compounds of Alcoholic Extracts of Plant Root
| Source | Sum of Squares | df | Mean Square | F-Value | P-Value |
|---|---|---|---|---|---|
| Model | 147.44 | 5 | 29.49 | 65.49 | < 0.0001 |
| X1 | 11.81 | 1 | 11.81 | 26.23 | 0.0014 |
| X2 | 133.39 | 1 | 133.39 | 296.27 | < 0.0001 |
| X1 X2 | 0.7744 | 1 | 0.7744 | 1.72 | 0.2311 |
| X12 | 1.29 | 1 | 1.29 | 2.88 | 0.1338 |
| X22 | 0.0643 | 1 | 0.0643 | 0.1428 | 0.7167 |
| Residual | 3.15 | 7 | 0.4502 | ||
| Lack of fit | 2.21 | 3 | 0.7362 | 3.12 | 0.1501 |
| Pure error | 0.9431 | 4 | 0.2358 | ||
| R2 | 0.9791 | ||||
| Adj. R2 | 0.9641 | ||||
| Pred. R2 | 0.8895 |
ANOVA of the Quadratic Model of total Phenolic Compounds of Aqueous Extracts of Plant Root
According to the parameters which were significant in the alcoholic and aqueous extraction process of total phenolic compounds from the root of the Caper plant, based on variance analysis (Tables 2 and 3), the general equations can be reported as follows:
Equations 5 and 6 present the general formulas for the extraction of total phenolic compounds from the plant root with ethanol and aqueous solvents, respectively.
Where: Y, total phenolic compounds (mg/g); X1, extraction time (min); and X2, sound intensity (%). According to Equations 5 and 6, the sound intensity (X2) was obtained as the most effective factor for the extraction of total phenolic compounds from the roots of Caper. At optimum conditions (36 min and 91% sound intensity), total phenolic compounds extracted from Caper by alcoholic and aqueous solvents were 17.24 mg/g and 14.96 mg/g, respectively, indicating that the alcoholic solvent resulted in higher extraction of total phenolic compounds than aqueous solvent (Table 4).
| Optimal Points | Power, % | Time, min | TPC, mg/g | IC50, µg/mg | Desirability |
|---|---|---|---|---|---|
| 1 | 91 | 36 | 17.24 | 40.20 | 0.922 |
| 2 | 91 | 35 | 17.12 | 40.62 | 0.912 |
| 3 | 91 | 27 | 16.08 | 44.11 | 0.827 |
| 4 | 91 | 26 | 15.88 | 44.78 | 0.811 |
| 5 | 91 | 23 | 15.55 | 45.89 | 0.784 |
Results of the Optimization Process for Antioxidant Tests of Alcoholic Extracts of Plant Root
4.3. The Effect of Extraction Time and Sound Intensity on IC50 of Aqueous and Alcoholic Extracts of Root
The effect of extraction time and sound intensity on IC50 of aqueous and alcoholic extracts of roots is shown in Figure 2. As a measure of a substance potency to inhibit a particular function, the IC50 indicates a concentration that can inhibit up to 50% of free radicals. Therefore, the extract that contains the highest antioxidant activity has the least IC50. The mean IC50s of alcoholic and aqueous extracts were 61.70 µg/mg and 71.11 µg/mg, respectively, which showed a higher antioxidant activity for alcoholic solvent than aqueous solvent. The predicted IC50 values for alcoholic and aqueous extracts, by the model, showed statistically significant correlations with the experimental results (Tables 5 and 6). The results revealed an inverse association between extraction time and sound intensity and IC50. According to the parameters which were significant in the variance analysis of alcoholic and aqueous extraction process of antioxidant compounds from plant root (Tables 5 and 6), the general equations can be reported as follows:
Equations 7 and 8 are the general formulas for the determination of IC50 of ethanolic and aqueous extracts, respectively:
 and aqueous (B) extracts of plant root")
Three-dimensional diagram, the simultaneous effect of two extraction time and sound intensity variables on the amount of IC50 of ethanolic (A) and aqueous (B) extracts of plant root
| Source | Sum of Squares | df | Mean Square | F-Value | P-Value |
|---|---|---|---|---|---|
| Model | 2128.21 | 5 | 425.64 | 111.87 | < 0.0001 |
| X1 | 110.56 | 1 | 110.56 | 29.06 | 0.0010 |
| X2 | 1957.69 | 1 | 1957.69 | 514.51 | < 0.0001 |
| X1 X2 | 3.17 | 1 | 3.17 | 0.8327 | 0.3918 |
| X12 | 1.10 | 1 | 1.10 | 0.2885 | 0.6078 |
| X22 | 56.79 | 1 | 56.79 | 14.93 | 0.0062 |
| Residual | 26.63 | 7 | 3.80 | ||
| Lack of fit | 20.23 | 3 | 6.74 | 4.21 | 0.0993 |
| Pure error | 6.41 | 4 | 1.60 | ||
| R2 | 0.9876 | ||||
| Adj. R2 | 0.9788 | ||||
| Pred. R2 | 0.9286 |
ANOVA of Quadratic Model of IC50 of Alcoholic Extracts of Plant Root
| Source | Sum of Squares | df | Mean Square | F-Value | P-Value |
|---|---|---|---|---|---|
| Model | 1782.32 | 5 | 356.46 | 73.85 | < 0.0001 |
| X1 | 168.73 | 1 | 168.73 | 34.96 | 0.0006 |
| X2 | 1611.97 | 1 | 1611.97 | 333.95 | < 0.0001 |
| X1 X2 | 0.3481 | 1 | 0.3481 | 0.0721 | 0.7960 |
| X12 | 1.02 | 1 | 1.02 | 0.2120 | 0.6592 |
| X22 | 0.3957 | 1 | 0.3957 | 0.0820 | 0.7829 |
| Residual | 33.79 | 7 | 4.83 | ||
| Lack of fit | 27.19 | 3 | 9.06 | 5.49 | 0.0667 |
| Pure error | 6.60 | 4 | 1.65 | ||
| R2 | 0.9814 | ||||
| Adj. R2 | 0.9681 | ||||
| Pred. R2 | 0.8879 |
ANOVA of Quadratic Model of IC50 of Aqueous Extracts of Plant Root
Where, Y is IC50 (µg/mg), X1: extraction time (min), and X2: sound intensity (%). According to Equations 7 and 8 sound intensity (X2) was the most effective factor for extraction of antioxidant compounds from the roots of Caper. At optimum conditions (36 min extraction time and 91% sound intensity), IC50 extracts of ethanolic and aqueous extracts were 40.20 and 52.17 µg/mg, respectively.
5. Discussion
This study demonstrated a direct association between extraction time and sound intensity with the amount of total phenolic compounds extracted from the root of Caper. Gu et al. (28), have used the ultrasonic technique to extract catechins and caffeine from tea, indicated a direct association between these compounds and the extraction time. The extraction time factor increases the mass transfer rate. Also, sound intensity, due to its high energy content of waves, can cause shear forces to break and disintegrate cell walls and increase the release of plant contents to extraction medium and improve mass transfer (29). Dehghan Tanha et al. (16) have optimized the extraction of phenolic compounds of red pepper using RSM. They used methanol solvent and reported that the highest amount of phenolic compounds of red pepper was 49.6 mg/kg at 49°C, 39 min extraction time, and 89.8% sound intensity. They showed extraction time and sound intensity increase extraction yield and sound intensity was the most influential parameter in extraction, which is consistent with the findings of the present study (16). Mahboubi et al. (23) have used the maceration method and reported that total phenolic compounds extracted from Caper root with ethanol solvent and distilled water were 22.4 and 15.4 mg/g, respectively.
This difference in the amount of total phenolic extracted compounds can be due to differences in environmental conditions of plant growth and experimental conditions (30). Arrar et al. (31) reported that total phenolic compounds extracted from Caper root with methanol solvent and distilled water, by maceration method, were 9.2 mg/g and 15.5 mg/g, respectively. Compared to the optimum value reported in the present study, although the total phenolic compounds of aqueous extract were higher, but, in the present study, the amount of total phenolic compounds in methanol solvent was lower than that of ethanol solvent. This difference in the rate of alcohol extraction of phenolic compounds may be due to the effect of different solvents in the extraction process and the efficiency of ultrasonic extraction of phenolic compounds over the traditional maceration method. In optimum conditions, the efficacy of ethanolic extracts in removing DPPH radicals was higher than aqueous extracts, which was directly related to the amount of total phenolic compounds in this extract. So that the higher the phenolic compounds, the higher the antioxidant activity and the less IC50. Rezzan et al. (30) investigated phenolic compounds, antioxidant activity, and mineral analysis of Capparis spinosa using ultrasonic bath extraction. They reported that the mean plant compounds had an inhibitory concentration of 0.32 mg/mL, which showed less antioxidant activity than that of the present study (30). Mahboubi et al. (23) reported an IC50 value for ethanolic and aqueous extracts as 88 µg/mL and higher than 2000 µg/mL, respectively, which compared to the optimal level of the present study, IC50 of extracts were higher, but consistent with the present study, the IC50 of the alcoholic extracts was lower than the aqueous extracts.
This difference in IC50 content can be attributed to the effective effect of ultrasound in extracting antioxidant compounds from the root of the plant compared to the traditional maceration method (23). In another study, Arrar et al. (31) reported that the IC50 contents of methanolic and aqueous extracts of Caper root by maceration method were about 1.8 mg/g and 1.6 mg/g, respectively, that compared with the results of the present study, the IC50 of alcoholic and aqueous extracts was higher. This difference in IC50 may be due to the efficiency of ultrasound in the extraction of antioxidant compounds over the traditional maceration method (31).
5.1. Conclusions
Ultrasound extraction is one of the fastest and most efficient currently available methods. This study demonstrated a direct association between extraction time and sound intensity with the extraction of phenolic and antioxidant compounds from the roots of the Caper plant using the alcoholic and aqueous solvents. Besides, according to the findings, the sound intensity was the most effective factor in extraction. The optimum conditions for extraction of total phenolic and antioxidant compounds were 36 minutes and the sound intensity of 91%. Generally, alcoholic extracts had more phenolic and antioxidant compounds than aqueous extracts.
