1. Background
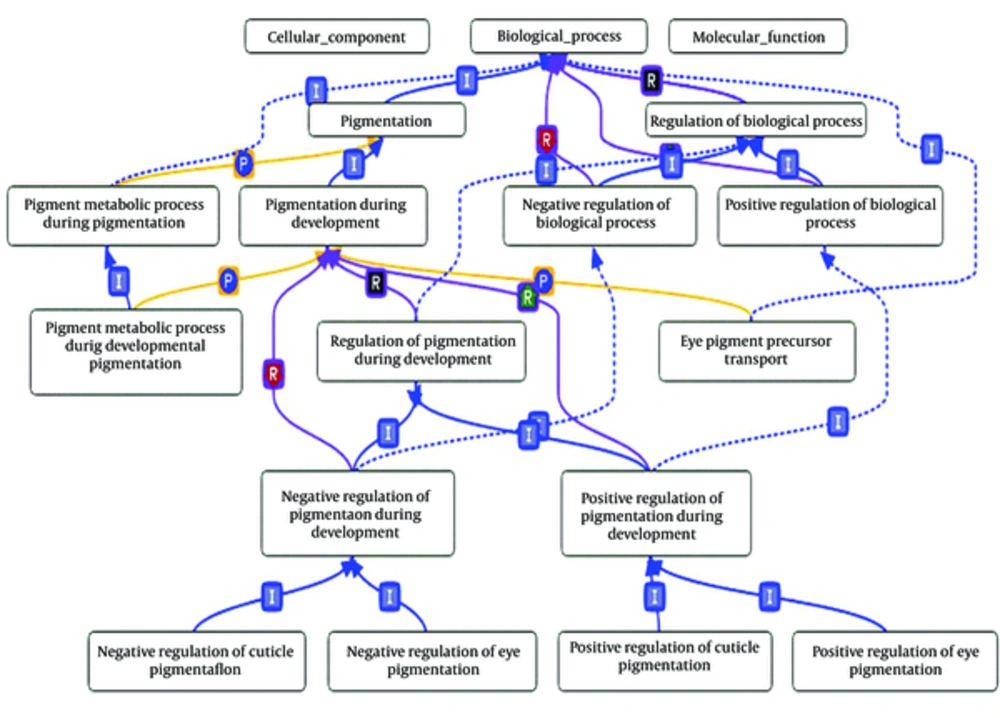
During the last decade, the rapid development of scientific discovery tools made it possible to employ ontology concept to standardize and organize our increasing knowledge in sciences. We can model our knowledge about concepts and their semantic relationships in ontologies. Such facility led to the development of ontologies in biology domain. Two main ontologies in this domain are gene ontology (GO), for annotating gene products and sequence ontology, for annotating sequences. GO is a structured and controlled vocabulary of biological terms to describe roles of genes and their products. GO, in turn, consists of three orthogonal ontologies that capturing human knowledge about cellular component (CC), biological process (BP) and molecular function (MF). These ontologies are organized in three directed acyclic graphs (DAGs) in which, the nodes correspond to biological terms that describe gene products and edges that represent the relation between terms [1]. Two main common relationships are ‘is-a’ and ‘part-of’. Each term in GO ontology annotate several gene products. These annotating relations can be direct or indirect, since an annotation to a term also implies to all of its ancestors. Figure 1 shows a partial view of GO graph.
To exploit GO ontology advantages, semantic similarity measures compare biological terms with respect to their annotations. A semantic similarity measure is defined as a function that given two biological terms (or two sets of terms) estimates their functional similarity according to the taxonomical structure of concepts in the ontology [2]. The state-of-the-art semantic measures of GO ontology terms can be classified into three groups: node-based, edge-based and a hybrid of edge- and node based [3, 4].
Edge-based measures determine similarity of two terms according to properties of graph paths between two terms. The most common property is distance. It selects either the shortest path or the average of all paths. Another common path property directly calculates the similarity by the length of the shared path from the lowest common ancestor of two terms to the root [2, 3]. Edge-based measures have two main drawbacks [5]; they are based on the assumption that all edges indicate uniform distances and that all nodes in the GO DAG have similar densities with an identical distribution. They ignore the levels of edges in the ontology by considering all edges equal. These measures also have the “shallow annotation” drawback [6-8]: two terms with a certain distance near the root have equal semantic similarity with two terms with the same distance but far from the root. Other edge-based measures [2, 9] have attempted to overcome this limitation by assigning different weights to the edges at different graph levels using network density, but they still ignored one fact: GO terms at the same level do not always share same specificity because two terms in the same level can have different gene properties.
Node-based measures use term properties to compare two terms. The term properties can be related to the terms themselves, their ancestors, or their descendants. The most popular node-based measures are Resnik [10], Lin [11] and Jiang and Conrath [12] measures. Originally, they were developed for WordNet [13]. They use information content (IC) concept to represent semantic values. IC is a measure that denotes how specific and informative a term is. It is computed for a term by Equation 1.

Where p (t) is the probability of occurrence of term t in a specific corpus (such as the UniProt Knowledgebase), that is usually estimated by its annotation frequency. IC is a function of children of a term in the GO graph. IC concept can be applied to the common ancestors of two terms to evaluate their shared information. Two main approaches are: the most informative common ancestor (MICA), and the disjoint common ancestors (DCA). MICA is a common ancestor with the highest IC, while, DCAs are common ancestors that do not include any other common ancestor [14]. In comparison with edge-based measures, measures based on IC are less sensitive to issues related to variable semantic distance and variable node density [8], because, IC measures a term specificity independent of its depth in the ontology (i.e., IC of a term is dependent on its children instead of its parents). Also, IC- based measures are biased by current research trends, interested terms are expected to be more frequently annotated than other terms.
Resnik [10] uses the most informative common ancestor (MICA) of compared GO terms. It ignores positions of these terms in the GO graph, e.g., since the distance of each term from the root of the graph. Also, it ignores the contribution of other ancestors. However, the specialization level of a term in human perception is shown by the term’s distance to the ontology root, farther distance from the root in the ontology graph, means more knowledge is available about the term, which causes the term to be more specific. On the other hand, shorter distance to the root means the term is more general, so there are not that much of details about it. Therefore, two terms with same GO-based distance at a lower level (i.e., more specific terms) are be semantically more similar than two terms at a higher level (i.e., more general terms).
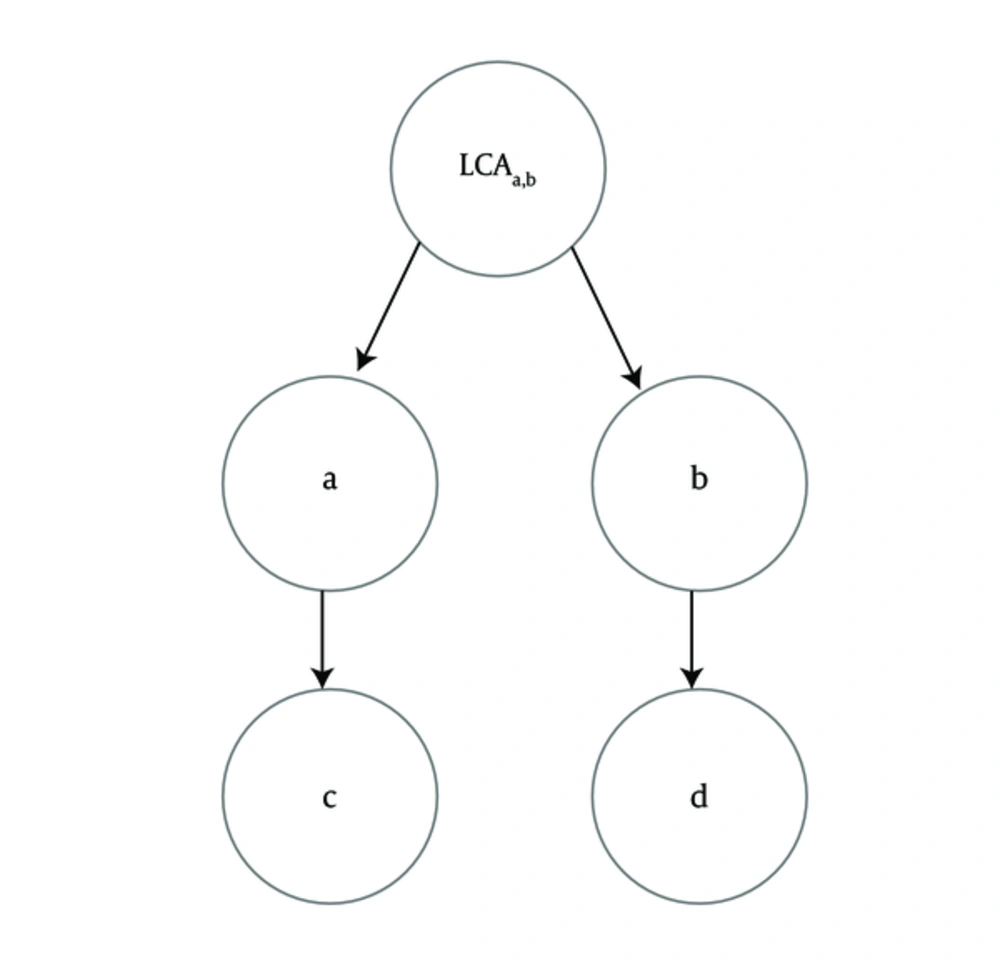
Node-based measures like Resnik suffer from “shallow annotation” problem [6-8] if they ignore the term levels in an ontology graph. With respect to IC definition, MICA [10] is the least common ancestor (LCA) of two given terms. Therefore, measures based on MICA, do not consider the distances of two terms to their LCA and the semantic contribution of other ancestor terms. For example, according to the Figure 2, sim (c,d), the semantic similarity between terms c and d equals to sim (a,b), the semantic similarity between terms a and b, since these two pairs have a same least common ancestor.
By considering the graph distance of two terms in the ontology, Lin [11] and Jiang and Conrath [12] measures overcome one limitation of Resnik’s. Consider the example in Figure 2, we expect a higher value for sim (a,b) than sim (c,d) because the graph distance between a and b is less than the graph distance between c and d, However, these measures have two limitations; 1) incorporating MICA alone does not consider any mechanism for terms with multiple parents. 2) The specialization levels of LCA for two terms are not used. Therefore, their semantic similarity values may still be incompatible with human perception.
Hybrid measures employ the properties of both edges and nodes. They are usually defined as weighted aggregation of node and edge properties [8, 15-17]. For example, Wang et al. [8] developed a hybrid measure in which each edge is given a weight according to the type of relationship. However, there exists a problem: edge weights are based on experimental study of gene classification of particular species and change from a species to another species.
Using term-term semantic similarity values, it is possible to compare gene products. Each gene product can be annotated with several GO terms. Thus, to estimate the functional similarity of two gene products, their corresponding annotated terms are compared. There are two main approaches: pair-wise and group-wise [2, 5]. Pair-wise measures compute gene product similarity in two steps. In the first step, the semantic similarities between term pairs are computed. In the second step, for two gene products, their corresponding annotated term sets are obtained and then a set-based semantic similarity rule is applied to the annotated term sets. Three popular rules are 1) maximum rule (MAX), 2) average rule (AVG), and 3) best match average rule (BMA). The AVG and MAX rules consider the average and the maximum of semantic similarity scores of all term pairs (from two annotated term sets) respectively. The BMA rules detect all best matches between the term pairs and return the average of semantic similarity values of these best matches. Group-wise measures calculate the semantic similarity between gene products directly by employing one of the three structures: 1) set, 2) graph, or 3) vector on two annotated term sets.
Recently, AIC [5], a node-based semantic similarity measure based on the aggregation of information contents has been introduced. This measure is based on two main observations: (1) In general, the similarity of more specific GO terms (terms at a lower level) of GO graph should be more than the similarity of more general terms (terms near the root); (2) the semantic meaning of one GO term should be the aggregation of all semantic values of its ancestor terms. The first observation is consistent with the human perception of term semantic similarity at different levels of graph ontology. The second observation is consistence with how human beings use terms to annotate genes.
Here, we present wAIC, a two-stage hybrid semantic similarity measure based on weighted aggregation of information contents. In the first stage, wAIC uses an inverted version of information content. The semantic value of common ancestor of two terms is scaled by a weighted coefficient according to the location of the ancestor on its shortest path to a leaf in the graph ontology. This weighted aggregation is used as first factor of the semantic similarity that is obtained by a node- and edge-based approach. Subsequently, the second factor is computed by a novel graph-wise measure. The final term-wise semantic similarity is the production of these two factors. Therefore, wAIC, is a hybrid node, edge and graph-wise approach. Also, note that within the second stage, wAIC uses a novel hybrid of pair-wise and group-wise approaches (based on filtering terms that are in high levels of the ontology graph) to estimate semantic similarities for gene products. Experimental results confirm that using weighted aggregation of common ancestors and filter-based approach in the first and second stages of proposed measure are completely consistent with the human perception (the similarity of more specific GO terms should be more than of the more general terms) such that it addresses the shallow annotation problem in a better way. So it achieves significantly better results than state-of-the-art measures. Source codes for the proposed method are available in supplementary file.
2. Methods
WAIC is a two-stage measure that employs a hybrid model in each stage. After computing term-wise similarities in the first stage of wAIC, it computes gene-wise similarities using one of the three rules of MAX, AVG or BMA.
2.1. Term-Wise Semantic Similarity
Semantic similarity of two terms x and y in the graph ontology is computed by Equation 2.

Where, Ct and Cg are two term-based semantic similarity functions. Ct (x, y) is a function of common ancestor of two terms x and y and is computed by Equation 3.

Where, Ax and Ay are the set of all ancestors of term x and term y respectively, IIC(a) is an inverted version of information content that is shown by (Equation 4), SV (x) and SV (y) are the semantic values of terms x, y respectively, and are computed by Equation 5 that are weighted aggregation of their ancestors. The coefficient Wt is computed by Equation 6.


Recall that Equation 5 is a weighted aggregation of Wt for IIC(t) where Wt is an edge-based and IIC (t) is a node-based computation. Therefore, SV (z) and consequently Ct (x, y) are computed on both edge and node measurements.
Cg (x, y), the second term-based semantic similarity function is a graph-based function that is computed by Equation 7. Where, Dx and Dy are the set of all descendants of terms x and y. Therefore, SS (x,y), is a hybrid node-, edge- and graph-wise approach.

2.2. Gene-Wise Semantic Similarity
In the second stage, wAIC, employs a novel hybrid of pair-wise and group-wise approaches to estimate the semantic similarities. The semantic similarity of two gene products a and b is computed by Equation 8.

Where, Aa and Ab are two sets of annotating terms for gene products a and b. Simt, the semantic similarity between two input term sets with respect to t is computed by Equation 9. g (a,b), on the other hand, is a group-wise measure which is denoted in Equation 10.


Where, given a threshold, f () filters the terms that are in high levels of the ontology graph, in order to prevent the effect of high semantic similarity of term pairs near the root of ontology (shallow annotation).
3. Results
3.1. Datasets and Benchmarks
In order to compute semantic similarities, we need two data sets: 1) GO ontology graph that consists of three individual orthogonal ontologies of cellular component (CC), biological process (BP) and molecular function (MF), and 2) GO annotation file that describes and annotates terms from several resources (each resource is indicated by an evidence code). We use both GO ontology (version; 2013-06-25) and GO annotations (version; 01/30/2016) that are filtered for the yeast slim from the GO website.
It is shown that raising value of the sequence similarity of two gene entails rising values for their corresponding GO semantic similarity [18]. Therefore, we evaluate GO semantic similarity measures based on their correlation with sequence similarity. We use a set of 20167 yeast gene pairs that their corresponding sequence similarities are computed by relative reciprocal BLAST score (RRBS) [19, 20]. For each gene pair, we compute the correlation between their semantic similarity vector and their sequence similarity vector.
3.2. Comparison Analysis Based on Correlation with Sequence Similarity
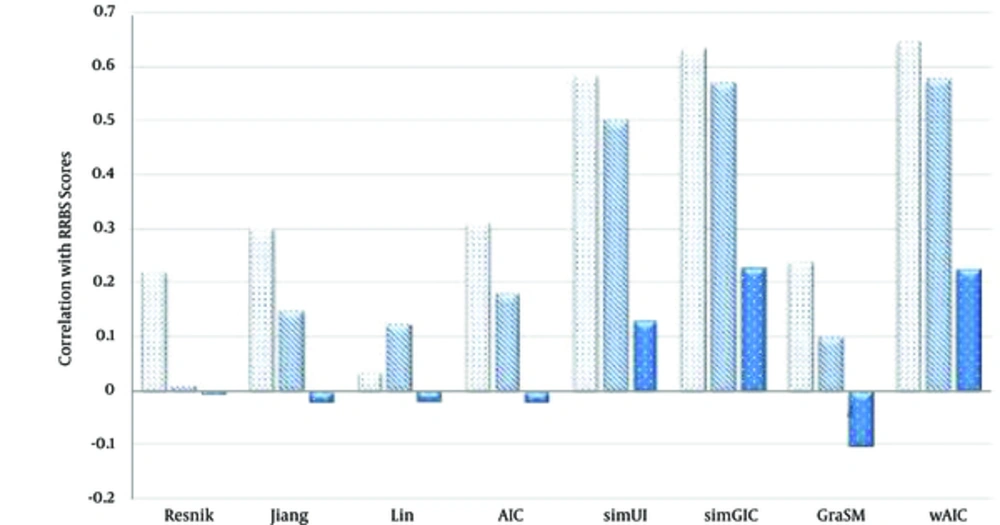
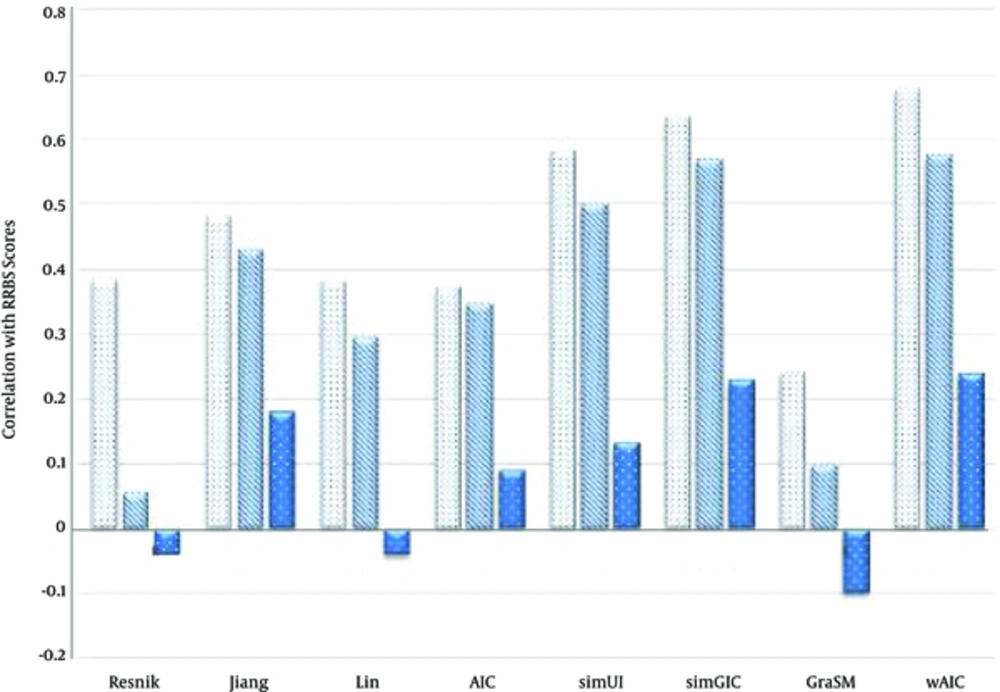
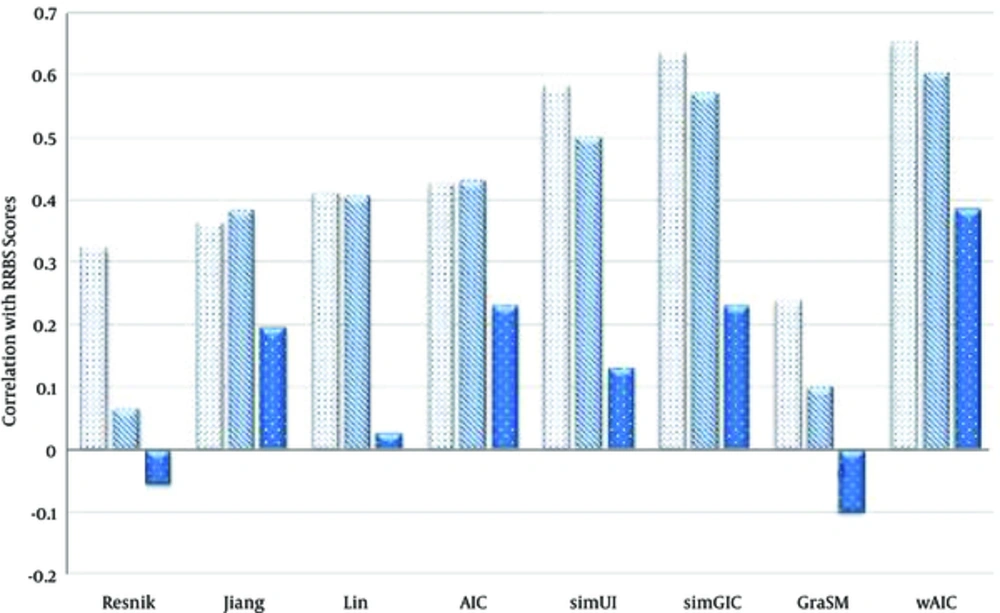
We compared wAIC with some resent and most representative measures Resnik [10], Lin [11], Jiang and Conrath’s [12], AIC [5], simUI [21], simGIC [22] and GraSM [23]. Tables 1 - 3 show the best result of the correlation of these similarity measures with RRBS scores in case of three rules MAX, BMA and AVG respectively. Note that since simUI [21], simGIC [22] and GraSM [23] are group-wise measures, their single output values are considered for all three rules. We observed, for all measures and all three rules, BP ontology has the highest correlation value, and then followed by CC and MF ontologies. Results have showed for all three ontologies and in all three rules. The proposed wAIC measure outperforms other measures in terms of correlation with RRBS sequence similarity scores. Only, in the case of MF ontology, with MAX rule in action, simGIC [22] scored the best correlation value of 0.229, which is merely 1.3% higher than the second best value of 0.226, achieved by wAIC. Figures 3 - 5 show these facts in the comparative diagrams.
The Comparison of Semantic Similarity Measures Based on Table 1
The Comparison of Semantic Similarity Measures Based on Table 2
The Comparison of Semantic Similarity Measures Based on Table 3
| Variables | BP | CC | MF |
|---|---|---|---|
| Resnik | 0.221 | 0.012 | -0.007 |
| Jiang | 0.3 | 0.15 | -0.02 |
| Lin | 0.035 | 0.124 | -0.019 |
| AIC | 0.31 | 0.18 | -0.02 |
| simUI | 0.582 | 0.5 | 0.131 |
| simGIC | 0.634 | 0.569 | 0.229 |
| GraSM | 0.24 | 0.1 | -0.1 |
| wAIC | 0.647 | 0.576 | 0.226 |
| Variables | BP | CC | MF |
|---|---|---|---|
| Resnik | 0.385 | 0.056 | -0.039 |
| Jiang | 0.481 | 0.429 | 0.178 |
| Lin | 0.383 | 0.294 | -0.04 |
| AIC | 0.372 | 0.346 | 0.089 |
| simUI | 0.582 | 0.5 | 0.131 |
| simGIC | 0.634 | 0.569 | 0.229 |
| GraSM | 0.24 | 0.1 | -0.1 |
| wAIC | 0.676 | 0.575 | 0.239 |
| Variables | BP | CC | MF |
|---|---|---|---|
| Resnik | 0.324 | 0.066 | -0.056 |
| Jiang | 0.365 | 0.384 | 0.196 |
| Lin | 0.411 | 0.407 | 0.026 |
| AIC | 0.425 | 0.43 | 0.231 |
| simUI | 0.582 | 0.5 | 0.131 |
| simGIC | 0.634 | 0.569 | 0.229 |
| GraSM | 0.24 | 0.1 | -0.1 |
| wAIC | 0.651 | 0.602 | 0.384 |
4. Discussion
Illustrated results indicate that weighted aggregation of two term common ancestors with respect to the position of the ancestor in the graph ontology and using a hybrid of node-, edge-, graph-based, pair-wise and group-wise approaches can pay off in a more precise semantic similarity measure. In this section, for a more thorough discussion, we exploit gene expression data to assess wAIC capabilities in comparison with other measures based on correlations of semantic similarities.
Sequence similarity is already a good criterion for comparing semantic similarity measures but it is not enough. It is always possible that two genes with high sequence similarity have very distinct functions in a cell. Therefore, we need to compare measures based on functional aspects in a cell. Gene expression data is one of such measures. Also, it is known that the genes involved in the same biological category, show similar expression pattern [7, 24-26]. In our analysis, we use a benchmark including 4800 gene pairs that are scored on the correlation of their gene expression profile according to a yeast gene expression data [27, 28].
We compared semantic similary measures Resnik [10], Lin [11], Jiang and Conrath [12], AIC [5], simUI [21], simGIC [22] and GraSM [23] based on the their correlation with gene expression patterns in casess of three rules “MAX, AVG and BMA”. The Pearson’s correlation between gene expression and semantic measures for three CC, BP and MF ontologies are shown in Tables 4 - 6 in case of three rules MAX, BMA and AVG respectively.
| Variables | BP | CC | MF |
|---|---|---|---|
| Resnik | 0.276 | 0.459 | 0.286 |
| Jiang | 0.112 | 0.181 | 0.143 |
| Lin | 0.081 | 0.175 | 0.153 |
| AIC | 0.121 | 0.206 | 0.155 |
| simUI | 0.311 | 0.395 | 0.236 |
| simGIC | 0.309 | 0.42 | 0.248 |
| GraSM | 0.141 | 0.271 | 0.093 |
| wAIC | 0.323 | 0.463 | 0.269 |
| Variables | BP | CC | MF |
|---|---|---|---|
| Resnik | 0.287 | 0.457 | 0.265 |
| Jiang | 0.179 | 0.321 | 0.173 |
| Lin | 0.199 | 0.379 | 0.169 |
| AIC | 0.161 | 0.336 | 0.168 |
| simUI | 0.311 | 0.395 | 0.236 |
| simGIC | 0.309 | 0.42 | 0.248 |
| GraSM | 0.141 | 0.271 | 0.093 |
| wAIC | 0.354 | 0.43 | 0.3 |
| Variables | BP | CC | MF |
|---|---|---|---|
| Resnik | 0.228 | 0.398 | 0.226 |
| Jiang | 0.056 | -0.118 | 0.115 |
| Lin | 0.17 | 0.203 | 0.147 |
| AIC | 0.095 | 0.068 | 0.145 |
| simUI | 0.311 | 0.395 | 0.236 |
| simGIC | 0.309 | 0.42 | 0.248 |
| GraSM | 0.141 | 0.271 | 0.093 |
| wAIC | 0.325 | 0.404 | 0.25 |
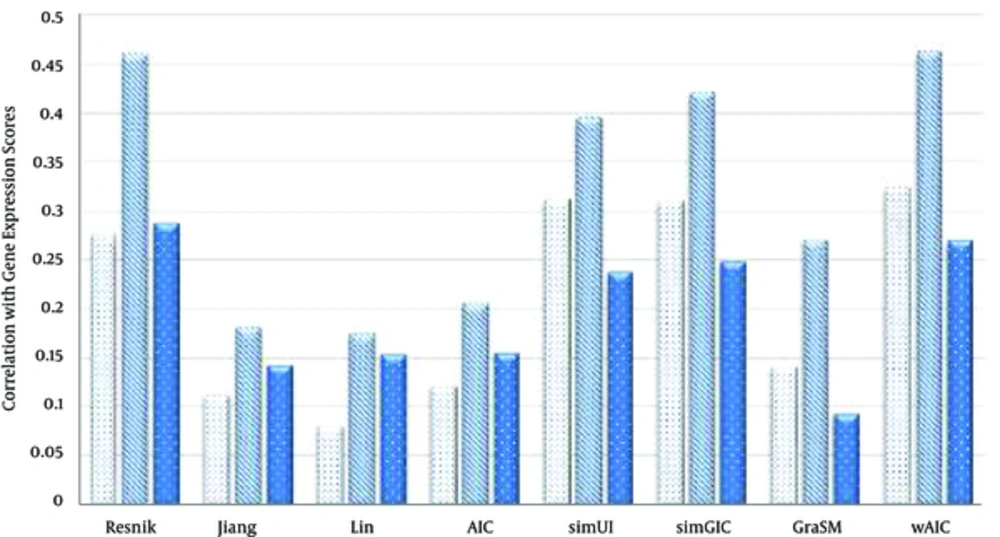
In case of MAX rule (Table 4), the proposed wAIC measure outperforms other measures in terms of correlation with gene expressions similarity scores for both BP and CC ontologies. For instance, wAIC hits the highest values of 0.323 and 0.463 for BP and CC ontologies which are 3.8% and 0.87% higher than the second best values 0.311 and 0.459, achieved by simUI [21] and Resnik [10] respectively. In case of MF ontology, Resnik [10] sets the best value of 0.286, which is 6.3% higher than the second best value, 0.269, achieved by wAIC.
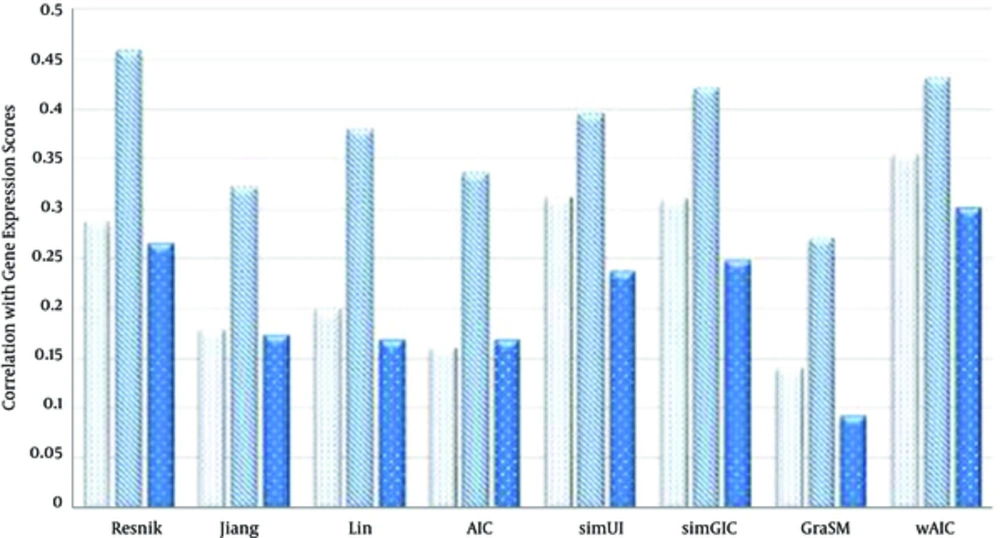
In case of BMA rule (Table 5), wAIC measure outperforms other measures in terms of correlation with gene expressions similarity scores for both BP and MF ontologies. For instance, wAIC scores the highest values, 0.354 and 0.3 for BP and MF ontologies which are 13.8% and 13.2% higher than the second best values 0.311 and 0.265, achieved by simUI [21] and Resnik [10] respectively. In case of CC ontology, Resnik [10] records best value of 0.457, which is 6.2% higher than the second best value, 0.43, settled by wAIC.
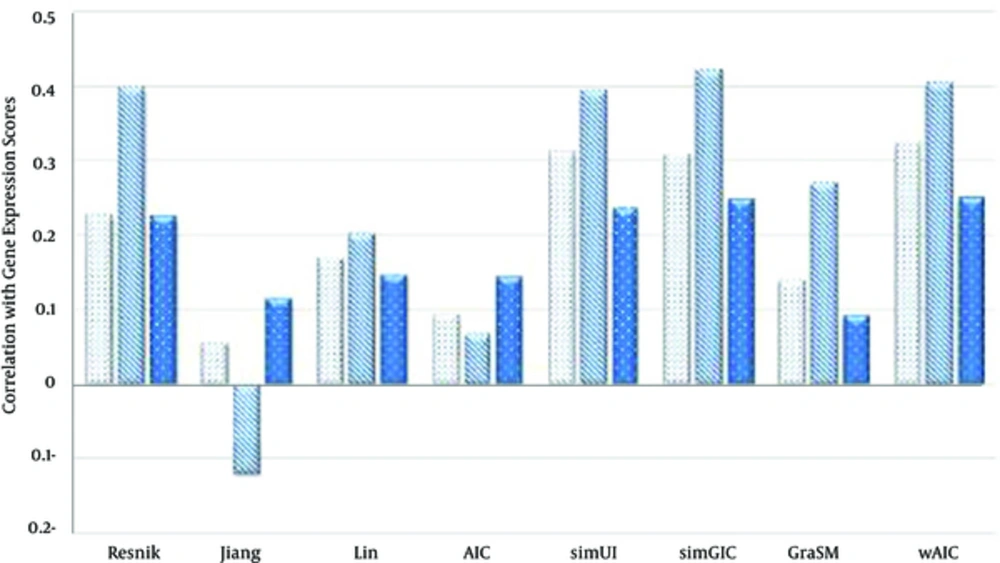
In case of AVG rule (Table 6), wAIC measure outperforms other measures in terms of correlation with gene expressions similarity scores for both BP and MF ontologies. For instance, wAIC achieves the highest values 0.325 and 0.25 for BP and MF ontologies which are 3.8% and 0.8% higher than the second best values 0.311 and 0.248, achieved by simUI [21] and simGIC respectively. In case of CC ontology, simGIC was achieved the best value, 0.42, which is 4.7% higher than the second best value of 0.401 achieved by wAIC. Figures 6 - 8 show these facts in the comparative diagrams.
The Comparison of Semantic Similarity Measures Based on Table 4
The Comparison of Semantic Similarity Measures Based on Table 5
The Comparison of Semantic Similarity Measures Based on Table 6
4.1. Conclusions
Considering the role of ontology concept to standardize and organize our scientific findings, it is possible to model our biological knowledge through GO ontology. During last decade, many measures have been proposed to utilize GO ontology advantages to measure semantic similarities between biological entities. The state-of-the-art semantic similarity measures are classified into three groups: node-based, edge-based and hybrids of edge- and node based measures [3, 4].
We presented wAIC, a two-stage hybrid measure to estimate semantic similarity between gene products on a GO ontology. In the first stage, in order to compute term-term similarities, it exploits a weighted aggregation of information contents of common ancestors of two terms. WAIC computes the weighted coefficient of each common ancestor using an edge-based approach according to the ratio of minimum distance of a term to the graph root over its minimum distance to a leaf. In other words, a common ancestor would have less impaction similarity whenever it is relatively closer to the root. Then, this weighted sum is scaled by a novel graph-wise factor. So, in the first stage, wAIC uses a hybrid of node-, edge- and graph-wise approaches. In the second stage, WAIC employs a hybrid of a pair-wise and a filtered graph-wise approach to compute gene-gene semantic similarity. The filter based graph-wise measure removes terms that are at low levels in the ontology to prevent from a high semantic similarity for each term pair near the root.
As introduced above, wAIC measure has at least two advantages over other measures: 1) it uses a hybrid node-, edge-, graph-based, pair-wise and group-wise approaches that incorporates advantages of them. 2) Using weighted aggregation of common ancestors and the filter based approaches in the first and second stages are completely consistent with the human perception (the similarity of more specific GO terms -terms at a lower level- of GO graph should be more in comparison to similarity of more general terms). As a future work, we are going to improve wAIC by using the concept of disjoint common ancestors (DCT) or integrating GO ontology with other biological resources.
