


1. Background
Weight gain resulting from a sedentary lifestyle and high-calorie diets can increase the risk of common metabolic disorders, such as fatty liver disease (hepatic steatosis), type 2 diabetes (T2D), and cardiovascular diseases (1). Fructose, a naturally occurring fruit sugar, is extensively used as an industrial sweetener in typical diets across both developed and developing nations. High fructose consumption is increasingly recognized as a leading cause of prediabetes and metabolic syndrome (MetS) (2). The mechanisms underlying fructose-induced metabolic disorders are not fully understood but are under investigation. High fructose intake stimulates lipogenesis, leading to hepatic fat accumulation, insulin resistance (IR), and increased secretion of hepatic very-low-density lipoprotein cholesterol (vLDL-c) (3).
Despite the abundance of findings in nutritional epidemiology, which often require fundamental revision (4), it is evident that high-calorie diets are prevalent worldwide, particularly among younger populations. Consequently, nearly a quarter of the global population is anticipated to face liver diseases or MetS and their complications in the future (5). This growing challenge imposes significant financial burdens on patients, healthcare systems, and governments, underscoring the importance of diagnosing, controlling, and treating early-stage MetS (6).
Currently, lifestyle modifications, including controlled physical activity and dietary improvements, are widely recommended by healthcare professionals to mitigate the risks associated with high-calorie and fructose intake and to enhance quality of life (7). Existing therapeutic strategies emphasize lifestyle changes, such as physical activity and diet. Some studies have highlighted the role of physical inactivity and dysregulation of genes involved in lipid metabolism in the development of diet-induced metabolic disorders (8, 9).
Cluster of differentiation 36 (CD36), a long-chain free fatty acid transporter, plays a significant role in fatty acid storage and metabolism (10). Under physiological conditions, CD36 gene expression in liver cells is typically low. Overexpression and activation of CD36 can lead to hepatic steatosis, while its deletion can prevent fat accumulation in the liver (11). Consequently, CD36 is considered a biomarker for diagnosing and classifying various liver diseases, with changes in its expression directly influencing their progression or improvement, such as in nonalcoholic fatty liver disease (NAFLD) (12).
Hormone-sensitive lipase (HSL), an enzyme active in triglyceride (TG) lipolysis, is another factor contributing to liver metabolic disorders (13). The HSL activity is regulated by phosphorylases in response to adrenergic agents. The intensity and duration of physical activities can alter HSL activation in cells and organs. For instance, HSL activity increases several-fold in skeletal muscles during physical activity and returns to basal levels afterward, while its activation remains maximal in adipose tissue, indicating specific regulation (14, 15).
Training can influence lipolysis or lipogenesis, potentially mediated by changes in CD36 and HSL gene expression (16). Previous studies have shown that a 16-week training program can moderate CD36 gene expression in rats fed a high-fructose and high-fat diet (HFD) (17). Additionally, low-intensity training has been found to increase HSL activity and β-oxidation in fructose-fed rats (18).
Despite extensive research on MetS and its associated disorders, the changes in CD36 and HSL gene expression in liver tissue, hepatic artery aneurysm (HAA), body weight, and the effects of aerobic training on these factors, as well as the role of fructose consumption and inactivity in MetS development, remain incompletely understood. Therefore, this study aimed to investigate the effect of an 8-week interval and continuous training program on CD36 and HSL gene expression and to elucidate changes in liver function and structure in fructose-fed rats.
2. Objectives
The present study aimed to investigate the effect of 8 weeks of interval and continuous aerobic training on hepatic expression of CD36 and HSL genes in fructose-fed male rats.
3. Methods
3.1. Animals and Study Design
All study procedures were conducted in accordance with the EU/2010/63 Directive, which is the European Union (EU) legislation governing the use of animals in experimental research for scientific purposes. The study also received approval from the Research Ethics Committee of Mazandaran University, Iran, with the reference code IR.UMZ.REC.1400.044. Thirty-two male Wistar rats (aged 6 - 8 weeks, 220 ± 20 g) were obtained from the Pasteur Institute, Tehran, Iran. The animals were housed in polycarbonate cages under controlled conditions (temperature: 22 ± 2°C, humidity: 55%, and a 12:12 h light-dark cycle). They were acclimatized to the laboratory setting for one week before being divided into four groups: Normal control (NC), fructose-fed control (FC), fructose-fed continuous training (FCT), and fructose-fed interval training (FIT). The rats were provided with high-fructose corn syrup-55 (HFCS-55) constituting up to 20% of their average total daily energy intake, along with drinking water, for 16 weeks (19).
3.2. Exercise Protocols
All training groups (FCT and FIT) performed a 5-minute warm-up at a speed of 9 m/min on a 0° slope before each training session. After each session, a cool-down was conducted. The interval and continuous training protocols are detailed below (20).
3.3. Interval Training Protocol
After treadmill adaptation, the FIT group performed training routines six times a week, consisting of 3-minute periods at a maximum speed of 40 m/min, followed by 3-minute active recovery periods at a maximum speed of 20 m/min on a 15° slope. Over 8 weeks, the duration, speed, and slope were gradually increased to 36 minutes, 40 m/min, and 15°, respectively (Table 1).
| Week and Practice | Running Velocity (m/min) | Total Time | Incline (%) |
|---|---|---|---|
| 1 | 12 | 5 | |
| Speed | 15 - 20 | ||
| Active recovery | 12 - 14 | ||
| 2 | 18 | ||
| Speed | 20 - 25 | ||
| Active recovery | 14 - 16 | ||
| 3 | 24 | 10 | |
| Speed | 25 - 30 | ||
| Active recovery | 16 - 18 | ||
| 4 | 30 | ||
| Speed | 30 - 35 | ||
| Active recovery | 18 - 20 | ||
| 5 | 36 | 15 | |
| Speed | 35 - 40 | ||
| Active recovery | 20 | ||
| 6 - 8 | |||
| Speed | 40 | ||
| Active recovery | 20 |
3.4. Continuous Training Protocol
The rats in the FCT group participated in six training sessions per week for 8 weeks. The training duration, speed, and slope were progressively increased from 12 minutes, 12 m/min, and 5° to 54 minutes, 20 m/min, and 15°, respectively (Table 2) (20).
| Week and Practice | Running Velocity (m/min) | Total Time | Incline (%) |
|---|---|---|---|
| MICT | |||
| 1 | 12 - 14 | 12 - 15 | 5 |
| 2 | 14 - 16 | 15 - 20 | 10 |
| 3 | 16 - 18 | 20 - 28 | 15 |
| 4 | 18 - 20 | 28 - 39 | |
| 5 | 20 | 40 - 54 | |
| 6 - 8 | 20 | 54 |
3.5. Sampling and Sample Preparation
Seventy-two hours after the final training session, all study groups were fasted overnight. On the day of sampling, the rats were weighed and anesthetized using a ketamine-xylazine combination. Once deep anesthesia was confirmed, a blood sample was collected from the hepatic vein and centrifuged at 3000 rpm for 10 minutes to prepare the serum (21). Following blood collection, the liver tissue was immediately excised and weighed. It was then washed with normal saline, frozen in liquid nitrogen, and stored at -80°C. The Fatty Liver Index (FLI) was calculated using the formula (22):
Additionally, the median lobe of the liver tissue was placed in a container with 10% formalin solution for histological evaluation.
3.6. Liver Histological Assessment
To prepare tissue sections, the formalin-fixed tissues were embedded in paraffin, and 5-µm thick sections were prepared and stained with hematoxylin and eosin (H&E). Using an optical microscope at 40X magnification (Basler, Germany), changes in liver tissue were examined. Histological evaluation criteria included the presence of inflammatory cells, intercellular space (hepatic sinusoids), cytoplasmic degeneration, and irregularity in hepatocyte structure.
3.7. Real-time Polymerase Chain Reaction
To assess liver damage due to fructose consumption and the positive effects of interval and continuous training, changes in CD36 and HSL gene expression were measured in liver tissue. Total RNA was extracted from liver tissue samples using an RNA extraction kit (DENAzist Co., Mashhad, Iran). The quality and quantity of the extracted RNA were assessed via agarose gel electrophoresis and UV spectrophotometry (NanoDrop Co., Iran). cDNA synthesis was performed using a cDNA synthesis kit (Yekta Tajhiz Azma Co., Tehran, Iran). Specific primers for the target genes (CD36 and HSL) and the internal control (β-actin) were designed, and the primer sequences were synthesized (Bioneer Corp., South Korea) (Table 3). The relative expression of the target genes was determined using the Corbett Rotor-Gene 6000 and the Amplicon SYBR Green kit (Denmark). The expression of the target genes, compared to β-actin as the reference, was quantified using the 2-∆∆Ct method developed by Livak (23).
| Genes | Sequences | Gene Bank Codes |
|---|---|---|
| HSL | NM_012859.1 | |
| Forward | 5'-TGAGGGCGATGAGGGACT-3' | |
| Reverse | 5'-TCTCGTTGCGTTTGTAGTGTTC-3' | |
| CD36 | NM_001109218.1 | |
| Forward | 5'-AGTGGCAAAGAATAGCAGCAAGA-3' | |
| Reverse | 5'-AGACAGTGAAGGCTCAAAGATGG-3' | |
| β-Actin | NM_031144.3 | |
| Forward | 5'-GTGTGACGTTGACATCCGTAAAGAC-3' | |
| Reverse | 5'-TGCTAGGAGCCAGGGCAGTAAT-3' |
Abbreviations: HSL, hormone-sensitive lipase; CD36, cluster of differentiation 36.
3.8. Statistical Analysis
Statistical outcomes were presented as mean ± standard deviation (SD). Data analysis was performed using SPSS Statistics software version 16.0. The normal distribution of the data was assessed using the Kolmogorov-Smirnov (K-S) test. Inter-group comparisons were conducted using one-way analysis of variance (ANOVA), followed by Tukey’s test and Duncan’s multiple range test (DMRT) as post hoc tests, with a significance level set at 0.05.
3.9. Insulin, Fasting Blood Glucose, and HOMA-IR
Serum insulin concentration was measured using the ELISA method with a specific kit for rats (Mercodia Co., Sweden), following the manufacturer’s instructions. Fasting blood glucose was collected weekly from the subjects’ tails using a standard glucometer (On Call Plus, Acon Co., USA). Insulin resistance was assessed using the HOMA-IR Index, calculated with the following formula (24): HOMA-IR = (Fasting blood glucose (mg/dL) × Insulin (μU/L))/22.5
4. Results
4.1. Body Weight Change in Study Groups
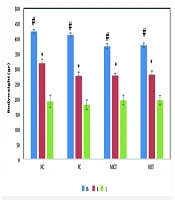
Figure 1 illustrates the intra- and inter-group comparisons of changes in the rats’ body weight across different groups during the study. Body weight exhibited an increasing trend in all groups from the 1st to the 16th week. However, changes in the first 8 weeks were not statistically significant among the study groups. The results indicated that body weight changes exhibited a slower growth trend with the initiation of exercise interventions from the 8th week onward in both the FCT and FIT groups, compared to the first 8 weeks in the FC group. Intragroup comparisons demonstrated a significant increase in body weight from the 4th week onward in the NC, FC, and FCT groups. Significant changes were observed during the 8th and 16th weeks compared to the 1st week. In contrast, the FIT group did not show significant changes in body weight from the 8th week onward, from the onset of exercise interventions to the 16th week.
.")
Body weight changes in the studied groups in the first, eighth and sixteenth week. Changes in body weight within the group showed significant differences from the fourth week onwards. However, no significant difference was observed between the groups during the study. * Significant difference with the first week and the sixteenth week. # Significant difference with the first week and the eighth week (P ≤ 0.05).
4.2. Changes in Liver Weight and Histological Index
The study results showed no significant changes between the groups in terms of liver weight and the FLI. Despite this, the average liver weight and FLI in the FC group were elevated compared with those in the NC group (P ≤ 0.05) (Table 4). The results also indicated that interval and continuous training in the study groups receiving fructose did not cause significant changes in these variables compared with the FC group (P ≤ 0.05) (Table 4).
| Groups | Primary Weight (gr) | Final Weight (gr) | Liver Weight (gr) | Liver Index (%) |
|---|---|---|---|---|
| NC | 169.13 ± 18.8 | 412.25 ± 58.4 | 11.47 ± 2.08 | 2.77 ± 0.12 |
| FC | 168.75 ± 18.3 | 397.88 ± 69.7 | 12.02 ± 1.48 | 3.08 ± 0.46 |
| FCT | 162.00 ± 15.7 | 388.50 ± 38.3 | 11.28 ± 1.89 | 2.89 ± 0.29 |
| FIT | 157.57 ± 18.3 | 340.71 ± 59.2 | 10.28 ± 1.29 | 3.07 ± 0.49 |
Abbreviations: NC, normal control; FC, fructose control, FCT, fructose continuous training; FIT, fructose interval training.
4.3. Glucose and Insulin Levels
The results of this study (Table 5) showed that fasting blood glucose in the FC group, similar to the homeostatic model assessment of insulin resistance (HOMA-IR), increased significantly compared to the NC group. In the FCT and FIT groups, insulin, fasting blood sugar, and HOMA-IR levels also increased compared to the NC group. However, the increase in these values was less in the FCT and FIT groups than in the FC group (P ≤ 0.05) (Table 4).
| Groups | Fasting Blood Glucose (mg/dL) | Insulin (μU/L) | HOMA-IR |
|---|---|---|---|
| NC | 95.62 ± 9.05 A | 3.71 ± 2.98 | 0.87 ± 0.01 A |
| FC | 435.55 ± 136.56 B | 4.45 ± 2.7 | 4.78 ± 0.3 AB |
| FCT | 265.10 ± 30.5 C | 5.02 ± 3.11 | 3.28 ± 0.22 AB |
| FIT | 240.00 ± 104.22 D | 4.07 ± 2.55 | 2.17 ± 0.23 A |
Abbreviations: μU/L, micro units per liter; NC, normal control; FC, fructose control; FCT, fructose continuous training; FIT, fructose interval training; HOMA-IR, homeostatic model assessment of insulin resistance.
a Different uppercase shows significant difference among groups (P < 0.05). Different uppercase represents significant difference during study (P < 0.05).
4.4. Cluster of Differentiation 36 and Hormone-Sensitive Lipase Gene Expression
Figures 2A and B show the changes in CD36 and HSL gene expression in the study groups. The hepatic expression of both CD36 and HSL was significantly decreased in HFD rats compared with control mice (Figure 2A and B). However, interval and continuous training interventions for 8 weeks, along with fructose consumption, amplified the expression of these genes, bringing the value in the FCT group close to that in the control group. Figure 2B also illustrates that HSL gene expression, despite its reduction in the FC group compared with the NC group, showed no significant difference. Additionally, interval and continuous training, due to the increased cellular need for energy, did not result in a significant increase in the expression of this gene compared to the FC group.
 gene in different groups; B, changes in hormone-sensitive lipase (HSL) gene expression in different groups. * Indicates significant changes at the 5% level, with the control group; and # indicates significant changes at the 0.05 level, with the FC group.")
A, Changes in the expression of the cluster of differentiation 36 (CD36) gene in different groups; B, changes in hormone-sensitive lipase (HSL) gene expression in different groups. * Indicates significant changes at the 5% level, with the control group; and # indicates significant changes at the 0.05 level, with the FC group.
4.5. Histological Findings
To evaluate the effects of fructose consumption along with interval and continuous training in the study groups, the presence of inflammatory cells, intercellular space (namely, the hepatic sinusoids), cytoplasmic degeneration, and irregularity in hepatocyte structure were examined as histological evaluation criteria. Compared with the NC group, the cytoplasm and nucleus of the hepatocytes were widely observed in the FC group (Figure 3A and B). Irregularity in the hepatic plates was not openly observed, and no apoptosis occurred in the liver cells. In this study, no accumulation of inclusions in the nucleus of the liver cells and no steatosis or cytoplasmic lipid droplets were detected in any rats. In the FIT and FCT groups, compared with the FC group, improvement was found in the cell cytoplasm and nucleus, and there was no irregularity in the liver plates (Figure 3C and D). Lymphocytic inflammation in the FIT and FCT groups also improved compared with that in the FC group, approaching the normal level observed in the NC group in terms of histology.
 group liver tissue; B, FC group liver tissue histology, black arrows point to irregularity of hepatocytes (IH) hepatic sinusoids (HS), Inflammatory cells (IC), swollen nucleus (SN) and cytoplasmic degeneration (CD); C, FCT group liver histology; D, liver histology of FIT group. Magnification of all images is the same (40X)")
The histological funding of the rat liver sections in the studied groups are presented. A, Histology of normal control (NC) group liver tissue; B, FC group liver tissue histology, black arrows point to irregularity of hepatocytes (IH) hepatic sinusoids (HS), Inflammatory cells (IC), swollen nucleus (SN) and cytoplasmic degeneration (CD); C, FCT group liver histology; D, liver histology of FIT group. Magnification of all images is the same (40X)
5. Discussion
The results of the study showed that the consumption of a 20% fructose solution for 16 weeks did not lead to significant changes in body weight. However, fructose consumption significantly reduced the expression of CD36 and HSL genes in liver tissue. Previous studies have indicated that fructose consumption at different concentrations and durations can lead to an increase in body weight (21). It is evident that high fructose intake can lead to metabolic disorders, and a long-term fructose-rich diet can induce MetS, which is usually associated with elevated glucose levels and IR (23).
The increase in liver index in the fructose-receiving groups, although not significant compared to the control group, could be due to TG accumulation in this tissue. Additionally, the weight difference between the NC and FC groups could be explained by mechanisms of appetite suppression and energy homeostasis. It was observed that food intake was significantly reduced during the study period in the FC group, indicating that appetite control mechanisms were activated, balancing body weight. Consistent with this study, fructose-rich diets combined with inactivity did not lead to hepatic steatosis (25), and body weight was controlled by energy balance in most studies using 124 to 201 g of fructose concurrently with a normal diet (20).
Although HSL is a critical enzyme for lipolysis in target tissues of insulin and hormones involved in metabolism (26), HSL gene expression in the FC group was decreased compared to the NC group, but not significantly. This could be justified by the fact that when blood sugar increases, there is no need to increase HSL gene expression to compensate and supply cellular energy. In this respect, interval and continuous training could not cause a significant increase in the expression of this gene compared with the FC group due to the increased cellular requirement for energy. Furthermore, this decrease could be attributed to the high levels of insulin in this group. Long-term fructose consumption was the leading cause of IR in the target tissues of this hormone, and insulin could thus prevent lipolysis in liver tissue by reducing the expression of its target genes, including this enzyme.
Accordingly, results showed that interval and continuous training in the groups receiving fructose could not bring significant changes to the hepatic expression of HSL compared with the FC group. Long-term fructose consumption along with interval and continuous training could moderate the serum levels of liver enzymes, glucose, and TGs, thereby preventing the development of metabolic disorders in these nutrients (25, 27-29). These results could be attributed to the improvement in the metabolic pathways of each nutrient (5).
Fructose-rich diets accompanied by inactivity can stimulate hepatic lipogenesis, subsequently increasing intrahepatic triglyceride (IHTG) concentration and glucose levels (6, 30). The molecular results in this study further established that, unlike HSL, CD36 gene expression significantly decreased in the liver tissue of rats with fructose consumption for 16 weeks. Receiving different concentrations of fructose over various periods leads to fat accumulation in the liver, manifesting as hepatic steatosis (31), a condition that can progress to steatohepatitis following prolonged fructose intake. Despite this, some studies have found no significant changes in the expression of this gene after 60% fructose consumption for 28 days (32).
Considering the transport of long-chain free fatty acids into liver cells and their subsequent storage or conversion to acetyl-CoA as one of the main functions of CD36 in the liver (33, 34), the expression of this gene was reduced in the FC group compared to the NC group in this study. Indeed, this reduction could be validated as a protective response in liver cells with intrinsic mechanisms due to environmental factors during long-term fructose consumption (35, 36). Additionally, CD36 gene expression was elevated in the exercise groups receiving the fructose solution compared with the FC and NC groups. Nevertheless, this rising trend was not significant in the FIT group. The discrepancy in results among the exercise groups in the present study suggests that metabolic pathways might be involved in the training protocols (10, 37). Continuous training was effective in modulating CD36 gene expression in the liver (38, 39).
The results showed that CD36 gene expression was incoherent with fasting blood glucose levels in the FC group, confirming the regulatory role of the liver in storing and utilizing different forms of lipids, compared with muscle tissue. The decrease in the expression of this gene in the present study could further provide a defense mechanism against the increasing free fatty acid load, due to the combined function of synthesis and reduction in fatty acid. However, the build-up of TGs in the liver is the initial stage of damage caused by hepatic steatosis, followed by inflammation, which could intensify with continued exposure. This could also be consistent with the development of steatohepatitis after high fructose consumption in this model (regardless of its dose), aligning with previous results (25, 40).
Although continuous training significantly modulated the effect of long-term fructose intake, it could not bring the level of HSL gene expression closer to its expression level in the NC group. This observation also emphasizes the regulatory role of the liver, which does not rapidly alter its factors in a short period of exposure to damage, nor does it recover immediately after returning to normal conditions.
Interval and continuous training could moderate HSL gene expression, bringing it closer to normal levels. Additionally, exercise could reduce the size of fat droplets and normalize protein markers involved in lipogenesis and lipolysis (41-43), as observed in the FCT and FIT groups in terms of hepatic TG levels. In accordance with biochemical and molecular results, it is well established in this study and previous studies that fructose consumption does not cause obvious morphological changes in liver cells and fibrosis. Therefore, the presence of free fatty acids in the short term induces autophagic responses and impairs programmed cell death. The histological results of this study, similar to some previous findings, showed abnormal nuclear shapes and cellular disorganization in liver tissue in the FC group. However, in previous studies, no fructose-receiving animal model reports all the liver histological features of MetS in one study. These disorganizations approach the level of the NC group when combined with periodic and continuous exercise. Accordingly, it seems that the greater utilization of cellular reserves during exercise improves physiological function and liver tissue, preventing the progression of further metabolic disorders (44-49).
5.1. Conclusions
This study demonstrates that although prolonged high fructose intake can disrupt lipid metabolism, leading to elevated fasting blood glucose and IR, it may not significantly impact body weight or liver index. Moreover, both interval and continuous aerobic exercises were effective in mitigating the negative effects of fructose on metabolic parameters, improving insulin sensitivity and glucose regulation. Aerobic exercise also showed potential hepatoprotective effects by reducing inflammatory cells and enhancing hepatocyte structure. The findings suggest that aerobic exercise can serve as a viable non-pharmacological strategy to prevent and ameliorate early symptoms of metabolic disorders induced by fructose consumption. Further research is needed to uncover the precise molecular mechanisms involved and the impact of exercise on liver metabolism.
