
1. Background
Chronic pain affects about 50 million Americans or about 20% of the US adult population; it is the third most expensive healthcare expenditure after ischemic heart disease and diabetes and carries a price tag of 67.5 - 94.1 billion USD annually (1, 2). The etiology is varied, and so are the treatment options. Unfortunately, a significant number of patients continue to suffer chronic pain.
Spinal cord stimulation (SCS) involves creating electric fields in the epidural space, which trigger the creation of action potentials. Electrodes are typically placed near the dorsal column midline and generate action potentials that travel in axons (3). After a trial with temporary leads, permanent SCS leads are inserted into the epidural space, percutaneously or via laminectomy. Traditionally, leads are advanced to the thoracic (T8/T9) level, where they are programmed to achieve maximum paresthesia topographic coverage and leg pain alleviation. The power source, an implantable pulse generator (IPG) or radiofrequency unit, is then connected to the leads (4-6).
SCS is traditionally reserved for lumbosacral radiculopathy or chronic back pain that is refractory to other non- or less invasive techniques. Evidence supports its use mostly in failed back surgery syndrome (FBSS), where patients see up to 50% pain intensity reduction, and complex regional pain syndrome (CRPS), where up to 38% alleviation was previously demonstrated (3, 4). SCS devices are currently approved by the Food and Drug Administration (FDA) for use as an aid in the management of chronic intractable pain of the trunk or limbs associated with FBSS, CRPS, intractable low back pain, and leg pain (7, 8). Conventional SCS generates axonal depolarization in the superficial layers of the dorsal columns resulting in paresthesias. The mechanisms of action have not been fully elucidated. However, studies have shown a change in interpretation of other stimuli, including pain, touch, and temperature, and suggest a change in higher processing of painful signals (3).
Unfortunately, conventional SCS is limited, and recent studies show that long term alleviation is close to 30%, despite rates as high as 50% in trials. More recent advances, including high frequency, burst, and dorsal root ganglion (DRG) stimulation, have emerged as options to address the shortcomings of traditional SCS. SCS continues to evolve as a therapy for challenging clinical pain syndromes. Some experimental use and case reports have recently demonstrated evolving applications of SCS, such as visceral abdominal pain (9-11), postoperative pelvic pain (12), and combined alleviation of chronic abdominal and back pain with non-traditional lead placement (13). Thus, there is an ongoing clinical need to expand SCS modes of stimulation with customizable combination programs to meet patient demand.
A new advancement is an (IPG) capable of a simultaneous combination of waveforms, traditional paresthesia based, and sub perception based to modulate the spinal cord (7). Recent studies provide evidence for the efficacy of sub-perception SCS and have set forth to evaluate the efficacy of an SCS system capable of providing multiple combined waveforms (14-17). These studies focus primarily on subperception SCS in patients who were achieving suboptimal results with SCS therapy or evaluated the effects of various frequencies on pain relief (9, 10).
2. Objectives
Here we evaluated the effects of a novel SCS device capable of simultaneous multi-wave form stimulation on the quality of paresthesia and degree of pain relief in patients with marked reduction of recharging capacity of the IPG who presented for replacement.
3. Methods
3.1. Patient Selection and Study Design
This prospective observational study was approved by the Hospital Institutional Review Board (Committee on Clinical Investigations). In our center, all patients who undergo SCS trial and implantation are recorded in a clinic registry and are cross-checked with current procedure and technology (CPT) data. Patients, mostly with previous diagnoses of FBSS or CRPS, who were currently receiving therapy with a traditional paresthesia based device, and were planned for battery exchange due to near or complete depletion of current IPG battery. These patients were offered the chance to participate in this study via phone follow up and a brief questionnaire regarding the quality of paresthesia and pain intensity.
3.2. Device and Programing
All patients previously had adequate coverage and pain relief utilizing only a paresthesia based waveform for many years with the Precision Rechargeable system (Boston Scientific, Marlborough, MA). This SCS device is well known for tightly spaced contacts on the stimulating leads that are powered by multiple independent power sources in the IPG to precisely fractionate and control the current on the cathodes and anodes for shaping the field of stimulation. The new rechargeable SCS system (Spectra Wave Writer, Boston Scientific, Marlborough, MA) has now been commercialized with the following programming functions: (1) Paresthesia optimization through the use of a three-dimensional finite element model of the spinal cord that permits calculation of how much current is necessary to be fractionalized over specific tightly spaced lead contacts to precisely determine the center point of stimulation of the dorsal columns; (2) burst sub perception stimulation runs at a frequency of 450 Hz with six pulses per burst; (3) subperception stimulation at 1.2 kHz; and (4) sequential or simultaneous delivery of the aforementioned waveforms in various program settings. Programming of the devices was performed per routine care by industry representatives at each follow-up appointment.
3.3. Outcome Measurement
Outcomes were measured through a standardized post-procedure patient interview. The interview was conducted by a pain physician four weeks following IPG exchange to detect any potential perceived changes in paresthesia and pain intensity. More specifically, paresthesia was assessed in terms of sensation quality, topographical pain coverage, and positional variation in stimulation intensity for any perceived change pre- compared to post-procedure. Average pain intensity reduction was assessed using a 10-point numeric rating scale (NRS).
3.4. Statistics
Statistical measures and significance were calculated using Microsoft Excel 2020, Version 14.0.7248.5000 (32-bit), and R version 4.0.0 (18), running on Windows 10 version 1903 (OS build 18362.778). Statistical significance of dichotomous variables was determined using a binomial test against a probability of 0.5. Confidence intervals were calculated assuming a t-distribution; a 95% confidence interval was used. A two-tailed student t-test was used to compare means between two groups, and one-way ANOVA was used to compare means of 3 groups or more. χ2 tests were used to infer the significance of the relationship between discrete and non-discrete variables. P-values < 0.05 were considered significant.
4. Results
A total of 30 patients were eligible for inclusion in the study based on the clinic data. Sixteen patients consented and were included, though one was lost to follow up, and a total of 15 patients were available for interview four weeks following IPG exchange (Figure 1). All 16 patients underwent an uneventful IPG exchange for reduced ability to hold recharging energy, and none presented with an indication of a hardware malfunction or infection.
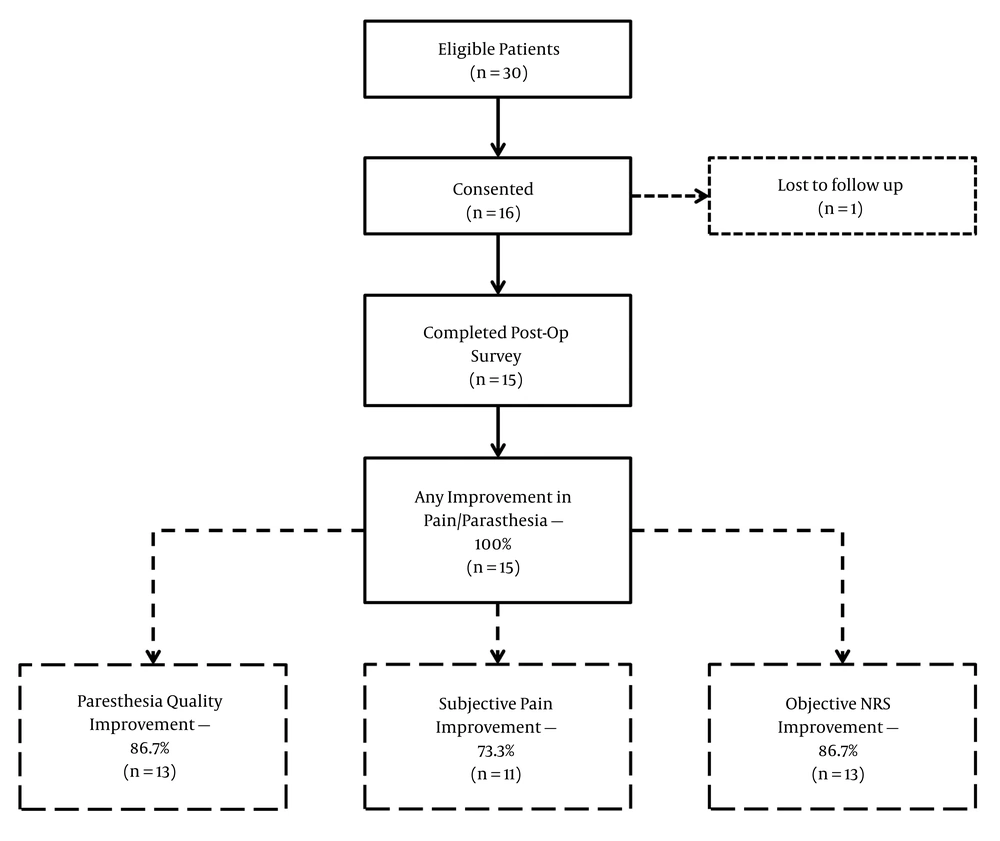
Figure 1.
Overall cohort results. Of 30 eligible patients, 16 consented to be included, and 15 were available to follow up at four weeks. All patients displayed improvement in at least one parameter. Thirteen patients saw improvement in paresthesia (86.7%), and a similar number reported a decreased NRS compared with their pre-implantation NRS. Eleven patients (73.3%) reported subjective improvement in pain control.
The patient demographics are outlined in Table 1. Of the 15 patients in this study, the study population was primarily non-Hispanic white (80%), with an average age was 60.27 years (median 60, range 40 - 83) and a near-even split of male to female. Prior to IPG exchange, the average NRS pain score on a 10 point scale was 7.47 (95% confidence interval [CI]: 6.21 - 8.72), reflecting loss of therapy. All 15 patients were taking some form of oral analgesics, 10 (66.7%) were also receiving injection therapy, and 8 (53.3%) were on chronic opiate therapy.
Table 1.
Patient Demographicsa
| Values | |
|---|---|
| Age, mean; median [range] | 60.27; 60 [44 - 83] |
| Race, No. (%) | |
| Hispanic | 1/15 (6.67) |
| African American | 2/15 (13.3) |
| White | 12/15 (80) |
| Gender, No. (%) | |
| Male | 7/15 (46.67) |
| Female | 8/15 (53.33) |
| BMI, mean; median [range] | 29.31; 29.10 [19.5 - 39.9] |
| SCSindication, No. (%) | |
| FBSS | 8 (53.3) |
| CPRS | 6 (40) |
| Other (lumbar spondylosis) | 1/15 (6.67) |
| Othertreatments, No. (%) | |
| Oral analgesics | 15/15 (100) |
| Injection therapy | 10/15 (66.7) |
| Chronic opiates | 8/15 (53.3) |
| Average pain score (NRS) | 7.47 (6.21 - 8.72) |
aA review of the demographic parameters of our patient population. Patients were mostly white, however, divided between males and females. About half of the patients were diagnosed with either FBSS or CPRS. The table also lists other treatments patients were receiving prior to IPG exchange.
The original rechargeable IPGs were explanted for near depletion necessitating recharging at intervals of 24 - 72 hours. The mean number of years of longevity, standard deviation, and 95% confidence interval were 8.46 + 2.68, and (6.98 - 9.94), respectively.
Table 2 outlines the outcomes that were generally favorable. Only one patient reported a higher NRS pain score following IPG exchange and, and another one appreciated no change leaving the majority 13/15 (86.67%, 59.5% - 98.3%; 95% CI) reported an improved score. The average post-IPG NRS was 4.5 (3.12 - 5.88), and the mean reduction in NRS was 2.97 (1.27 - 4.67). The average perceived pain reduction was 30% (12.7% - 47.3%), which correlated well with a remaining average of 70% (35.3% - 106%) NRS.
Table 2.
One Month Outcomes Following Implantable Pulse Generator Exchangea
| Parameter | Improvement | Significance, % | P-Value |
|---|---|---|---|
| Paresthesia | |||
| Quality sensation | 12/15 (80) | 51.9 - 95.7 | 0.035 |
| Pain coverage | 10/15 (66.7) | 38.4 - 88.2 | 0.30 |
| Positionality | 7/15 (46.67) | 21.3 - 73.4 | 1 |
| Any possible change | 13/15 (86.67) | 59.5 - 98.3 | 0.007 |
| Perceived pain reduction | 11/15 (73.33) | 44.9 - 92.2 | 0.12 |
| Perceived pain reduction, mean, % | 30 | 12.7 - 47.3 | |
| NRS reduction | 13/15 (86.67) | 59.5 - 98.3 | 0.007 |
| NRS reduction, mean | 2.97 | 1.27 - 4.67 | |
| Any improvement | 15/15 (100) | 78.2 - 100 | < 0.001 |
Abbreviations: NRS, Numeric Rating scale.
aThis table enumerates the results after IPG replacement and demonstrates the improvement in each category. Ranges are 95% confidence intervals.
Twelve patients (80%, 51.9% - 95.7%) endorsed improved paresthesia sensation, reporting it as a more soothing sensation with smooth stimulation as opposed to vibratory. Prior to the battery exchange, none of the patients complained of topographical pain coverage, yet 10 (66.7%, 38.4% - 88.2%) indicated either improvement in extraneous or unwanted stimulation and/or better targeting in the areas of pain, e.g., foot. Additionally, 7 saw improvement in positional variation in stimulation intensity; 46.67%, 21.3% - 73.4%). Patients reported this as less shocking or need for adjustment with changes in body position. In summary, every single patient (15/15, 100%) reported an improvement in at least one parameter, whether it related to the nature of the paresthesia or pain intensity (Figure 2). Most patients elected to maintain paresthesia in combination with more 1.2 kHz programming over burst (Table 3), and only three patients relinquished paresthesia all together.
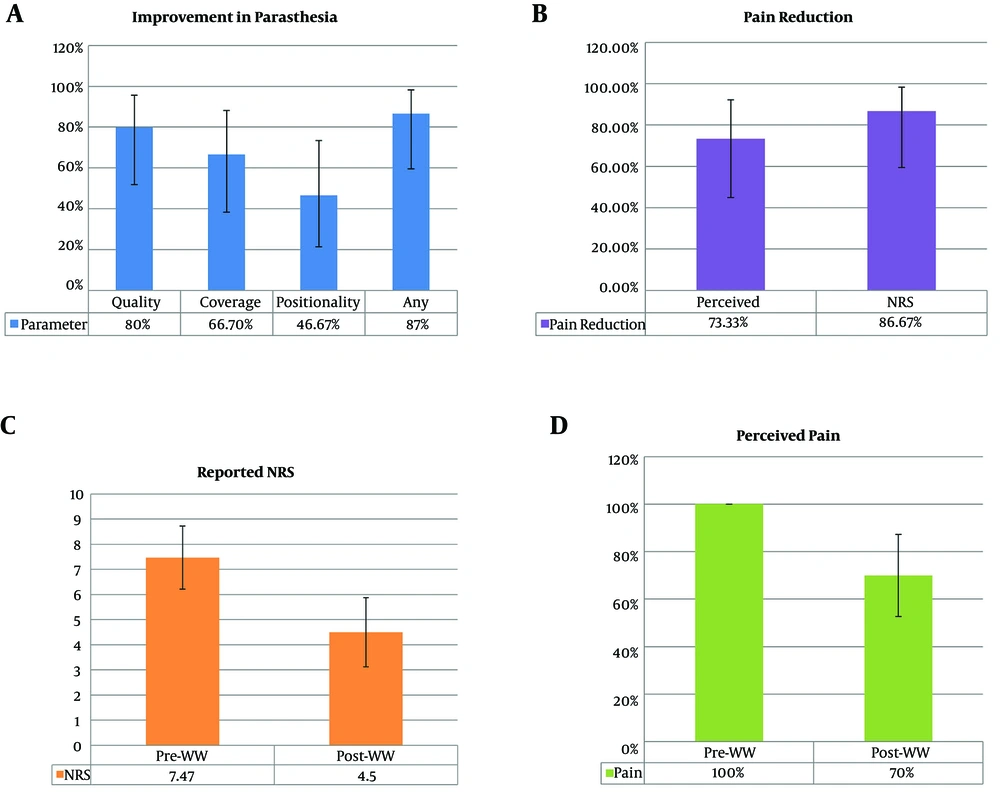
Figure 2.
Changes in pain post-IPG-exchange. A, Eighty percent of patients reported improvement in the quality of paresthesia, 66.7% reported an improvement in the region covered, and 46.67% reported improved positionality; 87% reported improvement in at least one of these parameters; B, 73.33% of patients reported perceived improvement in pain; 86.67% had an NRS rating decreased compared with their pre-IPG exchange NRS; C the average pre-IPG exchange NRS was 7.47, and it was decreased to 4.5 post-exchange; D, patients reported, on average, only 70% remaining perceived pain compared with pre-exchange pain.
Table 3.
Patient Spinal Cord Stimulator Program Utilization at 1 Month Follow-upa
| Patient | 1.2 KHz Sub-perception Stimulation | Paresthesia Low Frequency | 450 Hz Burst Stimulation |
|---|---|---|---|
| 1 | × | × | |
| 2 | × | × | |
| 3 | × | × | |
| 4 | × | × | |
| 5 | × | × | |
| 6 | × | × | |
| 7 | × | × | |
| 8 | × | × | |
| 9 | × | × | |
| 10 | × | ||
| 11 | × | × | |
| 12 | × | ||
| 13 | × | × | |
| 14 | × | × | |
| 15 | × |
aThis table summarizes the primary waveform combinations utilized by patients. Paresthesia based therapy was delivered at a pulse-width of 210 - 400 µs and at a rate of 20 - 60 Hz. Subperception therapy was delivered at 1200 Hz. Microburst therapy was delivered at 450 Hz in packets of 6 at a pulse-width of 210 - 400 µs.
In this small group of patients, there were no patient characteristic associations with final reported pain outcomes. Gender and race were not associated (P = 0.6258), and neither were age and gender (P = 0.69), BMI and gender (P = 0.44), or BMI and race (P = 0.68). SCS indication was not associated with gender (P = 0.35), race (P = 0.89), injection therapy (P = 0.25), or opioid use (P = 0.49), BMI (P = 0.261), or age (P = 0.074). Women trended toward better alleviation of pain with combination therapy than men; all eight women reported subjectively improved pain after IPG exchange, whereas only 3/7 men did. All eight women also reported lower NRS scores after the exchange, while two men did not. However, these relationships were not significant (P = 0.056 and P = 0.39, respectively). The mean NRS reduction in women was 4.38 compared with 1.36 in men (P = 0.056); women reported a higher pre-IPG NRS on average (8.0 vs. 6.86) and a lower post-IPG NRS (3.63 vs. 5.5), though insignificantly so (P = 0.36 and P = 0.14, respectively). Neither NRS reduction nor reduction in perceived pain was associated with age (P = 0.71, P = 0.68) or BMI (P = 0.058, P = 0.76).
5. Discussion
This small pilot study examined the effects of combination multi-wave form therapy in patients who relied on low-frequency SCS for effective pain relief for an average of 8 years. There were clear trends in the utility of at least two waveforms (Table 3) in most patients who were on traditional SCS for years. Patients were provided single waveforms (original paresthesia best programs) and combination therapy. There were no associations found among patient demographic characteristics and reported outcomes. Unexpectedly, three patients preferred to go entirely with sub-perception stimulation at 1.2 kHz. The shift in stimulation paradigms to multi-wave from traditional from exclusively low frequency may improve outcomes in patients who have had success with prior low-frequency devices. The present investigation results are consistent with the early reports from a large study by Metzger et al. (16) and provide evidence to support the simultaneous use of paresthesia with sub-perception programming. In their study, they observed the results in 430 patients and were able to show a significant reduction in chronic pain from pre-implantation NRS of 7.2 by 5.2 (+/-2.4) points at 3 and 12 months of follow up (16). The COMBO RCT is actively researching this, but results are not yet available (17).
Our study demonstrated that there is a preference of a few patients who formerly did well with paresthesia found comparable pain relief at 1.2 kHz and quickly preferred this mode of stimulation. The WHISPER trial was the first large trial that supported the utility of 1.2 kHz. This study examined sub-perception stimulation in a population previously fitted with conventional SCS and compared pain alleviation from supra-perception versus sub-perception in these 70 patients. Importantly, this study involved individuals with long-standing chronic back pain and a high degree of disability who did not achieve optimal results with low-frequency traditional SCS. The researchers were able to show that not only sub-perception stimulation was safe in this population; it achieved response in a higher number of patients (35% versus 27%). Moreover, by allowing subjects to choose their preferred method of stimulation, the responder rate increased to 47% (14). The key important difference of the current study compared to the WHISPER trial is that a higher frequency has utility in patients doing well with paresthesia and is not restricted to those who have not responded adequately to conventional SCS.
In addition to a reduction in pre compared to post NRS and an average perceived 30% improvement, there was an improvement in the overall perception of the paresthesia in the majority of patients. Both the new and replaced IPGs can perform multiple independent current control in a fractionalized manner along tightly spaced contacts. The anatomically-guided axonal targeting using a three-dimensional finite element model of the spinal cord that permits calculated current fractionalized delivery may likely account for the improvement in paresthesia targeting following the new IPG insertion (19). There was an improvement in paresthesia coverage and a reduction in extraneous stimulation. The improved precision of targeting the appropriate axons without overstimulating others may also serve to enhance the quality of the sensation. Lowering the overall chronic pain intensity by running simultaneous subperception programs may also lower the reliance on high stimulation amplitudes and avoid strong or prolonged paresthesias. The three finite element model places the subperception waveform as a constant electric field spanning one or more vertebral bodies (depending on lead length). The rostrocaudal orientation of the electric field is purported to activate inhibitory neurons of the dorsal horn (20, 21). The added mechanism of pain relief from subperception programming has the potential to lessen the need for intense and constant paresthesias that may be perceived as less positionality hence avoiding unpleasant overstimulation with abrupt changes in body position. Carefully studying stimulation amplitudes in future studies may help validate this presumption.
This small cohort carries the limitations of both size and the lack of control. More specific measurements on the nature of paresthesia improvement were not done in this study as it was not an expected finding. For example, we did not assess the number of amplitude adjustments made by the patients daily to quantify the improvement in positionality of the stimulation, nor did we have topographical maps before and after IPG exchange to quantify the degree of paresthesia targeting. Furthermore, there were no functional questionnaires pre- and post-exchange to determine the impact on function or quality of life. It is also possible that the need for frequent recharging and, in several cases, full battery depletion in the preexisting systems contributed to decreased efficacy of stimulation leading to the impression of higher levels of pain reduction. Further large studies are needed to elucidate the mechanism by which combination therapy provides analgesia and, moreover, validate the effectiveness of combination over paresthesia based theory alone.
5.1. Conclusions
Chronic back pain affects 20% of adult Americans and results in significant suffering, inability to perform physical work and normal activities, and financial expense. The reasons are numerous, and treatment options are as well. Despite many medical advances in recent years, many patients continue to suffer from chronic pain. In this regard, a spinal cord stimulator (SCS), a device that produces an electrical signal reducing chronic pain, is effective for certain pain-related diagnoses. In this pilot investigation, we sought to determine how a newer generation of SCS device that provides combined multi-wave form neurostimulation at different frequencies in a simultaneous or a sequential fashion might enhance pain relief in patients who already have satisfactory results with low-frequency traditional SCS for many years.