1. Background
As human beings, we are constantly exposed to different toxic substances in our surrounding environment, which may lead to complex diseases such as cancer, cardiovascular, and respiratory diseases (1). Food contamination and presence of hazardous substances such as heavy metals and chemicals in foodstuff have become inevitable problems during the past few years (2). The accumulation of heavy metals in certain tissues of living organisms can have toxic effects that may lead to several disorders (3, 4). Some elements like lead, cadmium, mercury, and arsenic are non-essential and toxic to the body even at low concentrations while others like copper and zinc are necessary for humans. Nevertheless, even the elements that were mentioned can cause harm and have toxic effects when their intake exceeds certain levels (5).
These heavy metals compete with essential elements due to their chemical similarities and their interaction with several divalent transporters may affect various physiologic functions (6). They also have toxic effects on various systems of the body including cardiovascular, neural, hematopoietic, immunological, and gastrointestinal systems, as well as a possible role in kidney dysfunction, anemia, liver toxicity, cancer, and Alzheimer’s disease (6, 7).
Some heavy metals such as manganese (Mn), cobalt (Co), molybdenum (Mo), Cu, and Zinc as micronutrients can promote the growth of animals and human beings when present in very small amounts while others such as Cadmium, Arsenic, and Chromium act as carcinogens.
Moreover, Hg and Pb are related to the development of anomalies in children (8). Hartwig reported that the long-term intake of Cd caused renal, prostate, and ovarian cancers (9).
Vegetables are good sources of vitamins, inorganics, and fibers and pose antioxidant effects. Vegetable constitutes are also a crucial part of the human diet since they contain carbohydrates, proteins in addition to vitamins, inorganics and trace elements (10). However, the intake of heavy metal-contaminated vegetables may pose a risk to the human health. Vegetables take up heavy metals and accumulate them in their edible portions (11). Consuming these metal-rich plants and their edible portions in high enough amounts can cause clinical outcomes in animals and humans (12).
Furthermore, some essential nutrients in the body can be depleted through the consumption of heavy metal-contaminated food, which can reduce immunological defenses, intrauterine growth retardation, impaired psychosocial behavior, and increased risk of upper gastrointestinal cancer (11, 12). Carcinogenic effects due to the regular consumption of fruits and vegetables loaded with heavy metals such as cadmium, lead, copper, and zinc are known.
There are already published investigations related to the incidence of gastrointestinal (13), pancreas, and urinary bladder or prostate cancers (14).
Golestan province in the northeast of Iran is one of the high-risk areas for developing esophageal cancer (E. cancer), which ranks third to Mazandaran and Khorasan provinces (15). Like many other regions of the world, squamous cell cancers constitute more than 90% of all E. cancer incidences in northeastern Iran (15). Although many risk factors have been studied for their possible role in esophageal squamous cell carcinomas in this province, such as benzo (α) pyrene and polycyclic aromatic hydrocarbons (16), a limited number of studies could demonstrate their direct association with this disease. In addition, other risk factors for squamous cell E. cancers include low income, moderate/heavy alcohol intake, tobacco use, and infrequent consumption of raw fruits and vegetables (17).
About 40 years ago, the age-standardized rate (ASR) of esophageal cancer in Gonbad (in Golestan province) was found to be one of the highest rates among other regions of the word (ASR > 100/105/year) (18).
2. Objectives
Cucumber and tomato are two of the most commonly consumed vegetables in Iran, particularly in Golestan province. The residents of this province use cucumber for pickling and consume the combination of tomato and cucumber with meals in the form of salad or side dish. Therefore, in this study, we investigated heavy metal (cadmium, lead, and zinc) levels in cucumber and tomato samples obtained from the main local markets in an endemic region of E. cancer in Northeastern Iran (Golestan province).
3. Methods
Golestan province, with Gorgan city as the capital, is one of the northern provinces of Iran, located in the range of 36° 30’ to 38° 8’ N latitude and 53° 51’ to 56° 22’ E altitude. It has a population of 1.7 million (2011) and covers an area of 20380 km². (It It should be mentioned that one of the main products produced in the province is cucumber and tomato so that the surplus is exported to other parts of the country.
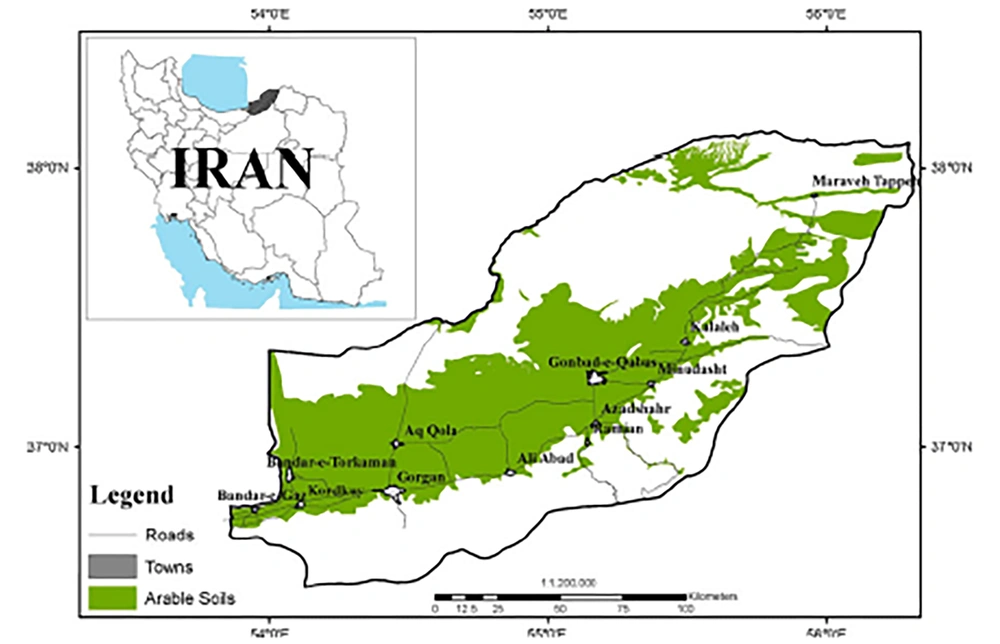
Figure 1.
The map of Golestan province indicating arable lands
More than 120 samples of harvested fresh vegetables (60 samples of cucumber and 60 samples of tomato) were collected during 2015 from the two main fruit and vegetable wholesale markets in Gonbad (located in the east) and Gorgan (located in the center) cities of Golestan province, Iran. Three to five sub-samples of the mentioned vegetables (cucumber and tomato) were also collected from other wholesale markets. The collected samples were sent to the laboratory for the analysis while being stored in clean polythene bags according to their type.
The samples were washed thoroughly with deionized water in order to remove dust particles. Vegetable samples (100 g) were cut into small parts by using a clean knife and dried at 60 - 70°C for 24 hours (19). Dried samples were ground in a porcelain mortar and infiltrate 20-mesh sieve. One gram of the sieved samples was put in a beaker, mixed with 10 mL of 65% high purity HNO3 solution (19). Digestion was performed on the mixture at 80°C until a transparent solution was obtained. Whatman No. 42 filter papers were used to filter the digested samples after cooling (19). Polarography voltammetry (Metrohm Model 797) was performed to determine the levels of heavy metals of Cu, Zn, Cd, and Pb. A similar method was used for fruit filtrates.
To avoid external contamination during the study, all samples were handled with care and the glassware was cleaned properly. Blank samples of the used reagents were utilized for the correct reading of the instrument. Analytical procedures were validated by the analysis of the samples repeatedly against internationally certified plant standard reference material (SRM-1570) of the National Institute of Standard and Technology (20). The quality control (QC) samples made from the standard solutions of Cd, Pb, Cu, and Zn were analyzed in duplicate and standard stock and blank solutions were run after every six samples to control the metal recoveries. The recovery rates ranged from 91 to 100% for the studied heavy metals (Table 1). The detection limits for Cd, Pb, Cu, and Zn by voltammetric analysis (Metrohm 797 VA Computrace) were 0.1, 0.1, 1.0, and 1.0 µg/L, respectively.
Table 1.
Certified Standard Reference Material (SRM 1570) Data for Checking the Analytical Accuracy
| Element | Certified Value, Mg/Kg | Observed Value, Mg/Kg | Recovery, % |
|---|---|---|---|
| Cd | 0.03 ± 0.02 | 0.0294 ± 0.007 | 98 |
| Pb | 0.14 ± 0.025 | 0.13 ± 0.09 | 93 |
| Zn | 0.45 ± 0.13 | 0.45 ± 0.02 | 100 |
| Cu | 0.09 ± 0.021 | 0.082 ± 0.031 | 91 |
The comparison of the concentration of the contaminants recorded from both fruit and vegetable wholesale markets with national and international safety limits was done to assess the potential health adverse effects of contaminated vegetable consumption. The daily intake of heavy metals via the utilization of the tested vegetables was calculated according to the given equation (20).
The average daily vegetable consumption according to the Institute of Standards and Industrial Research of Iran (ISIRI) was estimated at about 109 g/person/day (21).
The daily consumption rate of heavy metals was divided by the values of provisional tolerable daily intake to calculate the contribution percentage of heavy metals’ dietary intake by the urban population through the utilization of the tested vegetables in this study (22).
The health risk index was computed as the ratio of approximated exposure of test crops and oral reference doses (20). Oral reference doses (RfD) were 0.04, 0.3, and 0.001 mg/kg/day for Copper, Zinc and Cadmium, respectively (23) and 0.004 mg/kg/day for Pb (23, 24). Approximated exposure was obtained by dividing the daily intake of heavy metals by their safe limits. This is considered another term called the hazard index (HI). The equation is HI = DI/RfD where DI and RfD are daily intake and reference dose (RfD) in mg/kg/day, respectively (20).
Daily intake was calculated by Equation 1:
Where DIM, Cmatter, Dfood intake and Bmean weight represent daily intake of metal, the heavy metals concentrations in plants (µg/ g), daily intake of vegetables (mg/kg/day), and mean body weight (kg), respectively.
For the statistical analysis of the obtained data, SPSS (version 18) was used and a two-way analysis of variance was accomplished to recognize the effect of different variables on the tested heavy metals’ concentrations among the tested fruits. Separate ANOVA tests were done for each tested fruit.
4. Results
4.1. Concentration of Heavy Metals in Vegetables
The concentrations of heavy metals (mg/kg) were different in the two sites. The amounts of Zn in cucumber and tomato varied from 15.4 to 128.5 and 1.1 to 49 in Gorgan and Gonbad wholesale markets, respectively. This trend was from 0.005 to 0.52 for Cd, not detectable (ND) to 0.39 for Pb, and 0.38 to 3.7 for Cu in the tested cucumbers and 0.1 to 2.2, 1.4 to 14.2, and ND to 7.7 for Cd, Pb and Cu, respectively, in the tested tomatoes. Among the two studied sites, the highest concentrations of Zn and Cd in cucumbers were recorded in Gorgan while the amounts of Pb and Cu in cucumbers from Gonbad were higher than in cucumbers from Gorgan. In the case of heavy metals concentrations in tomatoes, the tested tomatoes from Gorgan had higher amounts of all the tested metals compared to tomatoes from Gonbad (Table 1). The concentrations of Pb and Cd in cucumber and tomato were significantly higher than the concentrations of other tested heavy metals. The highest concentrations of Pb and Cd were accumulated in cucumber while the least amount of the forenamed metals was found in tomato (Table 2).
| Item | Cucumber | Tomato | WHO/FAOc | ||
|---|---|---|---|---|---|
| Gonbad | Gorgan | Gonbad | Gorgan | ||
| Zn | 53.4 ± 27.7 (0.9) | 60.3 ± 35.5 (1.03) | 17.9 ± 11.9 (0.3) | 23.8 ± 15.2 (0.4) | 60 |
| Cd | 0.09 ± 0.14 (2) | 0.12 ± 0.15 (2.4) | 0.03 ± 0.028 (0.6) | 0.08 ± 0.12 (1.6) | 0.05 |
| Pb | 1.47 ± 075 (14.7) | 1.4 ± 1.04 (14.4) | 0.5 ± 0.31 (5) | 0.7 ± 0.65 (7) | 0.1 |
| Cu | 4.1 ± 3.5 (0.1) | 3.7 ± 3.5 (0.1) | 0.85 ± 0.45 (0.02) | 1.7 ± 2.1 (0.04) | 40 |
Our findings showed that the concentrations of Pb and Cd in cucumber and tomato were above the food safety limits in comparison with the threshold values issued by the WHO/FAO. This could pose a potential risk in terms of products’ quality to consumer’s health. In contrast, Zn and Cu concentrations in all the studied samples were below the food safety limits (25, 26).
This agrees with the non-statistically significant correlation coefficients between the concentrations of heavy metals in vegetables and esophageal cancer in Golestan province (P-value > 0.05).
Golestan province in the northeast of Iran is one of the high-risk areas for esophageal cancer in the world (18). While our results showed that the average concentration of some of the tested metals in cucumber samples was more than the values in food proposed by FAO/WHO (26) (Particularly in the cases of Cd and Pb where the values exceeded up to 2.4 and 14.7 times more than the WHO/FAO guidelines, respectively) (Table 2), there were no statistically significant correlations between esophageal cancer and heavy metal concentrations in vegetables from Gonbad and Gorgan (P > 0.05). The amount of Zn, Cd, and Pb in cucumber and tomato was significantly higher in Gorgan samples than in Gonbad samples (Table 2). In general, the concentrations of Zn, Cd, Pb, and Cu were lower in tomato samples than in cucumber samples. Heavy metals concentrations in vegetables found in this research and other studies are listed in Table 3. Data from the open literature showed that heavy metal concentrations in the vegetable samples varied widely depending on the sampling area.
Table 3.
Comparison of Heavy Metal Concentrations (mg/kg d.w) in Vegetables with Values Taken from the Open Literature
4.2. Heavy Metal Intake
Table 3 presents the evaluation of each heavy metal intake by the use of the studied foodstuff. The Institute of Standards and Industrial Research of Iran (ISIRI) has estimated that the average consumption of vegetables (cucumber and tomato) among Iranian individuals is 218 g per day (21). If the amounts of heavy metal contamination (Tables 2 and 3) recorded in this study represent the contaminants’ concentrations in the tested vegetables used by the residents in Golestan province (the cancer region), the portion of all heavy metals to the dietary intake will be 77.7, 0.16, 2.02, and 5.15 mg/kg, for Zn, Cd, Pb, and Cu, respectively (Table 4).
Table 4.
Estimation of Heavy Metal Intake Due to Using Vegetables in Golestan Province, Iran
| Vegetables (G/Person/Day) | Zna | Intake (Mg/Day) | Cda | Intake (µg/Day) | Pba | Intake (µg/Day) | Cua | Intake (Mg/Day) |
|---|---|---|---|---|---|---|---|---|
| Tomato (109) | 20.9 | 2.28 | 0.06 | 5.98 | 0.58 | 63.2 | 1.26 | 1.4 |
| Cucumber (109) | 56.9 | 6.2 | 0.11 | 11.6 | 1.43 | 155.8 | 3.9 | 0.43 |
| Total (218) | 77.7 | 8.48 | 0.16 | 17.5 | 2.02 | 219 | 5.15 | 1.83 |
| Total PTDIb | 60 | 60 | 214 | 3 |
a Mean concentration (Mg/Kg), Joint FAO/WHO expert committee on food additive (1999) (22).
b PTDI, stands for provisional tolerable daily intake (maximum daily exposure level to a contaminant).
Based on the estimated daily intake of the studied heavy metals via the consumption of cucumber and tomato, the average amounts of these contaminated vegetables consumption do not have adverse effects on the consumers (except for lead) since the obtained values were below the FAO/WHO limits for heavy metals intake according to the body weight of an average adult (60 kg body weight). Provisional tolerable daily intakes (PTDIs) for Zn, Cd, Pb, and Cu are 60 mg, 60 µg, 214 µg, and 3 mg, respectively (22). The present study showed that the contributions of these vegetables to daily intakes of Zn, Cd, Pb, and Cu were respectively 14.1%, 29.2%, 102.3, and 61% of the provisional tolerable daily intakes (PTDI).
4.3. Health Risk Index (HRI) of Heavy Metals
The Health risk indices (HRIs) of heavy metals through vegetable use are given in Table 5. The HRI of heavy metals from vegetable use was in a decreasing order of Pb > Cu > Zn > Cd.
Table 5.
HRI of Heavy Metals in Vegetables from Golestan Province
| Heavy Metals | RfD (Mg/Kg/Day) | DI (Mg/Kg/Day) | HRI |
|---|---|---|---|
| Zn | 0.3 | 0.14 | 0.47 |
| Cd | 0.001 | 0.29 | 0.29 |
| Pb | 0.004 | 0.004 | 0.91 |
| Cu | 0.004 | 0.31 | 0.76 |
Pb has the highest HRI value and the highest potential risk for health while Cd ingestion has the least risk. Only HRI of Pb for adults was found to be near the value of 1. The potential health risk of Pb was the highest, which may be ascribed to its lower oral reference dose. This demonstrates the relatively minor risk from Cd and the dominant contributions of Pb for the inhabitants of the study area.
The analysis of the HRIs of sample heavy metal concentrations showed that some sample sites in the highest and middle reaches of the vegetables presented a relatively high risk. According to the HRIs, Pb represented a near high risk (HRI = 0.91) and Cd was associated with a relatively low risk (HRI = 0.29) in the region. The analysis of the health risks from consuming the vegetables suggests that people are not subjected to a significant potential health risk from the intake of a single metal consumed in the vegetable. Thus, exposure to a single metal through vegetable consumption was surmised safe for the people of this province.
5. Discussion
In the present study, Zn and Cu concentrations in cucumber and tomato samples were in the range of WHO/FAO and Iran permissible limits while Cd and Pb concentrations were higher than the permissible limits (21, 25), which is due to the different accumulation capabilities of the tested vegetables and soil properties diversity.
Heavy metal contamination of the food sections is also one of the most important characteristics of food quality assurance (30, 31). International and national regulations on food quality have lowered the maximum permissible level (MPL) of toxic metals in foodstuff because of an increased awareness of the risk of these metals in food chain contamination (31, 32). Therefore, additional environmental factors should be monitored to explore the sources of heavy metal pollutions to guarantee both arable soil quality and food safety. The high loadings of phosphorus indicate the increased elemental concentration because of the more frequent use of phosphorus fertilizers and organophosphate pesticides in the agricultural lands of Golestan province (33). In addition, spraying against pests in the cucumber fields at least twice a week may cause an increase in some heavy metals in vegetables.
Wei and Yang (34) also believe that heavy metals in agricultural soils and vegetables are mainly originated from fertilizers and pesticides. The authors suggest that the large daily intakes of these vegetables are likely to act as a significant health risk to the consumers.
In our study, concentrations of Cd and Pb were noted to be above the critical levels reported in 1994 by WHO (0.1 and 0.05 mg/kg for Cd and Pb, respectively) (35); thus, it might be a great threat to the human consumers. This trend resembled those presented in a study in Egypt (36) and Tanzania (37). However, Cu levels in similar food samples were higher in China (38) and lower in Romania (39) and Libya (40) compared to our findings. Our results were also in agreement with the findings of Ali and Al-Qahtani who reported Cd, Pb, and Cu concentrations in vegetable samples, grown in the Kingdom of Saudi Arabia (29). The high concentration of Cd and Pb found in many samples might be nearly relevant to the contaminants in the irrigation water, farmland, and especially overuse of fertilizers and pesticides for the elimination of pests, weeds, and different accumulation capabilities of the tested vegetables and soil properties diversity (41).
Based on other studies from various countries, it has been reported that the dietary intake of Pb in adults varied between 30 μg/day (28) and 427 μg/day (30). For Cd and Cu, the approximated daily intakes were from 4.6 μg to 30 mg/day and 0.45 to 20 mg/day, respectively (28, 37). It can be concluded that the estimation of daily intake for Pb in the present study was above the reported values from other countries whereas the estimation of Cd and Pb intakes is lower than the value of 1. Moreover, the estimated daily intakes of Pb and Cd in this study were below the heavy metals intake limits reported by FAO/WHO (according to the average weight of an adult person, 60 kg). PTDI for Pb, Cd, and Cu was 214 μg, 60 μg, and 3 mg, respectively. Thus, the authors believe that daily intakes of these vegetables may do not have harmful effects on the health of consumers, which is related to the daily intakes of the heavy metals in the vegetables. Overall, it is noticeable that the intakes of these toxic metals through foodstuff, water, air, etc. can be a risk for human health in the future.
However, the combination of several toxic heavy metals can pose a risk to the local inhabitants (42, 43). This indicates that consumer's health and quality of life may be affected in the near future as the heavy metals accumulation in long term can lead to biomagnification. Furthermore, this study mainly aimed to assess the toxic effects of heavy metals via vegetables consumption, while humans may be further exposed to heavy metals through other foodstuff/routes like the use of other contaminated foodstuffs such as vegetables, fruits, fish, meat, water, and milk, as well as other sources such as dust inhalation and dermal contact (44, 45).
5.1. Conclusion
The results indicated that nearly all tested vegetables (cucumber and tomato) in Golestan province were highly contaminated with Cd while Pb occurred in cucumbers and some tomato samples. The contamination degree of Cd was higher than that of Pb, and the Cu contamination was relatively low in the vegetables from Golestan province. The amounts of Cadmium and Lead were higher than the allowable levels issued by WHO/FAO. It can be concluded from this research that the high amounts of Cd and Pb in cucumber samples compared to tomato samples may indicate the overuse of fertilizers and pesticides by farmers of this region because the use of pesticides and chemical fertilizers is more in these farms than in other farms.
In conclusion, considering the high prevalence of upper esophageal and gastric cancer in Golestan province and its potential health threats and economic burden on the residents of this region, further research regarding the role of environmental toxins, heavy metals, and other risk factors associated with the carcinogenesis of such contaminants seems essential.