1. Background
Halogenated hydrocarbons are a group of chemical compounds used as flame retardants, refrigerants, propellants, solvents, and pharmaceuticals. These widely used compounds are easily released into ambient air and can have harmful effects on workers’ health (1, 2).
Some of these compounds are suspected carcinogens and have detrimental effects on liver and kidney. The international agency for research on cancer (IARC) has classified chloroform as possible carcinogen (Group 2B) and tetrachloroethylene as a potential human carcinogen (Group 2A) (3).
Since 1993, Solid phase micro-extraction (SPME) has been used It is a simple sampling technique with high sensitivity, solvent-less, cost-effective, easy to use, and could be automated (4). Since then, commercially available SPME fibers have been used to determine the time weight average (TWA) for some chemical compounds.
Effects of environmental parameters, such as temperature, relative humidity, and velocities on the performance of SPME were examined in several studies (5-12). These parameters may have effects on the mass absorbed to the sampler and also on the precision of the data.
The mass of analytes adsorbed by the SPME sample could be calculated under Fick’s first law that it depends on gas-phase molecular diffusion coefficient and temperature in ambient air (13). The velocity in the ambient air of workplaces is usually between 0 - 0.5 m/s and according to a research average air velocity in most workplaces is less than 0.35 m/s (14). Relative humidity could be a determining factor in sample responses and therefore should be taken into consideration. Some workplaces (like laundries) have higher heat and humidity than others (like offices), so in designing sampling methods for application, it is wise to consider the effect of environmental parameters like air temperature, velocity, and relative humidity.
Zare Sakhvidi et al. reported a significant effect of temperature on the performance of SPME for sampling of perchlorethylene but he showed that temperature and air velocity did not have any significant effects on the sampling rates of epichlorohydrin (15). In some occupational and environmental inhalation exposure studies, SPME was applied for determination of inhalational anesthetics, perchlorethylene, acetonitrile and carbon disulfide (7-12). Most of these studies focused on single compounds and to the best of our knowledge, few studies have reported on the effects of environmental parameters on sampling rate from different compounds using SPME. As the environmental parameters may affect the precision of real amounts of analytes uptake by fibers of SPME and it may make errors in final results therefore assessment of these parameters is essential for taking the sampling method into consideration.
In this study, the effects of humidity, temperature and wind velocity on sampling rate of some halogenated hydrocarbons (2-chlorophenol, cholorobenzene, chloroform, carbon tetrachloride, halothane, isoflurane and sevoflurane) using SPME and a standard atmosphere chamber in laboratory were investigated. The effects of storage time and conditions on SPME were also examined.
2. Methods
The USP grade halothane (2-bromo-2-chloro-1,1,1-trifluoroethane) was purchased from Nicholas Piramal (Mumbai, India). The USP grade Isoflurane (2-chloro-2-(difluoromethoxy)-1,1,1-trifluoro-ethane) was purchased from Nicholas Piramal (Morpeth, United Kingdom) and USP grade sevoflurane (1,1,1,3,3,3-hexafluoro-2-(fluoromethoxy)propane) was from Abbot Laboratories. The USP grade 2-Chlorophenol, Cholorobenzene, Chloroform, Carbon Tetrachloride, 1-Butanol (99.5%) and carbon disulphide (99%) were purchased from Merck (Darmstadt, Germany). All new fibers were conditioned in GC injector according to manufacturer’s recommendations. Seventy-five micrometers of carboxen/polydimethylsiloxane (CAR/PDMS) SPME fibers and manual holders were supplied from Supelco (Supelco, Bellefonte, PA).
In this cross-sectional study, the authors designed a dynamic atmosphere standard chamber (15) and installed it in the laboratory (Figure 1). The temperature in the system was controlled by a heating coil that was actuated by a thermocouple with a temperature sensor (Samwon Eng, Model SU-105, South Korea). The system has three areas of different dimensions that allow velocity to be changed in each area. The velocity in a chamber was measured with a calibrated thermo -anemometer. Air of different humidity was generated using an impinge system at a range of bubbling flows and temperatures. Humidity was continuously monitored by a Testo 601 hygrometer (Model Testo 601, Testoterm GmbH & Co, Germany).
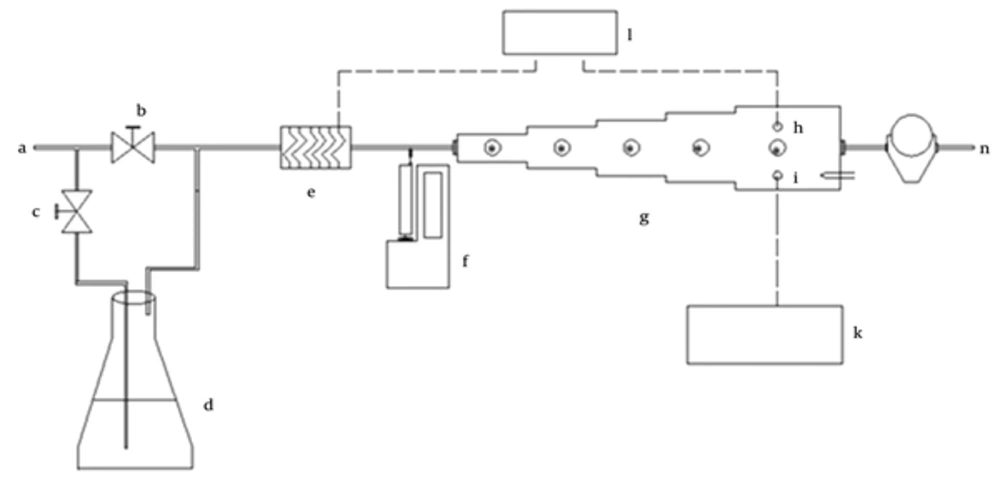
Figure 1.
A, air inlet; B, bypass valve; C, valve to humidity system; D, humidity generation system; E, electrical coil; F, syringe pump; G, sampling chamber; H, temperature sensor; I, humidity sensor; J, sampling location; K, hygrometer; L, thermocouple; N, dry gas meter; O, outlet (to hood).
This system was suitable for sampling at various air velocities, temperatures, and humidity (Figure 1). Analytes were injected into the premixing chamber with a calibrated syringe pump (SEP-10S Plus, Aitecs, Lithuania). The diluents’ gas flow rate in the system was supplied from an oil free compressor that was equipped with traps for hydrocarbons and volatile compounds and was checked continuously by a calibrated dry gas meter (Elster-Handel, Germany). In the upper surface of chamber, there are some septums for location of sampling by (Figure 1J) SPME and duration of sampling was 3.5 - 4 hours. The concentration was calculated by the following equation (Equation 1).
That ρ is the density of analyte (g/mL), IR is injection rate (mL/h), MW is the molecular weight of analyte, C is the desirable concentration in the chamber in ppmv, Vm is the molar volume (24.45 L in the case of air at 25°C and 1 atm.) and Q is diluents’ gas flow rate (liters per minute).
A Varian 3800 GC-Saturn 2200 mass spectrometer was used to analysis SPME samples. The capillary VOCOL column 60 m × 0.25 mm ID and 1.5 μm film thickness (Supelco, Bellefonte, PA) used in gas chromatography–mass spectrometry (GC-MS) and carrier gas was helium in flow rate of 1 mL/min. The MS transfer line temperature was set at 220°C. The temperature program for analytes was set at 60°C for 1 minute and then increased at 4°C/min to 170°C and held for 1 minute. Calibration standards for analysis of samples were prepared in the range 0.5 - 1000 mg/mL in 1-butanol because of its low vapor volume.
For obtaining a cablibration curve based on the peak area, 0.1 mL of each liquid standard was injected to GC in triplicate
A total size of 54 samples obtained to assess the effects of temperature, humidity and velocity on sample rate and also the effect of storage time on samples recovery.
Concentration in the SPME samples could be calculated by the following equation according to Fick’s first law (13) (Equation 2).
In this equation, n is mass of analyte absorbed on the SPME fiber (in nanograms) and determined by external liquid calibration. Dg is binary gas phase diffusion coefficient (in square centimeters per second), A is the diffusion cross-sectional area (in square centimeters), t is the sampling time in minutes, and C is the concentration of analyte in the sampling area (in nanograms per cubic centimeter).
The term DgA/L in Equation 1 is called the sampling rate (SR). Dg could be theoretically calculated according to the method developed by Fuller et al. from following equation (16).
In this equation, T is temperature (in kelvin) and MA and MB are molecular mass of air and analyte respectively, P the air pressure (in atmosphere) VA and VB are molar volume of air and analyte respectively (in cubic metres per mole).
2.1. Statistical Methods
Statistical analyses were carried out by statistical package for social science (SPSS, version 17, Inc., Chicago). Charts and monograms were also created by Microsoft Excel®2007. The concentration difference among data was performed by analysis of variance (ANOVA) test and Tukey’s test. A P < 0.05 was considered statistically significant.
3. Results
Table 1 showed the effect of temperature variation and velocity on the sampling rate. Analysis of the results by ANOVA showed that ± 5°C variation in temperature does not have a significant effect on the mass uptake of the sampler over sampling time (P value > 0.05), but an increase of 10°C (from 20 to 30°C) has a significant effect on mass adsorbed by fibers (P value < 0.05) under the same conditions. Figure 2 shows the relation of temperature with gas diffusion of halogenated hydrocarbons.
Table 1.
Effect of Temperature and Velocity on CAR/PDMS Fiber Sampling Rate in 0.5-cm Retracted Mode (Sampling Rate Was Divided by 1000)
| Compounds | Temperature, °C | Mean ± SD | Velocity | Mean ± SD |
|---|---|---|---|---|
| Halothane | 20 | 8.32 ± 0.64 | 0.00 | 6.62 ± 0.19 |
| 25 | 6.98 ± 0.27 | 0.05 | 7.02 ± 0.28 | |
| 30 | 6.97 ± 0.57 | 0.10 | 6.90 ± 0.46 | |
| 0.30 | 6.88 ± 0.35 | |||
| 0.50 | 6.97 ± 0.29 | |||
| Isoflurane | 20 | 6.07 ± 0.30 | 0.00 | 5.73 ± 0.09 |
| 25 | 6.01 ± 0.10 | 0.05 | 6.18 ± 0.30 | |
| 30 | 6.21 ± 0.40 | 0.10 | 6.10 ± 0.26 | |
| 0.30 | 5.91 ± 0.32 | |||
| 0.50 | 6.10 ± 0.27 | |||
| Sevoflurane | 20 | 5.60 ± 0.31 | 0.00 | 5.59 ± 0.08 |
| 25 | 5.51 ± 0.45 | 0.05 | 5.85 ± 0.24 | |
| 30 | 5.12 ± 0.31 | 0.10 | 5.60 ± 0.30 | |
| 0.30 | 5.74 ± 0.23 | |||
| 0.50 | 5.83 ± 0.24 | |||
| 2-Chlorophenol | 20 | 6.57 ± 0.42 | 0.00 | 5.88 ± 0.12 |
| 25 | 6.86 ± 0.22 | 0.05 | 6.89 ± 0.27 | |
| 30 | 6.77 ± 0.47 | 0.10 | 6.81 ± 0.21 | |
| 0.30 | 6.86 ± 0.29 | |||
| 0.50 | 7.03 ± 0.37 | |||
| Cholorobenzene | 20 | 7.54 ± 0.61 | 0.00 | 6.35 ± 0.23 |
| 25 | 7.10 ± 0.41 | 0.05 | 7.07 ± 0.53 | |
| 30 | 7.81 ± 0.52 | 0.10 | 7.08 ± 0.41 | |
| 0.30 | 7.28 ± 0.43 | |||
| 0.50 | 7.50 ± 0.52 | |||
| Chloroform | 20 | 5.85 ± 0.44 | 0.00 | 6.23 ± 0.15 |
| 25 | 6.71 ± 0.33 | 0.05 | 6.97 ± 0. 50 | |
| 30 | 7.11 ± 0.52 | 0.10 | 6.77 ± 0.28 | |
| 0.30 | 7.02 ± 0.22 | |||
| 0.50 | 6.84 ± 0.35 | |||
| Carbon Tetrachloride | 20 | 6.29 ± 0.35 | 0.00 | 6.04 ± 0.12 |
| 25 | 6.75 ± 0.29 | 0.05 | 6.93 ± 0.40 | |
| 30 | 6.90 ± 0.38 | 0.10 | 6.75 ± 0.41 | |
| 0.30 | 6.56 ± 0.38 | |||
| 0.50 | 6.83 ± 0.44 |
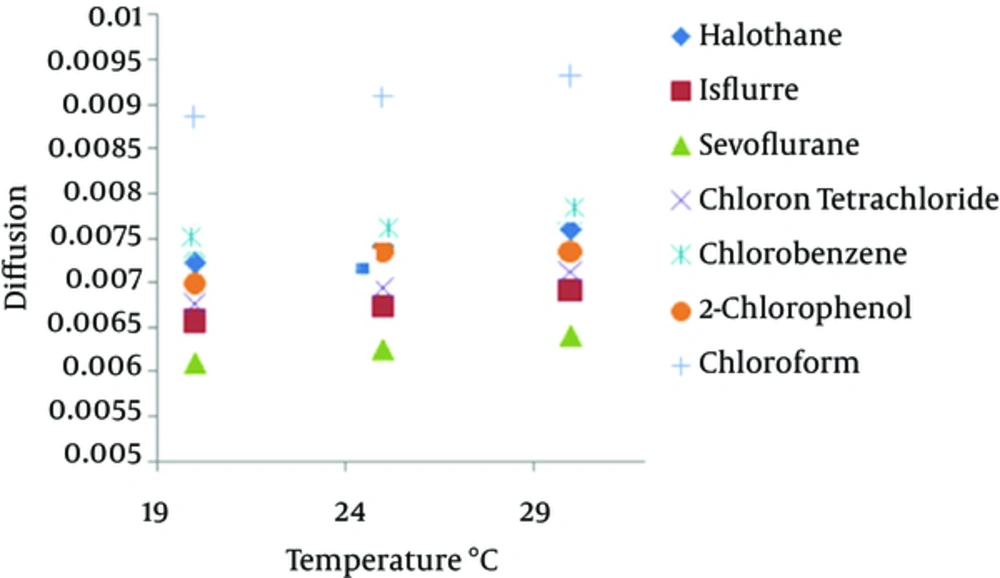
Figure 2.
The Relation of Temperature With Gas Diffusion of Halogenated Hydrocarbons
Effect of relative humidity on the sampling of halogenated hydrocarbons by SPME was studied at 30, 50, and 80 % at 25°C. At each level, three measurements were performed in 0.5 cm retracted mode at 50 ppmv for 30 minutes (Table 2). Data analysis showed that humidity has a significant negative effect on the mass adsorbed by sampler (P value < 0.05).
Table 2.
Effect of Humidity on CAR/PDMS Fiber Sampling Rate in 0.5-cm Retracted Mode (Sampling Rate Was Divided By 1000)
| Compounds | Humidity, % | Mean ± Standard Deviation | F | P Value |
|---|---|---|---|---|
| Halothane | 30 | 6.90 ± 0.38 | 55.30 | 0.001 |
| 50 | 5.11 ± 0.30 | |||
| 80 | 4.41 ± 0.18 | |||
| Isoflurane | 30 | 6.12 ± 0.29 | 13.11 | 0.006 |
| 50 | 5.42 ± 0.24 | |||
| 80 | 4.83 ± 0.29 | |||
| Sevoflurane | 30 | 5.71 ±0.27 | 29.04 | 0.001 |
| 50 | 4.41 ± 0.26 | |||
| 80 | 4.05 ± 0.24 | |||
| 2-Chlorophenol | 30 | 6.80 ± 0.52 | 18.08 | 0.003 |
| 50 | 5.90 ± 0.27 | |||
| 80 | 5.02 ± 0.23 | |||
| Cholorobenzene | 30 | 6.94 ± 0.53 | 18.10 | 0.003 |
| 50 | 6.07 ± 0.27 | |||
| 80 | 5.17 ± 0.23 | |||
| Chloroform | 30 | 6.72 ± 0.32 | 74.09 | 0.001 |
| 50 | 5.91 ± 0.13 | |||
| 80 | 4.10 ± 0.33 | |||
| Carbon Tetrachloride | 30 | 6.75 ± 0.26 | 6.10 | 0.036 |
| 50 | 6.21 ± 0.41 | |||
| 80 | 5.71 ± 0.40 |
In this study, the increase of humidity from 20 to 40% caused a 25% decrease in the mass of analyte adsorbed by SPME but an increase from 40% to 80% would lead only to a 12% decrease in mass adsorbance.
Figure 3 showed the effect of CAR-PDMS fiber under different linear velocities of halogenated hydrocarbons on sampling rate (cm3 min-1). ANOVA and Tukey’s test were used to examine the effect of velocity in the range of 0 (static condition) to 50 cm/s on sampling rate in a retracted mode. This velocity was chosen because air velocity in 85% of the workplaces is below 30 cm/s (14). The results showed that dynamic sampling with retracted SPME at different air velocities in the chamber does not have a significant effect on mass uptake (P > 0.05).
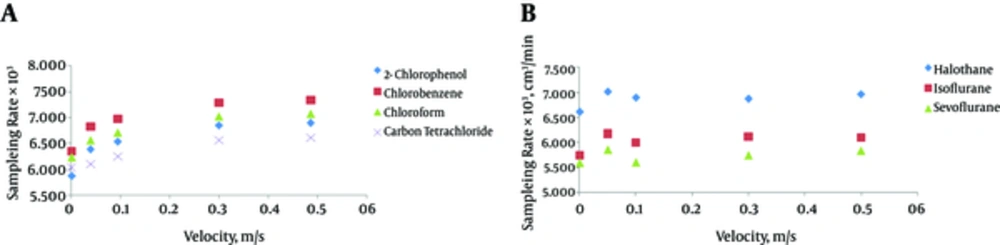
Figure 3.
Sampling Rate (cm3 min-1) of CAR-PDMS Fiber Under Different Linear Velocities for Halogenated Hydrocarbons
In order to investigate of effect of storage time and conditions on recovery using SPME, samples were taken at 25°C and 45 ± 5 %RH and stored in three locations: septum-capped glass at ambient temperature, septum-capped in closed glass tubes at 4°C, and without septum in ambient temperature. For each storage condition, two consecutive samples were obtained by the same SPME fiber. The first sample was analyzed with GC-MASS and other samples were analyzed after the storage time. The effect of storage time and conditions on the mass recovery at different condition showed in Figure 4. The halogenated hydrocarbons were lost after three days in samples storage condition without septum at ambient temperature and hydrocarbons slightly decreased in samples when stored with septum-capped in ambient conditions. The best results were reported for the capped SPME fibers in glass tubes which were stored in 4°C.
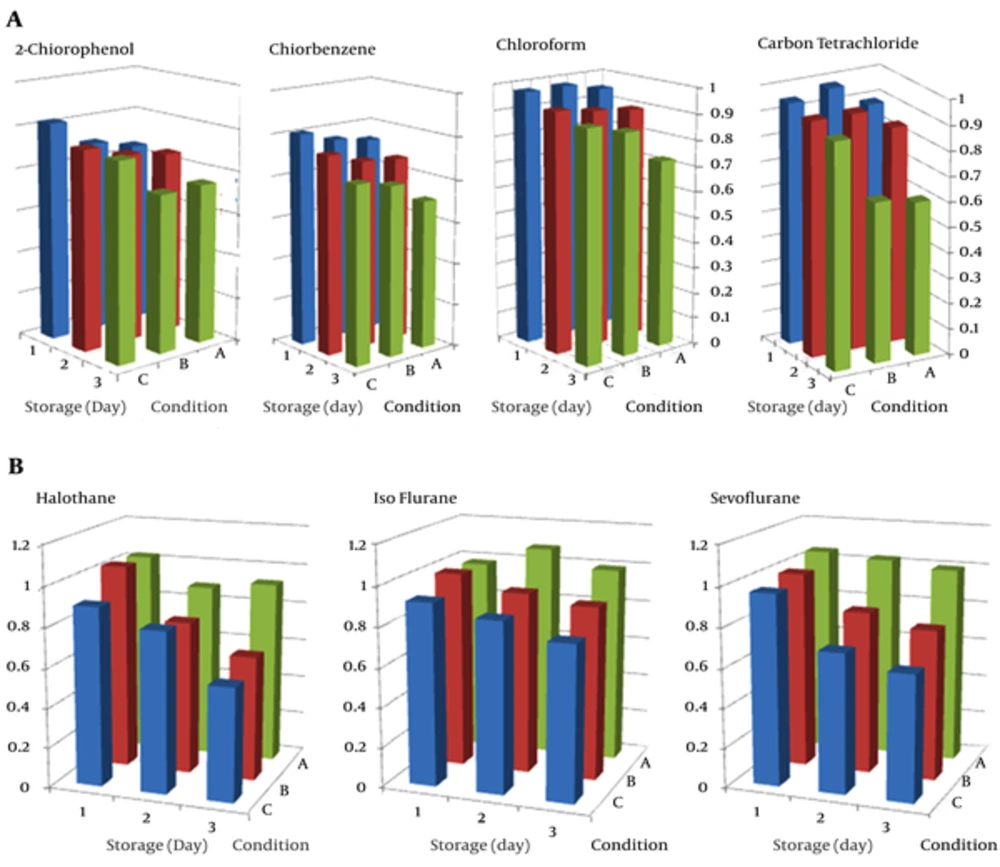
Figure 4.
A, septum capped in sealed glass tubes at 4°C; B, septum-capped in sealed glass tubes at ambient temperature C) without septum, in sealed glass tubes at ambient temperature.
4. Discussion
This study was undertaken to evaluate the effects of humidity, temperature and wind velocity on SPME sampling rate for some halogenated hydrocarbons. The results of current study showed the increment of 10°C temperature (from 20 to 30°C) has an effect on mass adsorbed by fibers but 5°C variation in temperature does not have a significant effect on the mass uptake. According to Equation 2, sampling rate is proportional to the diffusion coefficient and the diffusion coefficient (Equation 3) is proportional to the temperature by T1.085 therefore temperature variation in the range of 10°C leads to only a 4% variability in results (17) and the change of temperature in the range of 10°C does not seem to have a basic effect on the sampling rate of SPME sampler. However, temperature increase is favorable to gaseous diffusion but not to fiber extraction (adsorption is exothermic). It is important to calibrate SPME with real temperature and velocity in field in order to increase the sampling precision.
The results of this study showed that humidity has a negative effect on sampling rate. There is a contest of adsorption between the halogenated hydrocarbons and water molecules on CAR/PDMS. The effect of relative humidity on adsorption depends on the polarity and volatility of the analytes and the SPME coating (18). The sampling time affects the adsorption because more water molecules can be adsorbed when given more time. Some studies have reported that a more than 10% increment in relative humidity had a negative effect on the sampling capacity of SPME coatings (13, 19). Our data show that humidity increase from 20 to 40% has more effect on mass of analyte absorbed by SPME compared to high humidity. When humidity is low, many free sites are available on fibers and water molecules are more easily adsorbed by sampler but whenever the humidity increases under the same conditions most sites have already been occupied by water molecules and there is less tendency for further adsorption of water vapor (13, 19). This result is similar to a previous study that concluded that relative humidity in range of 0 to 92% has reduced the rate of sampling of amines in air in the range of 20 to 80 percent (20).
The results showed that dynamic sampling with retracted SPME at different air velocities in the chamber does not have a significant effect on mass uptake (P > 0.05). Some studies have reported on the effect of air velocity on the sampling property of passive samplers. Many of these studies have indicated that air velocity does not have a significant effect on passive samplers (5, 7-9). The effects of boundary layer on mass transfer are negligible in this process and the limiting step of the mass transfer is passive diffusion. In the retracted SPME, the effect of air velocity may be even smaller compared to that of other passive samplers because of the unique configuration and aspect ratio of SPME fiber.
The best condition for storage of samples is cap of SPME fibers in glass tubes and storage at 4°C in the refrigerator. Temperature is the most important parameter for loss of samples over storage, regardless of a septum. The results of storage from sampling and analysis of National institute of occupational safety and health (21) methods are better than those using SPME for sampling of halogenated hydrocarbons because samples can remain stable for up to 30 days (21). However, it seems that in most studies, samples can be stored for 1 to 2 weeks. This result is different from the findings of a previous study on the sampling of n-alkanes with CAR/PDMS as samples were stored for 2 weeks at room temperature (22). The interaction of analyte, fiber coating, and loading concentration may be the determinants in the storage ability of the specific fiber for the specific analyte.
The developed SPME sampler had good response in various environmental conditions in comparison with standard sorbent and solvent-based method. The SPME has high sensitivity, ability to pre-concentrate the analytes, and direct transfer of the analytes into the analytical instrument. SPME has some drawbacks, such as fiber fragility, which can cause fiber breakage from mechanical stress during the sample taking and sample delivery stages. However, there are also other influencing parameters that should be taken into consideration in further studies. In this study, the effect of other interfering chemicals has not been studied in the sorption kinetic of the sampler which can be investigated in the future.
4.1. Conclusions
Our data show that temperature variation in the range of 5°C with air velocity of 10% has no significant effect on sampling rates of SPME sampler. However, humidity was found to have a strong effect on mass uptake by sampler therefore the relative humidity in field applications, must be known to accurately quantify the intensity of exposure with halogenated hydrocarbons. The samples of SPME would be stored for three days at a temperature of 4°C in sealed septum-capped glass tubes which is the best storage condition.