1. Background
Air pollution is one of the main challenges in highly populated cities, which mainly originates from rapid and irregular urbanization and industrialization (1).
Heavy metals are one of the most important air pollutants facing humanity and other life forms in the ambient air. These are associated with some human health disorders and ecological problems. There are various anthropogenic sources and activities, which are responsible for releasing HMs into the atmosphere such as incomplete burning of multiple types of fuel in industrial activity, transportation and power plants. In contrast, transportation is recognized as the most important source of HMs in urban areas and has attracted increasing interest in this context (2-5).
Heavy metals are released into the urban atmosphere in the form of liquid and solid particulate matter (PM). The emitted PM has different sizes and is directly diffused into the ambient air (6). Moreover, some of the HMs is released in the fume phase related to the manufacturing processes and main fuel.
With respect to the above-mentioned points, it is important to measure and monitor HMs in the ambient air for control and management objectives. The trees that can be efficiently used as bio-monitors for atmospheric pollutants because of advantages such as simple sampling and examination are currently well established (7, 8). The other advantages of plants as a passive sampler for bio-monitoring aims are great spatial and temporal resolution due to better availability of vegetation and little sampling costs.
Several plant species, particularly evergreen trees, have been applied for atmospheric pollution monitoring and their benefits for this objective have been pointed out in the literature (9). In contrast to lower plants (fungi, algae, lichens or mosses), the trees that are not good indicators for bio-monitoring of atmospheric pollution are well-known (10-12). However, the main advantage of these trees, that has led to their selected as bio-indicators, is extensive dispersion in most cities as the main plant species. The other advantages of the tree are easy detection (13), and their long lifetime so that a replication of the examination is possible after a few years, while the time-trend distribution of pollutants can also be investigated (14).
In the recent years, there has been increasing interest in heavy metal monitoring in the atmospheric area using trees as bio-indicators.
Up to now, several trees have been used for HMs monitoring. The most popular trees used for this aim are Phoenix dactylifera (15, 16), Pinus sylvestris (17), Pinus pinea (18), Nerium oleander (19), Pittosporum tobira (20), Acacia retinodes, Eucalyptus torquata (21), Populus nigra (22), Tibouchina pulchra (23), and Cedrus libani (24). While some studies have been carried out on pine species as HMs bio-indicators, no studies have been reported for HMs monitoring in the urban atmosphere using Pinus eldarica specie.
2. Objectives
This study was therefore designed to assess the HMs concentration and their distribution pattern in the ambient air of Yazd city using Pinus eldarica as a local bio-indicator. For this aim, HMs concentration was measured in leaves of Pinus eldarica. In addition to the effect of meteorological conditions, traffic status and industrial activity on HMs pollution were investigated. Source identification was another objective of this study.
3. Methods
3.1. Study Area and Sampling Location
Yazd, the capital of Yazd province, is located in the center of Iran. The city has a total area of 2491 km2. It is located in the longitude of 54°36’ E, latitude of 31°88’ N, and altitude of about 1190 to 1300 meters above the sea level.
Yazd has dry periods during most months of the year and it is recognized as the driest city in Iran with an average annual rainfall of only 50 mm. On average, the warmest month is July with the maximum temperature of 33°C and the coolest month is January with the minimum temperature of 3°C. The annual mean temperature of the city is about 20.3°C. The annual mean relative humidity recorded in this city is 29%. The prevailing wind direction is west to north (25).
Forty-eight sampling locations were selected based on traffic status and land use in the study area. Selected locations were distributed uniformly throughout the city. Figure 1 shows the study area and sampling locations.
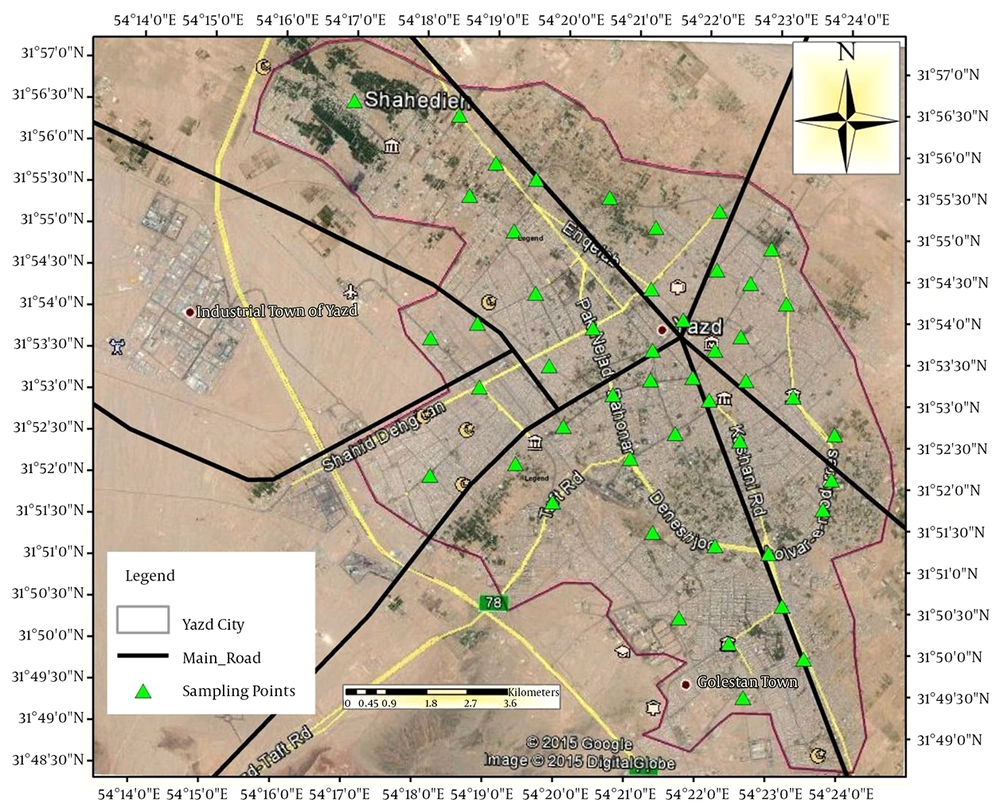
Figure 1.
Study Area and Sampling Locations
3.2. Bio-Indicator Selection, Sampling and Analyses
There are various tree species in Yazd city. However, one of the most abundant species is pine tree that can be seen throughout the city (26). Therefore, the Pinus eldarica, a species of pine tree, was selected as a bio-indicator to investigate HMs pollution of the urban atmosphere.
The trees in the main streets with 20 m distance from the traffic lights were selected for sampling. Samples were collected from different sides of same age trees (about 10 - 15 years old) at the heights of 1.5 to 2 m above ground level. The leaves with defects such as bird dropping, pesticide treatment, insect infestation, honeydew presence, chlorosis, necrosis, and unusual dust cover were avoided in the collection process. Further clean up steps were not conducted on taken leaves. The sampling process was conducted during late spring after a 10-day rainless period.
Sampling and analyzing were conducted in six steps, which can be listed as follows:
1- Sampling 50 g leaves from the tree in compliance with the conditions mentioned above.
2- Drying samples at laboratory temperature (about 25°C).
3- Extracting HMs based on acid digestion (27, 28), in which 1 g of dried leaves were added to 8 mL of concentrated HNO3 (Merck, 65%) and the mixture was left at laboratory temperature for one hour.
4- Placing the quartz tube containing mixture in the oven at 50°C for two hours and then at 160°C for four hours.
5- Filtering mixture through Whatman filters (0.48 µm) and diluting the final solutions to 50 mL with double de-ionized water.
6- Analyzing the final solution for HMs including zinc (Zn), copper (Cu), iron (Fe), lead (Pb) and cadmium (Cd) using graphite furnace varian spectra atomic absorption spectrometer (GF-AAS). For this aim, all standards and blanks were matrix-matched for the chemicals and reagents used in the sample preparation. For calibration of GF-AAS, standard solutions (0.001, 0.01, 0.1 and 1 mg/L for Zn, Cu, Pb, and Cd and 0.1, 1, 10, and 100 mg/L for Fe) were prepared from the stock solution by serial dilution. After this, the standard solutions were injected to GF-AAS through an auto sampler. Only the elements with given certified values and mean recoveries ranging from 80 to 120% were included in the data analysis. The detection limit for each element was considered as three times the standard deviation of eight replicate blank measurements.
3.3. Statistical Analysis and Spatial Mapping
The correlation between HMs concentrations in leaves were calculated using principal components analysis (PCA) and Spearman’s rank correlation coefficient.
In order to determine spatial distribution of heavy metal concentrations, the Kriging method in Arc GIS software version 10.1 was employed. Kriging is an advanced geostatistical method, by which the estimated surface is generated from a scattered set of points with z-values based on weighted moving average. The most important assumption with this method is that the distance or direction between sample points reflects a spatial correlation that can be used to explain variation in the surface. To determine the output value for each location, the Kriging tool fits a mathematical function to a specified number of points, or all points within a specified radius. The Kriging process involves the following steps: a) exploratory statistical analysis of the data, b) variogram modeling, c) creating the surface, and d) exploring a variance surface which is optional (29, 30). The estimator in the Kriging method is defined as follows (Equation 1):
Where the Z × (xi), λi and z (xi) are the estimation grade, weight or sample quantity dependent on i, and measured variable value, respectively.
4. Results
4.1. Heavy Metals Concentrations
Table 1 shows the summary statistics for HMs concentration. As can be seen from the table, the highest and lowest average concentrations belonged to Fe (345 mg/kg) and Cd (0.73 mg/kg), respectively. The average value of 26.1 mg/kg for Zn, 5.59 for Cu, and 2.99 mg/kg for Pb were obtained. The maximum concentration of Zn (49.1 mg/kg) and Cd (4.85 mg/kg) were observed in the sampling point near the airport, industrial area and main bus terminal. However, the maximum concentration of Cu (161mg/kg), Pb (22 mg/kg) and Fe (717 mg/kg) were recorded in heavy traffic areas.
Table 1.
Descriptive Statistics of Measured Heavy Metals in Pine Leaves (mg/kg)
| Minimum | Maximum | Mean | Std. Deviation | |
|---|---|---|---|---|
| Zn | 12.8 | 49.1 | 26.1 | 8.87 |
| Cu | 0.04 | 161 | 5.59 | 22.9 |
| Pb | 0.20 | 22 | 2.99 | 3.19 |
| Cd | 0.11 | 4.85 | 0.74 | 0.61 |
| Fe | 15.4 | 717 | 345 | 120 |
4.2. Source Identification
Table 2 shows the results obtained from the Spearman rank correlation analysis for HMs concentrations in different sampling locations. It is apparent from this table that correlations between HMs concentrations in sampling locations are very low (less than 0.475). These results suggest that sampling locations were impressed by different sources of contamination so that the tires and wheels of the automobiles are probably responsible for Zn, Cd and, Pb emissions while Fe and Cu are the main contaminants released from the corrosion process of automobiles and industry dumping areas.
Table 2.
Spearman Rank Correlations Between Measured Heavy Metal Concentrations in Pine Leaves (mg/kg)
| Zn | Cu | Pb | Cd | Fe | |
|---|---|---|---|---|---|
| Zn | 1.000 | ||||
| Cu | 0.475a | 1.000 | |||
| Pb | 0.204 | 0.166 | 1.000 | ||
| Cd | 0.331b | 0.417a | 0.152 | 1.000 | |
| Fe | 0.223 | 0.342b | 0.260 | 0.337b | 1.000 |
aCorrelation is significant at the 0.01 level.
bCorrelation is significant at the 0.05 level.
The US environmental protection agency (EPA) has suggested the principal component analysis (PCA) technique for source identification of HMs pollution. In this study, PCA with the varimax rotation method was used for the apportionment of the probable HMs sources in pine leaves, according to previous studies (31, 32). Table 3 provides the results obtained from the PCA analysis including loading factors with varimax rotation and also eigenvalues.
Table 3.
Principal Component Analysis Results of Heavy Metals Concentrations in Pine Leaves
| Element | Rotated Component Matrix | Communalities | ||
|---|---|---|---|---|
| 1 | 2 | 3 | ||
| zn | 0.512 | 0.620 | 0.075 | 0.652 |
| pb | 0.847 | -0.026 | -0.129 | 0.735 |
| cu | -0.106 | 0.913 | -0.025 | 0.845 |
| cd | -0.045 | -0.009 | 0.925 | 0.858 |
| fe | 0.538 | 0.062 | 0.425 | 0.474 |
| Initial Eigenvalues | 1.284 | 1.222 | 1.059 | |
| % of Variance | 25.671 | 24.437 | 21.184 | |
| %Cumulative | 25.671 | 50.108 | 71.292 | |
4.3. Spatial Distribution
Spatial distribution of HMs concentration is shown in Figure 2. From the figure, the maximum concentrations of Zn were observed in the center and north of the city, which are areas with heavy traffic. The maximum concentration of Cd and Pb were detected in areas near the airport and heavy traffic locations, respectively. The eastern areas of the city had maximum concentration of Fe, and also maximum concentration of Cu was observed in the south of the study area.
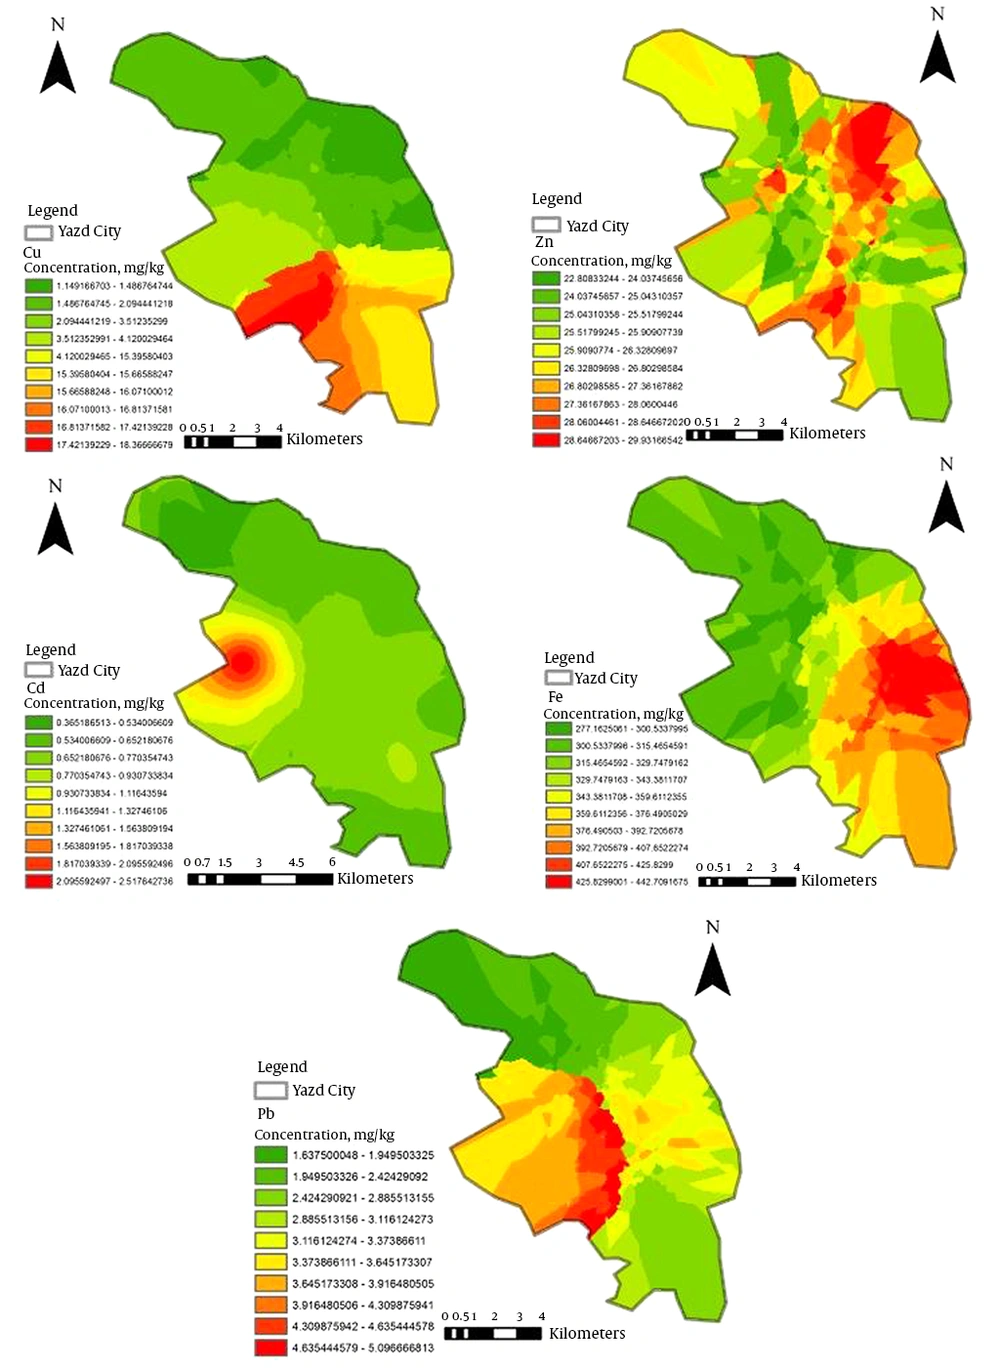
Figure 2.
Spatial Mapping of Heavy Metals Concentrations in Pine Leaves (mg/kg)
The spatial map for the total concentrations of HMs is shown in Figure 3. The maximum concentrations of HMs were observed in southern areas of the city. A possible explanation for these results may be the wind direction pattern, which is often from north to south and moves pollutants from northern to southern areas. The other significant result indicated by the figure is that the central areas of the city with heavy traffic have higher concentration of HMs in contrast to those with low traffic.
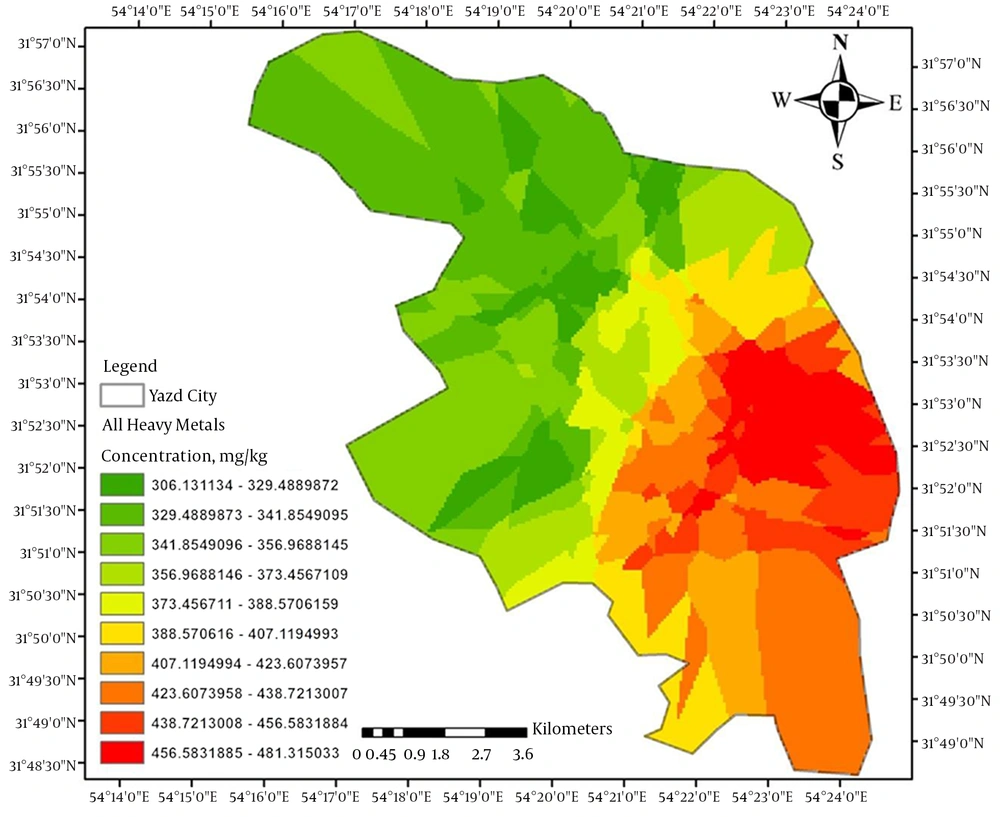
Figure 3.
Spatial Mapping of Total Heavy Metals Concentrations in Pine Leaves (mg/kg)
5. Discussion
The literature has emphasized on the importance of trees as bio-indicators for air pollution monitoring. The HMs concentrations in the tissue of the tree display contamination levels of the soil and air. Soil and air pollution with HMs is a major concern, particularly in highly populated cities. To date, there has been a dramatic increase in bio-monitoring of air quality using trees for detection purposes as well as for monitoring the effects of the pollutants (33, 34). Also, trees can efficiently trap air-born particles and have been identified as major contributing agents for the declining of respirable PM, which is considered as the potential cause of major health complications for the exposed population.
The most important criteria for selecting suitable tree species as bio-indicator for HMs can be listed as follows: a) it should be able to differentiate between soil borne and airborne HMs, b) be simple and cheap to sample, c) be present in large numbers throughout the monitoring area, and d) be accessible in a wide geographical range. Pine trees due to the greater ability to survive in Yazd city represent all these criteria and our research completely supports this view (35, 36).
The higher Fe and Zn concentrations in the study area may be due to the local geochemistry and industrial activity. Several studies have also reported that Fe and Zn concentrations are much more than other heavy metals in leafy trees located in the urban area (12, 26).
The normal range of the Cu concentration in trees is 5 to 30 mg/kg (37) and the results of this study showed that measured Cu concentrations in all sampling points, except one, were in the normal range.
Plant roots can uptake only very small amounts of Pb (12). It has been described that Pb cannot be absorbed from the soil by the leaves of the tree since Pb is a HM with little plant motion (38). It can be concluded that measured Pb in the leaf of the trees is mainly airborne Pb. The toxic range of Pb is different in various literature reports. For example, according to Kabata-Pendias (2010), this range is 30 to 300 mg/kg (37), while Markert (1994) considered 3 to 20 mg/kg as a toxic range (39). The normal range of Pb is 5 to 10 mg/kg (37). The concentration of Pb in the study area was higher than the normal range. The most likely causes of high Pb concentrations in the study area are old automobiles driven with leaded petrol, the combustion of the diesel oil, and the manufacturing and metallurgical processes.
Ferrous-steel industry is the major source of environmental Cd contamination. Furthermore, mineral oils, vehicle wheels and waste sludge usage may emit Cd into the air and soil, which can increase the level of Cd in trees (40). A small amount of Cd also originates from synthetic fertilizers. The results of the present study showed high Cd concentrations in industrial areas. These results further support this idea.
Table 4 shows the HMs concentration obtained in this study and other studies in which leafy trees have been used as bio-indicators for investigation of HMs pollution in urban areas. The concentrations obtained in this study are inconsistent with data obtained in previous studies. A possible explanation for this may be the difference in studied areas standpoint of meteorological conditions, traffic status, industrial activity and consumed fuel.
Table 4.
Concentration of Heavy Metals in Leaves of Different Species From Different Studies
| Location | Tree Species | Heavy Metals, mg/kg | Reference | ||||
|---|---|---|---|---|---|---|---|
| Zn | Cu | Pb | Cd | Fe | |||
| Iran | Pinus eldarica | 26.1 | 5.59 | 2.99 | 0.74 | 345 | Present study |
| Iran | Platanus orientalis L | 35 | 15.1 | 1.127 | - | 404 | Norouzi et al. (2015) (26) |
| Serbia and Montenegro | Aesculus hippocastanum | 9.95 | 2.96 | 1.07 | - | - | Tomasevic et al. (2005) (41) |
| Turkey | Robinia pseudo-acacia | 139 | 20.8 | 72.6 | 1.33 | 414 | Celik et al. (2005) (12) |
| Spain | Populus alba | 542 | 7.63 | 5.00 | 3.82 | 336 | Madejon et al. (2004) (42) |
| Japan | R. pulchrum | 63.4 | 7.15 | 0.6 | 1.24 | - | Suzuki et al. (2009) (43) |
In order to identify the probable source of HMs, Spearman rank correlation coefficient and PCA were employed (Tables 2 and 3). The results of these analyses showed that there were no strong correlations between HMs. The observed correlations are due to the difference between emission sources of HMs. In PCA, factor 1 was dominated by Pb, accounting for 25.67% of the total variance. As generally identified, the main release source of Pb is the leaded fuel incineration (44). Therefore, this factor emphasizes on anthropogenic activities such as industrial process and transportation as a probable emission source and is the same as the results reported in previous researches (45, 46).
The second factor contributes to 24.437% of the total variance and has high loadings for Cu and Zn. Zinc may be produced by mechanical abrasion of automobile (47), the motor vehicle tires, and lubricating oils (48). Brake dust is previously known as an important carrier for Cu in PM composition (49, 50). Copper is commonly used in brakes to control heat transfer (51). Therefore, based on factor 2, the atmospheric concentrations of HMs are also from road traffic (50, 52).
In factor 3, Cd had a high loading of 0.925 and 21.174% of the total variance in contrast to other HMs. The concentration of Cd may potentially be related to coal combustion and traffic sources in the urban atmosphere (53). Therefore, the results of factor 3 show that in addition to transportation, industrial activity can be a probable source of HMs.
Spatial distributions showed that HMs concentrations in the center (heavy traffic area) and south of the city are more than northern areas, while a large number of industries exist in the north of the city. Therefore, wind direction is one of the major parameters in transporting PM and HMs from north (industrial area) to the south of the study area.
5.1. Conclusion
The leaves of pine trees were found to be a good bio-indicator for Zn, Cu, Pb, Cd and Fe contamination in the ambient air of the study area. The samples obtained from heavy traffic and industrial areas had maximum concentration of HMs due to greater human activity. This study showed that manufacturing and transportation are the main sources of HMs pollution. Also, wind direction was identified as the most important meteorological factor affecting HMs transport. More studies are required in order to use other local trees as bio-indictors for HMs and other air born pollutants in the studied and other regions.