
1. Background
Respiratory protection is one of the key non - pharmaceutical interventions for protection of HCWs against the respiratory hazards of workplace when engineering controls or administrative measures are insufficient or unavailable for controlling exposures to hazardous airborne contaminants (1-3). There are various types of respiratory protection equipment (RPE), which could be used by health care workers (HCWs) (4-6). Amongst different types of RPE, N95/FFP2 is the most widely used respirators in health care centers (7).
The protective effect of N95 FFP2 mainly depends on the filter penetration and how it fits on the face (7). Respirators should have the ability to fit on different shapes to prevent the leakage of pollutants (4), and effectively protect the user (8). A study conducted by the Center for Disease Control and Prevention showed that the average penetration of infection aerosols in poorly fitted respirators is 33% compared to 4% in tight fitted ones (9).
To be sure about tight fitting respirators, fit test must be performed on users while they are wearing a model and size of respirator that they will be using at the job (10). There are two types of fit test: qualitative and quantitative. Qualitative fit testing is a pass/fail test method that uses sense of taste or smell, or reaction to an irritant such as bitrex (Denatonium Benzoate) in order to detect leakage into the respirator. There are four qualitative fit test methods accepted by OSHA such as Isoamyl acetate, Saccharin, Bitrex, and Irritant smoke (11). Quantitative fit testing does not rely upon the users sense of taste, smell, or irritation and in this method the actual amount of leakage into the face piece was measured by machine (11).
The fit test results are affected by different factors including face shape and anthropometric dimensions, large weight gain or loss, major dental work, facial surgery, a facial scar, and hair growth, such as a beard or sideburns (12). Studies have shown that the shape and dimensions of face could be different in different ethnic groups. For example, while Koreans face length is similar to that of white Americans and Australians, their face width is larger (13-15). Kim et al., showed a significant difference in results of fit testing among imported and domestic respirators due to differences in anthropometric dimensions (16).
Respirator fit test panels provides an objective tool for selecting representative human test subjects based on their facial characteristics for use in research, product development, testing and certification. (17). One of these panels is NIOSH Bivariate fit test panel, which is defined based on face length (Menton - sellion length) and width (Bizygomatic breadth) and is used in design of half face respirators (18). This panel covers 96.7% of males and 98.7% of females and its length and width of face is limited to 98.5 to 138.5 mm and 120.5 to 158.5, respectively (19).
Fit testing is not mandatory according to Iran occupational health regulations. Therefore, HCWs are not sure if their respirator is appropriate for their face. Meanwhile, nearly all N95/FFP2 respirators used by HCWs are imported from foreign countries, which may not be necessarily designed based on Iranian face anthropometric dimensions. Moreover, only one size of respirator (medium) is provided for HCWs, regardless of the user’s face size and shape. The aim of this study was to assess how many HCWs passes the qualitative fit test successfully while wearing medium size N95/FFP2 respirator.
2. Methods
This cross - sectional study was carried out on 284 HCWs in six hospitals affiliated to Shiraz University of Medical Sciences. Participants were wearing 3 different types of N95/FFP2 medium size respirators including; flat - fold FFP2 (3M - model; 8222 and SPC - model;8226) and cup - shaped N95 (3M - model;8210). Initially, according to the Occupational Safety and Health Administration (OSHA) respiratory protection standard (29 CFR 1910.134), the medical evaluation questionnaire was completed for all studied HCWs to evaluate all the individuals who are not medically competent for using respirator (20). Then, HCWs were fit tested qualitatively according to OSHA protocols (21) instructions of manufacturer’s fit test kit (JSP, UK). For this purpose, firstly we trained the participants about the fit test objectives and stages. In the second step, sensitivity test was conducted to exclude the individuals who were not sensitive to bitter tastes. In the third step, participants were trained on how to properly wear the respirator and also how to conduct the seal checks to ensure the placement of respirator on the face. Finally the fit test was conducted. Critical dimensions in the design the half face respirators including face length (Menton - sellion length) and width (Bizygomatic breadth) (Figure 1) were measured using anthropometric sliding caliper to study their relationship with fit test results and also its compliance with NIOSH Bivariate fit test panel. In the NIOSH Bivariate fit test panel individuals were categorized in three groups of small (1 - 3 cells), medium (4 - 7 cells), and large (8 - 10 cells) based on facial dimensions (Figure 2). If the length and width were laid on the borders of panel, the person was placed inside the cells with a higher number and larger facial dimensions (19).
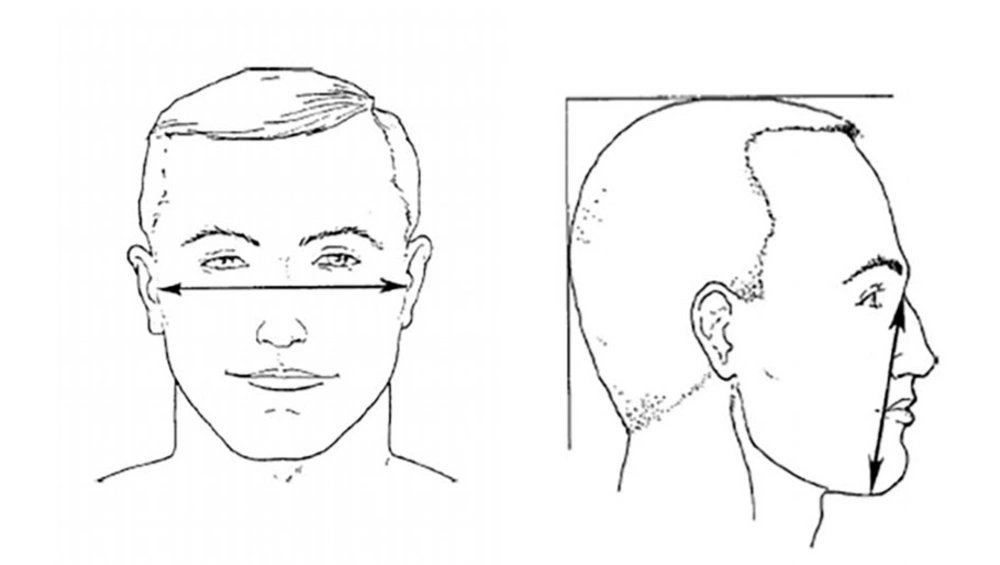
Figure 1.
Critical Anthropometric Dimensions in Designing Half Face Respirator (Face Length and Width)
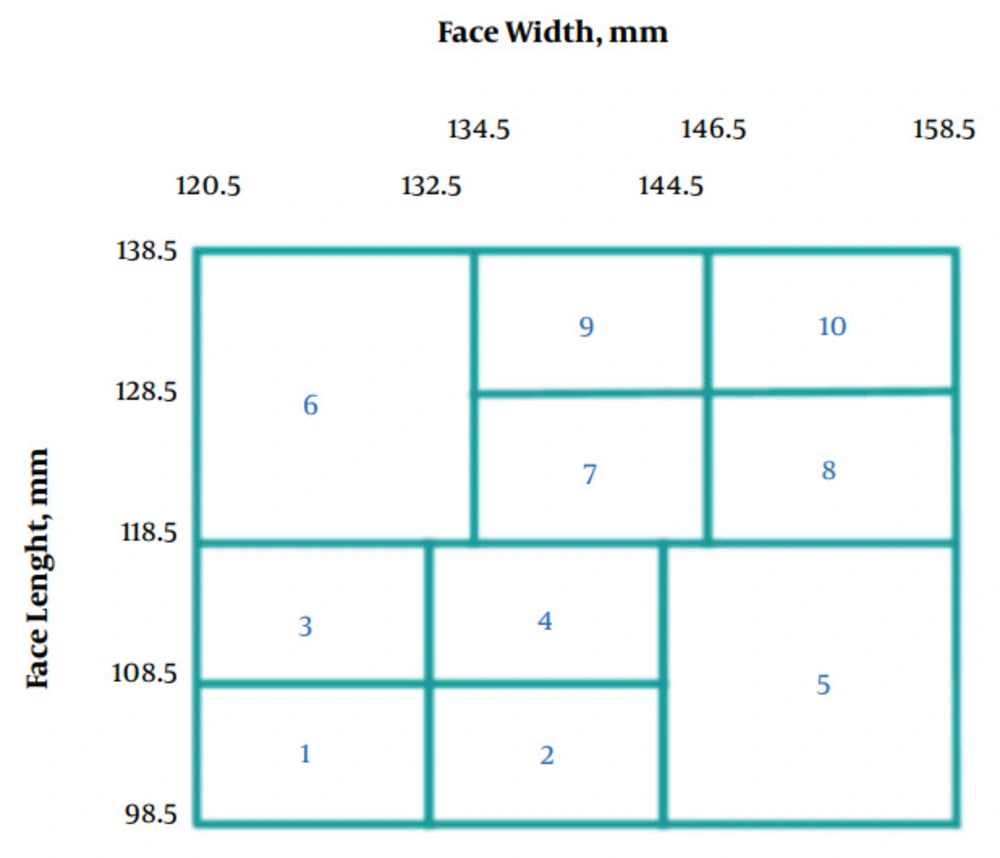
Figure 2.
NIOSH Bivariate Fit Test Panel Based on Face Length and Width for Half Face Respirator (19)
3. Results
The majority of studied subjects were females (66.5%) and nurses (65.8%). The average duration for using the respirator was less than 2 hours a day (60.6%). A total of 10.2% of all individuals who were using N95 respirators were not medically competent for using respirator, according to OSHA medical evaluation questionnaire. In addition, the majority of the subjects (78.52%) were outside the NIOSH Bivariate fit test panel range (Table 1).
Table 1.
Summary Statistics
| Variable | N (%) |
|---|---|
| Demographic characteristics | |
| Sex | |
| Male | 95 (33.5) |
| Female | 189 (66.5) |
| Job | |
| Doctor | 15 (5.3) |
| Nurse | 187 (65.8) |
| Janitor | 82 (28.9) |
| Duration of using respirators | |
| Less than 5 hr/week | 54 (19) |
| Less than 2 hr/week | 172 (60.6) |
| 2 to 4 hr/day | 29 (10.2) |
| More than 4 hr/day | 29 (10.2) |
| Medically competence for wearing respirator | |
| Yes | 255 (89.8) |
| No | 29 (10.2) |
| Respirators data | |
| N95/FFP2 respirator model | |
| FFP2 Flat - fold (SPC - 8226) | 38 (13.38) |
| FFP2 Flat - fold (3M - 8222) | 126 (44.36) |
| N95 Cup (3M - 8210) | 120 (42.25) |
| Respirator application | |
| During care for patients with infectious diseases | 220 (77.5) |
| Chemical handling | 104 (36.6) |
| During work with dangerous drugs (Chemotherapy, hormone, …) | 29 (10.2) |
| During the process that produced the disease aerosols such as bronchoscopy | 19 (6.7) |
| In operating room or sterile room | 30 (10.6) |
| Anthropometric dimensions data | |
| Face size according to NIOSH Bivariate fit test panel | |
| Small | 25 (8.80) |
| Medium | 35 (12.32) |
| Large | 1 (0.35) |
| Out of range | 223 (78.52) |
In this study, only 10.6% of HCWs passed the fit test and the respirator fitted males better than females (18.9% vs. 6.3%).
As can be seen in Table 2, there is a significant relationship between different models and shapes of respirators with fit testing results (P < 0.001). Most individuals who passed the fit test were using a Cup - shaped respirator (Model 8210).
Table 2.
The Relationship between Fit Test and Different Models and Shapes of Respiratorsa
| Fit Test | Type of Respirator | P Value | ||
|---|---|---|---|---|
| Cup, 8210, N (%) (N = 120) | Flat - fold, 8222, N (%) (N = 126) | Flat - fold, 8226, N (%) (N = 38) | ||
| Passed (N = 30) | 24 (20) | 6 (4.8) | 0 (0) | < 0.001b |
| Failed (N = 254) | 96 (80) | 120 (95.2) | 38 (100) | |
aChi - Square Test.
bSignificant relationship.
The chance of failing in the fit testing of cup-shaped respirator (Model; 8210) was 75% less than flat - fold respirators (model; 8222 and 8226) (P value < 0.001, OR = 0.15, CI (0.06 - 0.38)).
As shown in Table 3, most of the studied subjects were not in the range of size classes in the NIOSH Bivariate fit test panel. However, there was no significant relationship between the results of fit testing and size classes of NIOSH Bivariate fit test panel.
Table 3.
The Relationship between Fit Test Results and Size Classes in NIOSH Bivariate Fit Testa
| Fit Test | NIOSH Bivariate Fit Test Panel | P Value | |||
|---|---|---|---|---|---|
| Small, N (%) | Medium, N (%) | Large, N (%) | Out of Range, N (%) | ||
| Passed (N = 30) | 2 (6.7) | 3 (10) | 0 (0) | 25 (83.3) | 0.910 |
| Failed (N = 254) | 23 (9.1) | 32 (12.6) | 1 (0.4) | 198 (88.8) | |
aChi - Square Test.
Table 4 compares the critical face dimensions in face piece design between Iranians (this study), South Africans, Koreans, and Americans. As shown, Iranians have a smaller face length and width.
Table 4.
Comparison of Critical Facial Dimensions in Face Piece Design Different Countriesa
| Face Dimensions (mm), Mean ± SD | Iranian (This Study), Male (N = 95), Female (N = 189) | South African- Spies et al.,2011 (22), Male (N = 14), Female (N = 15) | Korean - Kim et al., 2003 (16), Male (N = 70), Female (N = 40) | American - Oestenstad and Perkins, 1992 (23), Male (N = 38), Female (N = 30) | P Valueb |
|---|---|---|---|---|---|
| Face length | |||||
| Male | 105.26 ± 8.73 | 117.9 ± 8.3 | 120.6 ± 5.9 | 126 ± 7 | 1) P < 0.001c |
| 2) P < 0.001c | |||||
| 3) P < 0.001c | |||||
| Female | 100.05 ± 9.91 | 111.7 ± 6.6 | 109.6 ± 4.2 | 118 ± 5 | 1) P < 0.001c |
| 2) P < 0.001c | |||||
| 3) P < 0.001c | |||||
| Face width | |||||
| Male | 119.36 ± 12.36 | 150.3 ± 6.6 | 147.6 ± 5 | 139 ± 8 | 1) P < 0.001c |
| 2) P < 0.001c | |||||
| 3) P < 0.001c | |||||
| Female | 117.40 ± 11.01 | 141.9 ± 7.9 | 136.6 ± 4.9 | 129 ± 6 | 1) P < 0.001c |
| 2) P < 0.001c | |||||
| 3) P < 0.001c |
aMann - Whitney Test.
b1) Iranian vs. South African, 2) Iranian vs. Korean, 3) Iranian vs. American.
cSignificant relationship.
4. Discussion
The aim of this study was to conduct fit testing of medium size of N95/FFP2 respirators on HCWs in hospitals.
A small number (10.6%) of the subjects, who were using the N95/FFP2 respirators, passed the fit test. Findings in this study can be compared with the study of Spies (13.8%) (22) and Derrick et al., (55-69%) (24). Failure in fit test was probably due to the fact that the studied respirators were not manufacture according to anthropometric dimensions of Iranians who have smaller face length and width (Table 4).
In this study, respirators fitted better on male subjects. This result is consistent with other studies (16, 25, 26), which was conducted to show the effect of gender on facial characteristics and respirator fit.
In this study, most of the people who passed the fit test were using the cup - shaped respirators (model; 8210). This indicates that this respirator is probably more suitable for Iranians than the other two models. However, even this type of respirator could not provide a complete fit and it could only fit completely in 20% of the studied population. There was a significant relationship between the different models and shapes of respirators with fit test results. This finding is consistent with the study of Jahangiri et al., (27) and Kim et al., (16), however, it is in contrast with the study of Lam et al., (25). The high failing rate in fit test results, especially in Iran where respiratory fit testing is not mandatory, is more important, since it could endanger the HCWs at risk of containments leakage in the respirator face piece.
This study also showed that Iranians had significantly smaller facial dimensions compared to other studied ethnic groups (16, 22, 23). In the study of Yang et al., to see the applicability of American fit test panel for Chinese population, 12-35% of the subjects were outside the range derived from American Respirator Fit Test Panels (RFTPs) as Chinese subjects had generally shorter and wider facial characteristics (28). In this study, the majority of the subjects (78.5%) were outside the size classes of NIOSH Bivariate fit test panel, indicating that this panel is not applicable for the Iranian population. This result is consistent with other studies conducted about applicability of NIOSH Bivariate fit test panel in China (28) and Africa (22).
4.1. Limitations
In this study, only medium - sized respirators were fit tested due to the fact that in nearly all hospitals, large and small size respirators were not available. Therefore, more studies with different types and size of respirators should be conducted. Moreover, NIOSH Bivariate fit test panel was used in this study to determine the facial size of the individuals, which may not be completely suitable for Iranians.
4.2. Conclusion
The studied medium size of N95/FFP2 respirators could not provide adequate fitting on the face of Iranian HCWs. Designing the respirators based on Iranian anthropometric data might be helpful in providing complete fit around user’s face.
More studies with different sizes and models of available respirators in Iran market is required to find the most appropriate respirators to provide adequate fit on Iranian HCWs.