
1. Background
Acute pancreatitis (AP) is one of the most common acute abdominal diseases, and about 20% of the AP patients can develop severe acute pancreatitis (SAP) (1). According to the revision of Atlanta consensus (Atlanta 2012), the clinical manifestation of SAP is the functional failure of one or more organs for more than 48 hours (2). The mortality rate of pancreatitis patients with persistent organ failure, especially those infected with concurrent or secondary pancreatic necrosis, is remarkably higher (3).
The dynamic course of SAP is usually divided into the early and late stages; however, the time boundary between the two stages has distinct individualized characteristics. The early stage of most SAP cases represents about a week after the onset of the disease, and the late stage can last for weeks or even months. In the early stages, organ dysfunction results from host response to local pancreatic injury. Pancreatic inflammation activates a cytokine cascade, which is clinically manifested as a systemic inflammatory response syndrome (SIRS). In this regard, persistent SIRS is associated with an increased risk of organ failure. The major determinants of the severity of early-stage AP are the occurrence and duration of organ failure. In addition to the sequential failure of multiple organs, the common complications in the early stage of SAP include abdominal hypertension/abdominal compartment syndrome and secondary infection.
More importantly, SAP can progress to severe SIRS and multiple organ dysfunction (MODS) within 1 ~ 2 days of onset if no effective, timely intervention is proposed. About 30% of the SAP patients died in the first week of onset due to multiple organ/multiple system failures (2). The early assessment of factors leading to SAP-related death can contribute to the provision of timely and correct intervention, thereby improving prognosis and reducing mortality rates, especially on the admission day (4-6). To this end, we analyzed the clinical data of the SAP patients retrospectively to detect markers for early prognosis prediction.
2. Methods
2.1. Patients and Intervention
The clinical data were collected from 234 SAP patients admitted to the Department of Intensive Medicine of the Second Affiliated Hospital of Anhui University of Medical Sciences from January 2013 to December 2020 and then analyzed retrospectively. All patients were treated and cared for by the same medical team. The routine treatment regimen included fasting, gastrointestinal decompression, fluid resuscitation, water, and electrolyte balance maintenance, organ function support, intestinal dredging, nutritional support, and other strategies.
2.2. Inclusion and Exclusion Criteria
The inclusion criteria were as follows: (1) admission within 72 hours of onset; and (2) aged 18 years or above. The exclusion criteria were: (1) pregnancy complicated with SAP; (2) traumatic SAP; (3) SAP complicated with malignancy; and (4) transfer to another hospital in the middle of the treatment.
2.3. Diagnostic Criteria
The AP diagnosis of acute pancreatitis was performed according to the following points: (1) abdominal pain associated with AP; (2) serum lipase activity (or amylase activity) at least three times higher than the upper limit of normal; and (3) characteristic features of AP observed on contrast-enhanced computed tomography (CECT) (7). The SAP patients were classified in terms of disease severity according to the Revision of Atlanta consensus (Atlanta 2012) (7).
2.4. Data Extraction
All patients were divided into the death and survival groups according to their prognosis. The patients’ general medical data (e.g., gender, age, AP etiology, comorbidities, recurrent pancreatitis, ICU admission within 24 hours of onset, etc.), laboratory indices when they were transferred to ICU (e.g., serum amylase, PCT, D-dimer, Cr, Glu, PaO2, etc.), disease severity scores during the ICU admission (namely APACHE II and SOFA scores), organ dysfunction (i.e., ARDS, renal insufficiency, liver insufficiency, cardiac insufficiency) and other effective factors were then extracted. The intervention measures, including hormone usage, vasoactive drugs, continuous renal replacement therapy (CRRT), invasive mechanical ventilation, red blood cell transfusion, APD, and necrotic tissue removal, were performed during a week. Further, the complications, including abdominal infection, septic shock, abdominal bleeding, gastrointestinal bleeding, and intestinal fistula and prognosis factors (namely hospitalization time, ICU stay, hospitalization expenses) were reviewed. The clinical characteristics of the death group were also observed.
2.5. Ethical Considerations
This retrospective non-interventional study was approved and granted a waiver of written informed consent by the Ethics Committee of the Second Affiliated Hospital of Anhui University of Medical Sciences. Moreover, the study observed the guidelines noted in the Helsinki Declaration.
2.6. Statistical Analysis
SPSS software version 20.0 was used for statistical analysis. The measurement data with normal distribution were expressed as mean ± SD, and the difference between the two groups was analyzed by t-test. On the other hand, the measurement data with non-normal distribution were presented as median (quartile) [M (IQR)] and compared using the Mann-Whitney U test. Frequency (percentage) was also used for the nominal data, and the chi-squared test or Fisher’s exact probability method was used to analyze such data. Factors being significantly associated with SAP-related death were determined by the univariate analysis, and P < 0.05 was set as the significance level. According to the univariate analysis results and professional knowledge, possible prognostic factors were included in the multivariate logistic regression analysis. The LR model was developed, and the regression equation was as follows:
Where, P is the probability of the poor prognosis for patients, and Y is the prognostic index. The prediction efficacy of the model was analyzed by ROC. Moreover, AUC and 95% confidence interval (95% CI) were considered to evaluate the predicted value of each index.
3. Results
3.1. Patient Characteristics
The clinical data were collected from 234 SAP patients, including 206 persons in the survival group and 28 death cases (those who died during hospitalization or were discharged when death was inevitable). There were 130 males and 104 females with the mean age of 52.35 ± 17.64 years (18 - 91 years). The total mortality rate in our cohort was 11.96% (95% CI, 8.1 - 16.8%), and the dead patients included 23 males (9.83%) and 5 females (2.13%). The main etiological types of SAP were gallstone (48.29%) and Hyper-triglyceridemia (30.77%), with mortality rates of 9.73% and 13.88%, respectively. There were 18 patients with recurrent pancreatitis, accounting for 7.69% of the cohort. Furthermore, there were 121 patients (51.71%) admitted to ICU within 24 hours of onset, of whom 5 persons died (2.13%), and 116 cases survived (49.57%). Finally, 23 cases (9.83%) underwent necrotic tissue removal.
3.2. Comparison of Clinicopathological Data Between Death and Survival Groups
There were significant differences between the two groups regarding the participants’ demographic and clinical information (namely gender, age, and ICU admission within 24 hours of onset) and the disease severity scores (namely APACHE II and SOFA scores) (Table 1; P < 0.05).
Table 1.
Comparison of Clinicopathological Data Between the Death and Survival Groups a
| Variables | Death Group (n = 28) | Survival Group (n = 206) | P-Value b |
|---|---|---|---|
| Gender | 0.003 c | ||
| Male | 23 (82.14) | 107 (51.94) | |
| Female | 5 (17.86) | 99 (48.06) | |
| Age (y) | 58.64 ± 14.83 | 51.44 ± 17.95 | 0.044 c |
| Etiology of AP | 0.783 | ||
| Gallstone | 11 (39.28) | 102 (49.51) | |
| Hyper-triglyceridemia | 10 (35.71) | 62 (30.09%) | |
| Alcoholic | 1 (3.57) | 5 (2.42) | |
| Miscellaneous | 6 (21.42) | 37 (17.96) | |
| Recurrent pancreatitis | 4 (14.28) | 14 (6.79) | 0.309 |
| ICU admission within 24 hours of onset | 5 (17.85) | 116 (56.31) | 0.000 c |
| Comorbidities | |||
| Hypertension | 8 (28.57) | 34 (18.37) | 0.119 |
| Diabetes mellitus | 5 (17.85) | 39 (18.93) | 0.891 |
| Autoimmune diseases | 1 (3.57) | 3 (1.46) | 0.433 |
| CHD | 3 (10.71) | 8 (4.32) | 0.260 |
| Fatty liver | 1 (3.57) | 23 (12.43) | 0.362 |
| COPD | 0 | 4 (1.94) | 1.000 |
| APACHE II score | 19.46 ± 8.64 | 13.22 ± 5.80 | 0.001 c |
| SOFA score | 9.00 [6.50] | 5.00 [4.00] | 0.000 c |
Abbreviations: COPD, chronic obstructive pulmonary disease; CHD, coronary heart disease; APACHE II, acute physiological and chronic health assessment II; SOFA, and sequential organ failure assessment.
a Values are expressed as mean ± SD, No. (%) or median [interquartile range].
b P-values are computed by χ2 test, t-test, and Mann-Whitney U test.
c Indicates the comparison between the death and survival groups at P < 0.05, suggesting a statistically significant difference.
3.3. Comparison of Laboratory Indices Between Death and Survival Groups Regarding ICU Admission
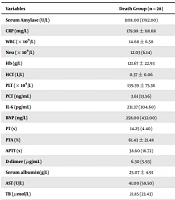
There were significant differences between the two groups regarding the laboratory indices (namely serum amylase, BNP, PTA, APTT, D-dimer, serum albumin, BUN, Cr, TC, and PaO2) during the ICU admission (P < 0.05; Table 2).
Table 2.
Comparison of Laboratory Indices Between Death and Survival Groups Regarding ICU Admission a
| Variables | Death Group (n = 28) | Survival Group (n = 206) | P-Value b |
|---|---|---|---|
| Serum Amylase (U/L) | 1108.00 (1782.00) | 558.00 (1232.50) | 0.015 |
| CRP (mg/L) | 179.98 ± 118.68 | 200.25 ± 150.57 | 0.521 |
| WBC (× 109/L) | 14.68 ± 6.58 | 13.84 ± 6.61 | 0.532 |
| Neu (× 109/L) | 12.03 (6.14) | 12.18 (7.47) | 0.888 |
| Hb (g/L) | 121.67 ± 22.93 | 133.74 ± 33.34 | 0.065 |
| HCT (L/L) | 0.37 ± 0.06 | 0.39 ± 0.08 | 0.122 |
| PLT (× 109/L) | 139.39 ± 75.38 | 176.50 ± 96.57 | 0.052 |
| PCT (ng/mL) | 3.61 (13.56) | 1.88 (5.76) | 0.066 |
| IL-6 (pg/mL) | 231.37 (304.60) | 167.85 (417.48) | 0.075 |
| BNP (ng/L) | 258.00 (432.00) | 133.00 (318.50) | 0.048 |
| PT (s) | 14.25 (4.40) | 12.80 (2.85) | 0.051 |
| PTA (%) | 61.43 ± 21.48 | 76.48 ± 25.32 | 0.003 |
| APTT (s) | 38.60 (16.72) | 31.65 (12.25) | 0.000 |
| D-dimer (μg/mL) | 6.30 (5.93) | 4.03 (4.92) | 0.031 |
| Serum albumin(g/L) | 25.07 ± 4.91 | 29.54 ± 6.91 | 0.000 |
| AST (U/L) | 41.00 (58.50) | 47.00 (87.50) | 0.969 |
| TB (μmol/L) | 21.85 (23.43) | 21.50 (22.55) | 0.671 |
| DB (μmol/L) | 8.80 (13.00) | 6.70 (11.50) | 0.093 |
| BUN (mmol/L) | 12.07 (17.97) | 6.90 (6.07) | 0.000 |
| Cr (μmol/L) | 252.00 (260.00) | 95.00 (84.50) | 0.000 |
| TG (mmol/L) | 1.41 (1.04) | 2.10 (5.90) | 0.098 |
| TC (mmol/L) | 2.51 (2.31) | 4.13 (2.92) | 0.000 |
| Glu (mmol/L) | 11.30 (5.19) | 8.90 (6.93) | 0.252 |
| Ca (mmol/L) | 1.91 (0.38) | 1.88 (0.40) | 0.950 |
| PaO2 (mmHg) | 61.00 (21.75) | 89.00 (48.80) | 0.000 |
Abbreviations: CRP, C-reactive protein; WBC, white blood cells count; Neu, absolute counts of neutrophils; Hb, hemoglobin; HCT, hematocrit; PLT, platelet count; PCT, procalcitonin; IL-6, Interleukin-6; BNP, atrial brain natriuretic peptide; PT, prothrombin time; PTA, prothrombin activity; APTT, activated partial thrombin time; AST, aspartate aminotransferase; TB, total bilirubin; DB, direct bilirubin; BUN, blood urea nitrogen; Cr, blood creatinine; TG, triglycerides; TC, total cholesterol; Glu, blood glucose; Ca, blood calcium; and PaO2, oxygen the partial pressure of blood vessels.
a Values are expressed as mean ± SD or median (interquartile range).
b P-values are computed by t-test and Mann-Whitney U test.
3.4. Comparison of Organ Dysfunction, Intervention Measures, Complications, and Prognosis Between Death and Survival Groups
There were significant differences between the two groups regarding organ dysfunction (i.e., ARDS, renal insufficiency, and cardiac insufficiency), one-week intervention measures (namely hormone usage, vasoactive drugs, invasive mechanical ventilation, red blood cell transfusion, CRRT, and APD), complications (e.g., abdominal infection, septic shock, abdominal bleeding, and gastrointestinal bleeding), prognosis factors (namely hospitalization time, ICU stay, hospitalization expenses), and other indices (P < 0.05; Table 3).
Table 3.
Comparison of Organ Dysfunction, Intervention Measures, Complications and Prognosis Between Death and Survival Groups a
| Variables | Death Group (n = 28) | Survival Group (n = 206) | P-Value b |
|---|---|---|---|
| Organ Dysfunction | |||
| ARDS | 20 (71.42) | 75 (36.40) | 0.001 |
| Renal insufficiency | 18 (64.28) | 74 (35.92) | 0.006 |
| Liver insufficiency | 8 (28.57) | 34 (16.50) | 0.122 |
| Cardiac insufficiency | 19 (67.85) | 80 (38.83) | 0.004 |
| Intervention Measures | |||
| Hormone usage | 17 (60.71) | 54 (26.21) | 0.000 |
| Vasoactive drugs | 22 (78.57) | 52 (25.24) | 0.000 |
| CRRT | 20 (71.42) | 28 (13.59) | 0.000 |
| Invasive mechanical ventilation | 22 (78.57) | 38 (11.55) | 0.000 |
| Red blood cell transfusion | 15 (53.57) | 58 (28.15) | 0.006 |
| APD | 20 (71.42) | 96 (46.60) | 0.014 |
| Necrotic tissue removal | 4 (14.28) | 19 (9.22) | 0.613 |
| Complications | |||
| Abdominal infection | 12(42.85) | 41(19.90) | 0.006 |
| Septic shock | 10(35.71) | 12(5.82) | 0.000 |
| Abdominal bleeding | 8 (28.57) | 7 (3.39) | 0.000 |
| Gastrointestinal bleeding | 5 (17.85) | 13 (6.31) | 0.076 |
| Intestinal fistula | 2 (7.14) | 6 (2.91) | 0.246 |
| Prognosis | |||
| Hospitalization time (days) | 24.00 [21.25] | 18.00 [22.00] | 0.028 |
| ICU stay (days) | 14.00 [15.50] | 6.00 [6.25] | 0.009 |
| Hospitalization Expenses (10000 Chinese Yuan) | 20.59 [27.01] | 9.36 [9.74] | 0.002 |
Abbreviations: ARDS, acute respiratory distress syndrome; APD, abdominal paracentesis drainage; CRRT, continuous renal replacement therapy.
a Values are expressed as No. (%) or median [interquartile range].
b P-values were computed using χ2 test and Mann-Whitney U test.
3.5. Univariate and Multivariate Logistic Regression Analysis of Factors Affecting SAP and Death During Hospitalization
The significant factors detected by the univariate analysis were included in the multivariate logistic regression analysis. The prognosis of SAP patients (i.e., death = 1, survival = 0) was used as the dependent variable, and the ICU admission within 24 hours of onset (i.e., yes = 1, no = 0), serum albumin (continuous variable), and ARDS (i.e., yes = 1, no = 0) and renal insufficiency (i.e., yes = 1, no = 0) were considered as the independent variables in this study. As shown in Table 4, ARDS and renal insufficiency are the independent risk factors of SAP-related deaths, and the protective factors were ICU admission within 24 hours of onset and serum albumin levels.
LR model: Y = -0.108 - 1.852 × ICU admission whithin 24 hours of onset - 0.102 × serum albino + 1.790 × ARDS + 1.150 × renal insufficiency
According to the Hosmer-Lemeshow's goodness of fit test, no significant difference was noticed (χ2 = 4.728, P = 0.786), indicating the acceptable fit of the model.
Table 4.
Univariate and Multivariate Logistic Regression Analysis of Factors Affecting SAP and Death During Hospitalization
| Indexes | Univariate Analysis | Multivariate Analysis | ||||
|---|---|---|---|---|---|---|
| OR | 95% CI | P-Value | Adjusted OR | 95% CI | Adjusted P-Value | |
| ICU admission within 24 hours of onset | 0.169 | 0.062 - 0.461 | 0.001 | 0.157 | 0.053 - 0.467 | 0.001 |
| Serum albumin | 0.902 | 0.843 - 0.965 | 0.003 | 0.903 | 0.833 - 0.978 | 0.012 |
| ARDS | 4.459 | 1.872 - 10.622 | 0.001 | 5.988 | 2.283 - 15.706 | 0.000 |
| Renal insufficiency | 3.211 | 1.409 - 7.318 | 0.006 | 3.158 | 1.263 - 7.896 | 0.014 |
3.6. ROC Curve of LR Model Index and ICU Admission Within 24 Hours of Onset, Serum Albumin, ARDS, and Renal Insufficiency
The AUC and 95% CI were set for the LR model in this study. Accordingly, the AUC values of the ICU admission within 24 hours of onset, serum albumin, ARDS, and renal insufficiency were 0.864 (0.811 - 0.917), 0.694 (0.598 ~ 0.789), 0.693 (0.597 - 0.790), 0.641 (0.531 - 0.750), and 0.677 (0.572 - 0.781), respectively. In this regard, the AUC of the LR model was significantly larger than that of the other indices, with optimum threshold, sensitivity, and specificity of 2.246, 0.709, and 0.929, respectively (Table 5, Figure 1).
Table 5.
ROC Curve Results of LR Model Index and ICU Admission Within 24 Hours of Onset, Serum Albumin, ARDS, and Renal Insufficiency
| Indexes | AUC | 95% CI | Sensitivity | Specificity | P-Value |
|---|---|---|---|---|---|
| LR model | 0.864 | 0.811 - 0.917 | 0.709 | 0.929 | 0.000 |
| ICU admission within 24 hours of onset | 0.694 | 0.598 - 0.789 | 0.179 | 0.437 | 0.001 |
| Serum albumin | 0.693 | 0.597 - 0.790 | 0.663 | 0.679 | 0.001 |
| ARDS | 0.677 | 0.572 - 0.781 | 0.714 | 0.641 | 0.002 |
| Renal insufficiency | 0.641 | 0.531 - 0.750 | 0.643 | 0.641 | 0.016 |
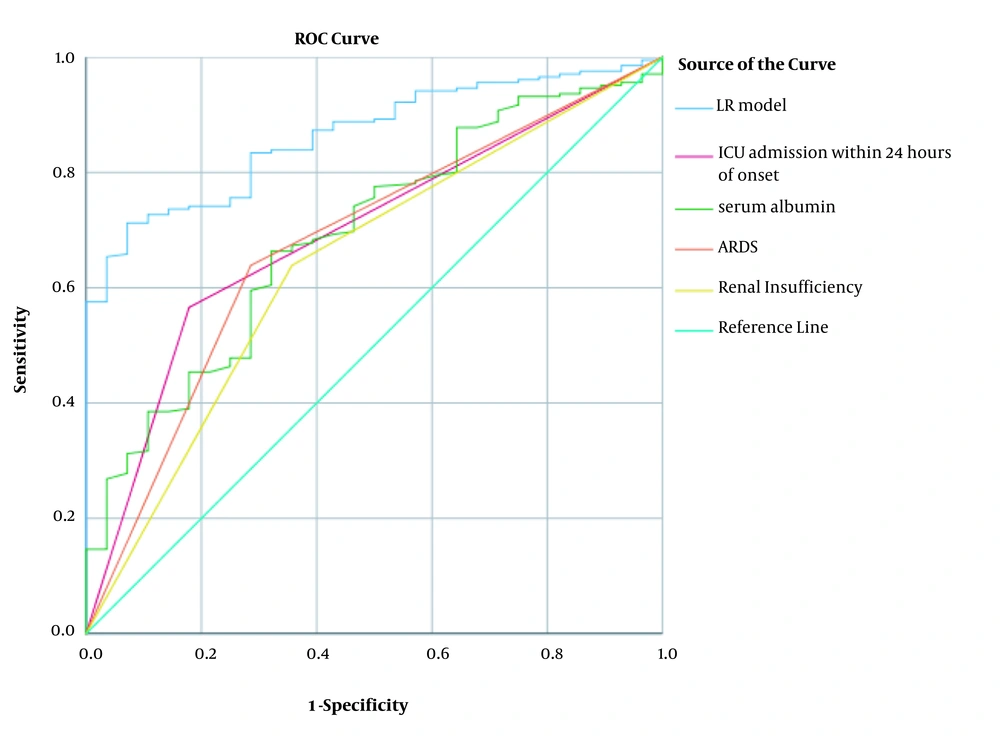
Figure 1.
ROC curve of LR model, ICU admission within 24 hours of onset, serum albumin ARDS and renal insufficiency, AUC for LR model = 0.864, AUC for ICU admission within 24 hours of onset = 0.694, AUC for serum albumin = 0.693, AUC for ARDS = 0.641, and AUC for renal insufficiency = 0.677.
4. Discussion
AP is a common acute abdominal disorder with clinical manifestations from local inflammatory reaction to systemic reaction, which may further progress to multiple organ dysfunction or failures (8). About 20% of the AP patients develop SAP characterized by pancreatic necrosis, extensive extra-pancreatic invasion, and organ dysfunction, which would result in high mortality rates (9). Accordingly, predicting the clinical characteristics of SAP and its prognosis is of paramount importance for early intervention. In this study, we identified the early predictive factors affecting the death from SAP during hospitalization.
A recent large multicenter study in China reported the 15.5% mortality rate of the SAP patients (10); however, the total mortality rate in the present study was relatively low. This inconsistency might be aroused by the following points: (1) all patients were treated within 72 hours of onset, more than half (51.71%) of whom were admitted within 24 hours of onset; (2) in our center, since the integrated diagnosis and treatment by the emergency and ICU departments had been provided for a long time, the SAP patients could be immediately admitted to ICU according to their symptoms; however, most of the patients visited our hospital after the first onset; (3) in our cohort, 63.67% of the patients were aged 18 - 60 years (11); and (4) the prevalence of relevant complications was low. This study revealed that the gallstone and hypertriglyceridemia types were the major etiological types of SAP, with significantly higher mortality rates associated with the latter (9.73 vs. 13.88%). Previous studies have reported an increase in the incidence rate of hypertriglyceridemia acute pancreatitis (HTG-AP) from 13 to 25.6% during 2009 - 2013 (12), implying that the mortality rate of HTG-AP was high, and that its incidence rate is increasing annually. This finding is consistent with the WSES Guidelines for SAP management 2019 and requires further attention (13). From another perspective, HTG-AP still has the following problems: irregular treatment, easy recurrence, and serious effects on pregnant women and fetuses’ health status. In this regard, this research group plans to carry out a series of randomized controlled studies to develop a standardized "prevention-treatment follow-up process" of HTG-AP and popularize it in clinical practice to further reduce the recurrence rate of SAP and improve its prognosis.
Compared to the survival group, BNP, Serum albumin levels, BUN, Cr, PaO2, and other indices in the death group indicated more significant organ dysfunction. Moreover, low serum albumin was identified as an independent SAP risk factor. The high levels of inflammatory mediators, cytokines, and other biologically active components secreted in the early stage of SAP can trigger SIRS and MODS. Consequently, the respiratory, renal, and cardiovascular systems are most frequently affected (6). Accordingly, the revision of Atlanta consensus (Atlanta 2012) on the new classification and definition of pancreatitis defined a Marshall score ≥ 2 for each of the organs as an organ failure (7). The decrease in serum albumin content during SAP can be attributed to the concentration of high metabolic rate and albumin consumption in the early stages. Furthermore, the increased permeability of blood vessels can lead to massive exudation of crystalloids and colloids, and the impaired liver function during SAP is another cause of decreased albumin production.
Although serum amylase activity is an early diagnostic indicator of SAP (14), it is also elevated in digestive tract ulcers, perforation, cholelithiasis, acute appendicitis, and other diseases. Since SAP patients often suffer from the aforementioned diseases, serum amylase activity is not correlated with disease severity and is not a reliable early prognostic indicator of SAP (13, 15). The inflammatory factors released during the early stage of SAP disrupt the balance between coagulation and fibrinolysis, resulting in venous thrombosis and the increased risk of mortality (16). The fibrinolytic product D-dimer, an established early prognostic indicator of SAP (17), significantly increased in the death group. Moreover, compared to the survival group, PTA was decreased, and APTT was prolonged in the death group. Although the D-dimer levels revealed a statistical significance in the univariate analysis, no statistical significance was noticed in the multivariate logistic regression analysis. This inconsistency might be caused by the influence of age and the early inflammation level (18). In previous studies, the relationship between the TC levels and the SAP-related death exhibited a U-shaped distribution, and the mortality rates were significantly higher for TC < 3.67 mmol/L or TC > 5.23 mmol/L (1). However, according to the present findings, the early decrease in TC can be attributed to dysfunctional cell membrane synthesis. The severity and prognosis of SAP can also be evaluated by Hb, Ca, Glu, and other effective factors (19). This is while there was no significant difference between the two groups within 24 hours after the ICU admission.
Considering organ dysfunction, there were significant differences between the death and survival groups in ARDS, renal insufficiency, and cardiac insufficiency, among which ARDS and renal insufficiency were also identified as independent SAP risk factors, suggesting that the disease progressed rapidly in the death group and that some early intervention measures were needed in clinics (6). Moreover, the LR model in this study was as follows: Y = -0.108 - 1.852 × ICU admission within 24 hours of onset - 0.102 × serum albumin + 1.790 × ADRS + 1.150 × renal insufficiency
According to the Hosmer-Lemeshow’s goodness-of-fit test, the difference was not statistically significant, suggesting that the model was well-fitted. The established LR model index, ICU admission within 24 hours of onset, serum albumin, ARDS, and renal insufficiency were analyzed and confirmed by the ROC curve. The results showed that the model was superior to each single index in predicting efficiency and had a certain clinical predictive value.
There are several limitations to this study. First, the selection of all patients from one center might have introduced a selection bias. Second, the small sample size of the death group might have affected the findings; as such, the present findings need to be validated on a larger multicenter cohort.
In conclusion, the respiratory, renal, and cardiovascular functions should be assessed during the early stage of SAP, and then invasive mechanical ventilation and blood purification should be adopted as required. The overall organ function support and treatment in critically ill patients should be concentrated on coordination so as to avoid organ function imbalance during manual intervention. SAP was often accompanied by multiple complications, usually leading to prolonged hospitalization, increased treatment costs, and poor prognosis.