1. Background
Chronic hepatitis B (CHB) and liver cirrhosis are major risk factors for primary liver cancer (1). The global burden remains substantial: in 2019, there were approximately 2.1 million newly diagnosed cases of cirrhosis and nearly 1.5 million deaths, reflecting a steady increase over the preceding decade. Classically, the natural history of cirrhosis comprises two stages: compensated and decompensated. Decompensated cirrhosis is characterized by a sharp increase in mortality owing to portal hypertension-related complications, such as ascites, variceal bleeding, and hepatic encephalopathy (2). Building on this framework, the 2022 Guideline for the Prevention and Treatment of Chronic Hepatitis B introduced the concept of recompensation, defined clinically as the absence of further decompensation events for at least 1 year (i.e., no ascites, encephalopathy, or variceal hemorrhage), together with sustained improvement in liver function, typically MELD < 10 and/or Child-Pugh class A (3). This concept reframes decompensated cirrhosis not as a fixed endpoint but as a dynamic state that can be reversed in selected patients through optimal etiologic therapy and complication control.
Current therapeutic pillars in CHB-related cirrhosis include antiviral therapy, hepatoprotection (4), anti-inflammatory strategies, and antifibrotic interventions, which together aim to stabilize the disease, prevent redecompensation, and improve long-term prognosis (5, 6). Compound Biejia Ruangan Tablets (CBRT) reportedly exert antifibrotic and hepatoprotective effects through multitarget mechanisms, including modulation of inflammation, fibrosis-related pathways, and the hepatic microenvironment (7). Following an in-depth evaluation of its therapeutic effects and toxicity, the former China Food and Drug Administration approved CBRT in 1999 as the first officially licensed oral prescription antifibrotic in China for liver fibrosis/cirrhosis caused by CHB (8). Mechanistically, accumulating evidence suggests that CBRT exerts hepatoprotective, anti-inflammatory, and antifibrotic effects via multiple pathways, including upregulation of autophagy, inhibition of the mTOR axis, deactivation of hepatic stellate cells, and modulation of the lncRNA TUG1-miR-328 - 3p-SRSF9 regulatory sequence, a putative axis linked to a reduced hepatocarcinogenesis risk (9). Clinically, combining CBRT with nucleotide analogues is biologically plausible, with emerging evidence of synergy. In patients with CHB, entecavir (ETV) plus CBRT has been associated with greater regression of fibrosis biomarkers and indices than ETV alone in randomized settings (10), and observational data suggest a reduced incidence of hepatocellular carcinoma and liver-associated mortality in advanced fibrosis/cirrhosis when CBRT is added to antiviral therapy (7). These effects align with the therapeutic goals of recompensation, namely fewer acute decompensation events and sustained improvement in synthetic function.
2. Objectives
Given the central roles of durable viral suppression and antifibrotic activity in achieving recompensation in CHB-related cirrhosis, we evaluated the efficacy and safety of adding CBRT to standard ETV-based therapy in patients after their first decompensation event. We performed a multiparameter assessment encompassing clinical symptoms, liver function tests, synthetic indices such as albumin, hematologic parameters including platelets and white blood cells, FIB-4, serum fibrosis markers including hyaluronic acid (HA), type III procollagen (PCIII), type IV collagen (CIV), and laminin (LN), hepatitis B surface antigen (HBsAg) titers, and hepatitis B virus (HBV) DNA. We also tracked redecompensation events within 1 year to capture clinically meaningful outcomes. We hypothesized that ETV plus CBRT would enhance fibrosis regression, stabilize liver function, and reduce the risk of recurrent decompensation compared with ETV alone. The aim of this study was to determine whether adding CBRT to ETV confers greater clinical benefit in patients with HBV-related decompensated cirrhosis.
3. Methods
3.1. Study Population and Ethics
The diagnosis conformed to the 2019 Guidance for the Diagnosis and Treatment of Liver Cirrhosis (11). Among the 60 individuals included, those with significant cardiac or renal dysfunction, autoimmune liver disease, drug-induced liver injury, cancer, or known allergies were excluded. The mean age of the 15 males and 15 females in the antiviral-only group was 56.33 ± 16.76 years (Table 1). The mean age of the 11 males and 19 females in the observation group was 55.03 ± 11.51 years. The study protocol was approved by the hospital ethics committee (ethics approval code: 2025-014-01; https://www.kdocs.cn/l/csJEwdtZuuPF?f=201&share_style=h5_card). All participants provided written informed consent. This single-center study was conducted at Shaoxing People's Hospital, Shaoxing, China, for 6 months, and patients were followed for 1 year. Treatment started in May 2024 and continued until October 2024, for a total duration of 6 months.
Table 1.
| Group | Gender | Age (y) | Hepatitis B DNA (detectable/non detectable) | Occurrence times of decompensation |
|---|---|---|---|---|
| Control | 15/15 | 56.33 ± 16.76 | 8/12 | 30/30 |
| Observation | 11/19 | 55.03 ± 11.51 | 11/19 | 10/30 |
| t/U c | 0.61 | 0.35 | 420.0 | 150.00 |
| P-value d | 0.43 | 0.73 | 0.59 | 0.00 |
Abbreviations: M, male; F, female; HBV, hepatitis B virus.
a Data are expressed as mean ± standard deviation (SD) for continuous variables or number (n) for categorical variables.
b Continuous variables were compared using the independent-samples t-test or Mann-Whitney U test, as appropriate, and categorical variables were compared using the chi-square test.
c The “Test statistic” column indicates the corresponding test value (t, U, or chi-square).
d P-values represent comparisons between the control group and the observation group.
Footnote: Data are presented as mean ± standard deviation (SD) for continuous variables or number (n) for categorical variables. Continuous variables were compared using the independent-samples t-test or Mann-Whitney U test, as appropriate, and categorical variables were compared using the chi-square test. The “Test statistic” column indicates the corresponding test value (t, U, or chi-square). P values represent comparisons between the control group and the observation group. Abbreviations: M, male; F, female; HBV, hepatitis B virus.
3.2. Grouping
Baseline characteristics, including age, sex, disease duration, and cirrhosis-related indicators, did not differ significantly between the groups (P > 0.05), indicating good comparability. All participants received routine therapy for cirrhosis, including liver protection, diuresis, and nutritional support. The clinical trial registration number was ITMCTR20200055 (https://itmctr.ccebtcm.org.cn/en-US/Home/History).
3.3. Randomization and Masking
This was a single-center, two-arm, randomized, open-label comparative study. Eligible participants were assigned in a 1:1 ratio to the observation group or control group using a computer-generated random sequence created with the RANDBETWEEN function in Microsoft Excel. The randomization sequence was generated by an independent staff member who was not involved in participant recruitment, clinical management, outcome assessment, or statistical analysis. Allocation concealment was ensured using sequentially numbered record files prepared in advance according to the list. After a participant was confirmed eligible and provided written informed consent, one of the authors used the next file in sequence and assigned the participant to the corresponding study group. Because of differences in treatment regimens, blinding of participants and treating clinicians was not feasible; therefore, the trial was conducted in an open-label manner.
The control group received entecavir tablets (0.5 mg once daily; Zhengda Tianqing Pharmaceutical Group Co., Ltd.; approval No. Guoyao Zhunzi H20100019), and no additional antifibrotic agents were used during follow-up. The observation group received the same entecavir regimen combined with CBRT (0.5 g/tablet; four tablets per dose, three times daily; Inner Mongolia Furui Pharmaceutical Technology Co., Ltd.; approval No. Guoyao Zhunzi Z19991011), taken 30 minutes after meals. The treatment duration was identical in both groups.
3.4. Inclusion Criteria
Adults aged 18 to 65 years, regardless of sex, who had tested positive for HBsAg for longer than 6 months were enrolled. Each participant was required to have objective evidence of portal hypertension or cirrhosis documented by at least one of the following: 1) endoscopy showing esophagogastric or ectopic varices, with noncirrhotic portal hypertension excluded; 2) imaging, including B-ultrasound or CT, demonstrating cirrhotic morphology or portal-hypertensive features, such as splenomegaly or a portal vein diameter > 1.3 cm; or 3) liver stiffness consistent with cirrhosis for the underlying etiology. In addition, at least two supportive laboratory indicators, such as thrombocytopenia, hypoalbuminemia, elevated APRI, or prolonged INR/PT, were required. Decompensated cirrhosis was defined as meeting the above criteria plus at least one portal-hypertension-related complication, including ascites, esophagogastric variceal bleeding, sepsis, hepatic encephalopathy, or hepatorenal syndrome. Participants must not have received antifibrotic or immunomodulatory therapy within the preceding 6 months and had to be able, either personally or with assistance from a family member, to understand the study design and provide written informed consent. All tests performed on individuals, along with their details and normal ranges, are included in S1 Table and the supplementary file.
3.5. Exclusion Criteria
Patients with advanced primary liver cancer; acute presentations of congenital metabolic liver disease; severe biliary obstruction; or portal hypertension arising from noncirrhotic causes were excluded. We also excluded individuals who had undergone liver-directed procedures or received other special drug therapies in the preceding 1 to 3 months to avoid confounding effects. Patients currently taking, or who had taken within the previous 3 months, any investigational agents were ineligible. Finally, women who were pregnant or breastfeeding and individuals planning pregnancy during the study period were not enrolled.
3.6. Post-Enrollment Withdrawal
Participant data could be withdrawn after enrollment for any of the following reasons: 1) discovery of noneligibility after inclusion; 2) nonadherence to the dosing protocol; 3) discontinuation due to adverse reactions, recorded and counted as invalid; 4) intercurrent diseases affecting treatment or observation; 5) continuous treatment interruption > 3 days; or 6) other investigator-determined reasons compromising evaluation. All patients cooperated throughout the study, and no patients discontinued the study trial.
3.7. Observation Indices and Assays
All laboratory measurements were performed in the central laboratory of Shaoxing People's Hospital using standardized clinical protocols. Venous blood samples were collected from all participants at baseline and after 6 months of treatment. Routine hematological parameters, including white blood cell (WBC) and platelet (PLT) counts, were measured using an automated hematology analyzer (Sysmex XN-series, Sysmex Corporation, Japan). Liver function indices, including ALT, AST, total bilirubin (TBIL), and albumin (ALB), were analyzed using an automated biochemical analyzer (Hitachi 7600 system, Hitachi High-Technologies, Japan) based on standard enzymatic methods. Quantitative HBsAg levels were determined using a chemiluminescence immunoassay platform (Abbott Architect i2000SR, Abbott Diagnostics, USA). HBV DNA levels were measured using real-time fluorescent quantitative PCR (ABI 7500 Real-Time PCR System, Applied Biosystems, USA). Serum fibrosis markers, including HA, PCIII, CIV, and LN, were measured using commercially available enzyme-linked immunosorbent assay kits, such as those from Shanghai Kehua Bio-engineering Co., Ltd., China, according to the manufacturer’s instructions. All assays were performed by trained laboratory personnel in accordance with internal quality-control procedures. The FIB-4 index was calculated using the standard formula:
where AST is aspartate aminotransferase, ALT is alanine aminotransferase, and the platelet count is expressed as ×10⁹/L.
All methods are described in the supplementary information. A two-sided P value < 0.05 was considered statistically significant.
3.8. Statistical Analysis
Statistical analyses were performed using SPSS version 26.0 (IBM Corp., Armonk, NY, USA). Continuous variables are presented as mean ± SD, and categorical variables are presented as counts (n) and percentages (%). Paired t-tests were used to compare within-group changes before and after treatment, whereas between-group differences were analyzed using independent-samples t-tests or the Mann-Whitney U test, depending on the data distribution. Categorical variables were compared using the chi-square test. No formal normality testing was performed; statistical methods were selected based on conventional use for clinical data and sample-size considerations. Confidence intervals were not calculated because of the exploratory nature of the study and the small sample size. Future studies with larger samples may include confidence intervals to provide more precise treatment estimates. Because this was an exploratory study with a small sample size and a limited number of primary outcomes, no adjustments for multiple comparisons were made. No adjusted analyses were performed because baseline characteristics between the groups were comparable, and the small sample size limited statistical power for multivariable analyses. Given the comparable baseline characteristics, adjusted analyses were deemed unnecessary, and the findings should be interpreted in the context of the study design and sample-size limitations.
4. Results
4.1. FIB-4 Index
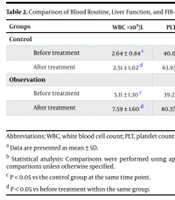
After 6 months of treatment, patients in the observation group showed a marked decline in the FIB-4 index compared with baseline (Table 2; P < 0.05). Compared with the control group at the same time point, the observation group also showed significantly lower FIB-4 scores (P < 0.05). In addition, the overall improvement rate was significantly higher in the observation group than in the control group (P < 0.05). These findings suggest that CBRT, when used as an adjunct to antiviral therapy, meaningfully reduces liver fibrosis. By improving fibrosis-related indices, CBRT may help slow or delay progression to cirrhosis, thereby supporting improved long-term outcomes in patients with chronic hepatitis B-related disease.
Table 2.
| Groups | WBC ×10⁹/L | PLT ×10⁹/L | ALT (U/L) | AST (U/L) | TBIL (U/L) | ALB (U/L) | FIB-4 |
|---|---|---|---|---|---|---|---|
| Control | |||||||
| Before treatment | 2.64 ± 0.84 c | 40.03 ± 8.31 c | 152.73 ± 18.27 c | 143.07 ± 10.08 c | 46.23 ± 6.60 c | 34.84 ± 0.24 c | 2.50 ± 0.40 c |
| After treatment | 2.51 ± 1.02 d | 63.93 ± 13.39 d | 32.74 ± 1.62 d | 32.61 ± 1.55 d | 20.31 ± 2.11 d | 36.03 ± 0.20 d | 2.20 ± 0.30 d |
| Observation | |||||||
| Before treatment | 5.11 ± 1.30 c | 39.23 ± 7.82 c | 146.26 ± 16.80 c | 139.72 ± 10.57 c | 46.90 ± 7.04 c | 34.79 ± 0.21 c | 2.60 ± 0.50 c |
| After treatment | 7.59 ± 1.60 d | 80.37 ± 20.35 d | 26.97 ± 1.65 d | 26.84 ± 1.63 d | 17.21 ± 1.97 d | 38.76 ± 01.18 d | 1.80 ± 0.20 d |
Abbreviations: WBC, white blood cell count; PLT, platelet count; ALT, alanine aminotransferase; AST, aspartate aminotransferase; TBIL, total bilirubin; ALB, albumin.
a Data are presented as mean ± SD.
b Statistical analysis: Comparisons were performed using appropriate statistical methods based on data distribution and study design. P-values represent between-group comparisons unless otherwise specified.
c P < 0.05 vs the control group at the same time point.
d P < 0.05 vs before treatment within the same group.
Footnote: Data are presented as mean ± SD. Comparisons were performed using appropriate statistical methods based on data distribution and study design. P values represent between-group comparisons unless otherwise specified. Symbols: *P < 0.05 vs before treatment within the same group; #P < 0.05 vs control group at the same time point. Abbreviations: WBC, white blood cell count; PLT, platelet count; ALT, alanine aminotransferase; AST, aspartate aminotransferase; TBIL, total bilirubin; ALB, albumin.
4.2. White Blood Cell and Platelet Counts
Baseline WBC and PLT counts were similar between the two groups. After treatment, the observation group showed significant increases from baseline in both WBC and PLT counts (P < 0.05), whereas PLT counts in the control group fluctuated without a significant net change (P > 0.05). At the end of therapy, PLT counts were significantly higher in the observation group than in the control group (P < 0.05). Collectively, these results indicate that CBRT confers a hematologic benefit in cirrhosis, likely by alleviating portal hypertension-related hypersplenism and/or enhancing thrombopoiesis.
4.3. Albumin, ALT, AST, and Total Bilirubin
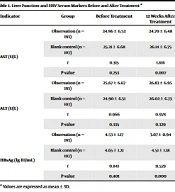
Before treatment, ALB, ALT, AST, and TBIL levels were similar between the groups (P > 0.05). After treatment, ALT and AST levels decreased significantly from baseline in the observation group (P < 0.05). In the control group, ALT, AST, and TBIL levels decreased significantly compared with baseline. The improvement rates for ALT, AST, and TBIL differed significantly between the two groups (P < 0.05), suggesting that CBRT provides notable benefits for liver function and does not exacerbate hepatic injury.
4.4. HBsAg Titer and HBV DNA
Over time, HBsAg titers showed a declining trend in both groups, although the reduction in the combination-therapy group was more pronounced (P < 0.05). Previous research has demonstrated that the HBsAg response is an important marker of treatment efficacy in chronic hepatitis B and is influenced by antiviral and immunomodulatory approaches (12). This suggests that combination therapy may synergistically stabilize virologic indicators, although CBRT may not directly reduce HBV replication. Eight control patients and 11 patients in the observation group had detectable HBV DNA levels at baseline, with no significant between-group difference. After therapy, HBV DNA levels decreased significantly within both groups, falling below the lower limit of detection (< 10 IU/L).
4.5. Changes in Four Indicators of Liver Fibrosis
Before treatment, concentrations of HA, PCIII, CIV, and LN were comparable between the two groups (P > 0.05; Table 3). The enhancement rate in the antiviral group was approximately 18.2%, whereas the observation group achieved 35.8%, nearly double that of the antiviral-only group. The enhancement rate for PCIII was approximately 16.7% in the antiviral group compared with 32.6% in the observation group. For CIV, the enhancement rates were 15.4% and 29.7%, respectively, with a greater effect in the observation group. After treatment, all four indicators in the observation group decreased significantly compared with baseline (P < 0.05), with a more pronounced decline than that observed in the control group during the same period (P < 0.05). These findings further demonstrate that CBRT has a definitive therapeutic effect on liver fibrosis.
Table 3.
| Groups and Time | HA (ng/mL) | LN (ng/mL) | CIV (ng/mL) | PIII (ng/mL) | HBsAg (IU/mL) |
|---|---|---|---|---|---|
| Control | |||||
| Before treatment | 150.78 ± 3.53 | 130.53 ± 2.18 | 85.57 ± 0.97 | 120.4 ± 2.20 | 6.65 ± 30.65 |
| After treatment | 120.14 ± 1.61 | 100.11 ± 1.24 | 65.40 ± 0.89 | 89.94 ± 1.60 | 60.56 ± 21.00 |
| Observation | |||||
| Before treatment | 150.33 ± 1.72 | 130.43 ± 1.61 | 85.54 ± 0.81 | 120.7 ± 3.06 | 95.10 ± 31.76 |
| After treatment | 100.14 ± 1.61 | 80.07 ± 1.35 | 55.54 ± 0.90 | 70.71 ± 3.33 | 45.00 ± 20.01 |
Abbreviations: HA, hyaluronic acid; LN, laminin; CIV, type IV collagen; PIII, procollagen III; HBsAg, hepatitis B surface antigen.
a Data are presented as mean ± SD.
b Comparisons were performed using appropriate statistical methods based on data distribution and study design. P values represent between-group comparisons unless otherwise specified.
4.6. Occurrence of Decompensated Liver Cirrhosis Events and Adverse Events
The incidence of decompensation episodes during therapy was higher in the control group. Among the 30 control patients, ascites occurred in 10 cases (33.3%, 10/30), gastrointestinal bleeding in 6 (20.0%, 6/30), hepatic encephalopathy in 5 (16.7%, 5/30), primary liver cancer in 2 (6.7%, 2/30), and death or liver transplantation in 3 individuals (10.0%, 3/30). All 30 control patients experienced at least one decompensation event within 1 year. In the observation group, the overall incidence was lower: ascites occurred in 4 cases (13.3%, 4/30), gastrointestinal bleeding in 2 cases (6.7%, 2/30), hepatic encephalopathy in 1 case (3.3%, 1/30), sepsis in 1 case (3.3%, 1/30), and death or liver transplantation in 1 case (3.3%, 1/30). Overall, 10 of 30 patients in the observation group experienced decompensation events within 1 year.
The between-group comparison of overall decompensation yielded U = 7.5 and P < 0.05, indicating that the addition of CBRT to antiviral therapy was associated with a markedly reduced risk of decompensation and unfavorable outcomes.
5. Discussion
The disease course from chronic active hepatitis B to compensated cirrhosis and then to decompensated cirrhosis reflects a clear progression in which histological damage and functional impairment are intertwined, ultimately leading to clinical complications (13, 14). Decompensated cirrhosis should not be regarded as a terminal stage but rather as a dynamic state that can potentially revert to compensation with appropriate management (15). The concept of recompensation has enriched prognostic staging by highlighting that decompensated patients may regain stability when the etiology is controlled and complications are effectively prevented (16). This understanding supports the establishment of phased and more practical treatment goals, including reducing acute decompensation events, improving liver function, and potentially reversing the decompensated state. The mechanisms underlying recompensation are multifactorial, involving not only complication control and functional recovery but also histological improvement (17). Mechanistic studies have shown that hepatitis B virus can promote liver disease progression through dysregulation of cellular processes (18).
Antiviral therapy remains the cornerstone of treatment because persistent HBV DNA replication is the major driver of progression (19). Prior research has shown that entecavir effectively inhibits viral replication and improves clinical outcomes in individuals with chronic hepatitis B, reinforcing its position as a first-line antiviral agent (20). Moreover, systematic reviews and meta-analyses have further substantiated that antiviral therapy markedly improves clinical outcomes in patients with chronic hepatitis B, even within particular patient subgroups, underscoring its pivotal role in disease management (21). In this study, patients achieved suppression of HBV DNA below the detection limit after antiviral therapy, confirming its efficacy in halting viral replication. This result aligns with previous findings that sustained viral suppression decreases recurrent decompensation, lowers the incidence of liver failure, and improves long-term prognosis (22). Therefore, effective antiviral therapy is fundamental to recompensation.
From the perspective of traditional Chinese medicine (TCM), hepatitis B cirrhosis corresponds to syndromes such as hypochondriac pain, jaundice, and abdominal distension (23). Recent evidence, including meta-analyses incorporating advanced analytical approaches, suggests that TCM formulations may provide clinically meaningful benefits in liver diseases, supporting their role as adjunctive therapies to improve patient outcomes (24). CBRT embodies these principles. With ingredients such as Biejia, Astragalus membranaceus, Panax notoginseng, Angelica sinensis, Codonopsis pilosula, and Forsythia suspensa, it combines the actions of nourishing qi and blood, clearing toxins, activating circulation, and softening nodules (25). CBRT has been widely used for decades in the treatment of liver fibrosis in HBV-related cirrhosis (26). These outcomes suggest that CBRT not only intervenes in fibrosis progression but also improves hematologic stability and hepatic synthetic function, thereby correcting hypersplenism and supporting coagulation and nutrient balance. This comprehensive effect creates favorable conditions for hepatic repair.
Clinically, the combination group showed lower rates of ascites, variceal bleeding, hepatic encephalopathy, sepsis, hepatocellular carcinoma, and death or transplantation than the antiviral-only group. This finding is consistent with prior reports showing that CBRT combined with antiviral therapy reduces the risk of hepatocellular carcinoma and liver-related death in patients with advanced fibrosis or cirrhosis. The ability to lower decompensation rates indicates a synergistic role for CBRT as a supplement to antiviral therapy (8).
This study has several limitations. It was conducted at a single center with a relatively small sample size, which may limit representativeness and statistical robustness. Decompensation events in cirrhosis are influenced by diverse factors, such as age, comorbidities, etiology, socioeconomic status, and treatment adherence, which could not be fully addressed here. Larger multicenter prospective trials are needed to further validate the efficacy and safety of CBRT. In addition, predictive tools such as the BC2AID score and other early markers of recompensation warrant further integration into future studies to improve patient stratification (27). Considering the low 5-year survival of decompensated cirrhosis, early identification of patients likely to recompensate and timely therapeutic adjustments are critical to improving survival and quality of life while reducing medical costs (28).
In conclusion, this study suggests that, on the basis of antiviral therapy, CBRT can provide additional benefits by improving fibrosis indices, stabilizing liver function, enhancing hematologic parameters, and reducing the incidence of decompensation events. By combining modern antiviral strategies with TCM principles, CBRT represents a valuable adjunct in the comprehensive management of HBV-related cirrhosis, with the potential to promote recompensation and improve long-term outcomes. CBRT might help improve fibrosis-related and laboratory indices and may be associated with fewer decompensation events during follow-up.