
1. Background
Hepatitis B virus (HBV) infection remains a major global public health threat. The World Health Organization estimated 254 million chronic infections in 2022, with nearly one million annual deaths (1). Blood transfusion is a primary route of transmission of blood-borne pathogens, making rigorous donor selection and advanced screening essential (2). Global strategies, including universal infant vaccination and nucleic acid testing (NAT), have substantially reduced HBV prevalence among blood donors (3, 4).
Nevertheless, epidemiological disparities persist between developed and developing countries and across regions within countries. In Iran, HBV epidemiology has changed substantially. The 1993 national mandatory infant vaccination program and the transition to 100% voluntary non-remunerated blood donation by 2007 shifted the country from intermediate to low endemicity (5, 6). National estimates indicate an HBsAg prevalence below 1.5% in the general population, with significantly lower rates among blood donors (7, 8).
However, Sistan and Baluchestan Province, located in southeastern Iran, faces unique challenges, including low socioeconomic indices and extensive borders with high-endemicity countries such as Pakistan and Afghanistan. Cross-border movement and localized risk behaviors make this province critical for blood-safety monitoring (9, 10).
2. Objectives
Long-term, comprehensive epidemiological investigations spanning two decades are scarce. This study aimed to conduct a 20-year retrospective analysis of HBsAg seroprevalence and secular trends among blood donors in Sistan and Baluchestan Province from 2005 to 2024, evaluate donor selection and screening protocols, and identify independent risk factors for HBsAg positivity in this geopolitically sensitive border region.
3. Methods
3.1. Study Design and Population
This retrospective epidemiological study combined a 20-year trend analysis with a nested case-control design and was conducted from January 2005 to December 2024 in Sistan and Baluchestan Province, southeastern Iran. The target population comprised all individuals who met the Iranian Blood Transfusion Organization (IBTO) donor criteria. In total, 935,864 blood donors were included in the final trend analysis. Deferred individuals were excluded.
3.2. Blood Donor Classification
Donors were categorized as first-time donors (first donation ever), lapsed donors (prior donation but > 12 months since the last donation), and repeat donors (≥ 2 donations within the past 12 months).
3.3. Data Collection and Nested Case-Control Design
Data were retrieved from Negareh, the IBTO national electronic registry. For each donation, age, sex, marital status, education, occupation, donation history, and residence were recorded. Using a nested case-control approach, 300 HBsAg-positive donors were selected as cases and 300 HBsAg-negative donors as controls, matched on age (± 2 years) and sex. A structured questionnaire administered by trained specialists collected data on risk exposures, including transfusions, surgeries, dental work, tattooing, cupping, drug abuse, needle-stick injuries, and household HBV contact.
3.4. Laboratory Screening and Confirmation
Screening methods evolved over the study period: manual ELISA (2005 - 2009), automated ELISA from October 28, 2009, CLIA from November 23, 2019, and NAT from August 21, 2024. Initially reactive samples underwent duplicate repeat testing. Repeatedly reactive samples were confirmed using HBsAg neutralization, anti-HBc testing, and NAT in the later period. Only confirmed positive samples were classified as true HBsAg-positive cases.
3.5. Statistical Analysis
Analyses were performed using SPSS version 26.0. The Cochran-Armitage test was used to evaluate linear trends in seroprevalence. Univariable logistic regression was used to identify variables with P < 0.10 for entry into multivariable models. Adjusted odds ratios (aORs) with 95% confidence intervals (CIs) were calculated. Two-tailed P < 0.05 indicated statistical significance.
3.6. Ethical Considerations
The study followed the Declaration of Helsinki. Data were anonymized. The protocol was approved by the Ethics Committee of Zahedan University of Medical Sciences (IR.ZAUMS.REC.1404.392).
4. Results
4.1. Baseline Demographics
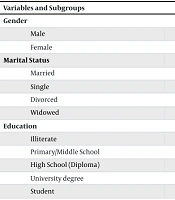
Among 935,864 donors, 5,930 were HBsAg-positive, corresponding to an overall crude seroprevalence of 0.634%. HBsAg seroprevalence was significantly associated with all sociodemographic variables (P < 0.001; Table 1). Males constituted 91.1% of donors and had a significantly higher prevalence than females (0.642% vs 0.544%; P < 0.001). Widowed individuals had the highest prevalence (0.96%). A strong inverse gradient was observed between education level and infection, ranging from 2.82% among illiterate individuals to 0.19% among those with a university degree. Unemployed (1.06%) and self-employed (0.96%) individuals had the highest prevalence, whereas healthcare workers had the lowest prevalence (0.11%) (Table 1).
Table 1.
Sociodemographic Characteristics and HBsAg Seroprevalence Among Blood Donors (2005 - 2024) a
| Variables and Subgroups | Total Donor (No.) | HBsAg Positive (No.) | HBsAg Positive (%) | P-Value |
|---|---|---|---|---|
| Gender | ||||
| Male | 852458 | 5476 | 0.64 | < 0.001 |
| Female | 83406 | 454 | 0.54 | < 0.001 |
| Marital Status | ||||
| Married | 749028 | 4737 | 0.63 | < 0.001 |
| Single | 184343 | 1179 | 0.64 | < 0.001 |
| Divorced | 1871 | 8 | 0.43 | < 0.001 |
| Widowed | 622 | 6 | 0.96 | < 0.001 |
| Education | ||||
| Illiterate | 47706 | 1347 | 2.82 | < 0.001 |
| Primary/Middle School | 298630 | 2835 | 0.95 | < 0.001 |
| High School (Diploma) | 279457 | 1104 | 0.40 | < 0.001 |
| University degree | 300203 | 569 | 0.19 | < 0.001 |
| Student | 9868 | 75 | 0.76 | < 0.001 |
| Occupation | ||||
| Office (Administrative) | 227450 | 708 | 0.31 | < 0.001 |
| Healthcare worker | 18532 | 21 | 0.11 | < 0.001 |
| Self-employed | 345771 | 3306 | 0.96 | < 0.001 |
| Homemaker | 49378 | 394 | 0.80 | < 0.001 |
| Retired | 22548 | 93 | 0.41 | < 0.001 |
| Unemployed | 24007 | 254 | 1.06 | < 0.001 |
| Student | 55319 | 265 | 0.48 | < 0.001 |
| Driver | 87357 | 538 | 0.62 | < 0.001 |
| Others | 105503 | 351 | 0.33 | < 0.001 |
a Statistical significance was evaluated using the chi-square test.
4.2. Twenty-Year Trends
HBsAg seroprevalence declined from 2.039% in 2005 to 0.189% in 2024, corresponding to a 90.7% relative reduction (Cochran-Armitage P < 0.001). Prevalence declined steadily during the first decade and then decreased sharply after 2015, from 0.438% in 2015 to 0.129% in 2016. The lowest rates were observed in 2019 (0.019%) and 2018 (0.022%), remaining below 0.07% from 2017 to 2020. A modest fluctuation occurred from 2021 to 2024, ranging from 0.112% to 0.189%, while rates remained substantially lower than those in the first decade (Table 2).
Table 2.
Annual Trend of HBsAg Seroprevalence Among Blood Donors in Sistan and Baluchestan Province (2005 - 2024) a
| Year | Total Donation | Total Donor | HBsAg positive(n) | Prevalence (%) |
|---|---|---|---|---|
| 2005 | 45928 | 39144 | 798 | 2.039 |
| 2006 | 58957 | 49990 | 972 | 1.944 |
| 2007 | 57528 | 48200 | 666 | 1.382 |
| 2008 | 65893 | 54826 | 662 | 1.207 |
| 2009 | 66912 | 55030 | 455 | 0.827 |
| 2010 | 60203 | 46594 | 411 | 0.882 |
| 2011 | 63151 | 49088 | 407 | 0.829 |
| 2012 | 68043 | 52191 | 383 | 0.734 |
| 2013 | 69607 | 52803 | 324 | 0.614 |
| 2014 | 72870 | 53506 | 281 | 0.525 |
| 2015 | 70375 | 49552 | 217 | 0.438 |
| 2016 | 69299 | 45743 | 59 | 0.129 |
| 2017 | 71358 | 46743 | 23 | 0.049 |
| 2018 | 68371 | 44683 | 10 | 0.022 |
| 2019 | 63337 | 42034 | 8 | 0.019 |
| 2020 | 58679 | 40165 | 25 | 0.062 |
| 2021 | 58797 | 41015 | 46 | 0.112 |
| 2022 | 57548 | 41601 | 55 | 0.132 |
| 2023 | 53242 | 38601 | 44 | 0.114 |
| 2024 | 61827 | 44355 | 84 | 0.189 |
| Total | 1261925 | 935864 | 5930 | 0.634 |
a Statistical significance was evaluated using the chi-square test.
4.3. Prevalence by Donation Status
A profound disparity was observed across donor strata (P < 0.001). First-time donors accounted for 96.2% of HBsAg-positive cases, whereas lapsed and repeat donors accounted for 2.5% and 1.3%, respectively. Crude prevalence was several-fold higher among first-time donors (1.861%) than among lapsed donors (0.059%) and repeat donors (0.021%). From 2016 onward, annual prevalence among repeat donors remained between 0.00% and 0.005%, with zero positive cases in multiple years (Table 3).
Table 3.
Annual HBsAg Seroprevalence by Donation Status (2005 - 2024)
| Year | First-Time Donors | Lapsed Donors | Repeat Donors | ||||||
|---|---|---|---|---|---|---|---|---|---|
| N-total | Positive (No.) | Prev (%) | total | Positive (No.) | Prev (%) | Total | Positive (No.) | Prev (%) | |
| 2005 | 27091 | 766 | 2.828 | 3400 | 13 | 0.382 | 8653 | 19 | 0.220 |
| 2006 | 31803 | 936 | 2.943 | 5740 | 20 | 0.348 | 12447 | 16 | 0.129 |
| 2007 | 27234 | 644 | 2.365 | 7801 | 15 | 0.192 | 13165 | 7 | 0.053 |
| 2008 | 29972 | 635 | 2.119 | 10660 | 16 | 0.150 | 14194 | 11 | 0.077 |
| 2009 | 28357 | 445 | 1.569 | 11485 | 8 | 0.070 | 15188 | 2 | 0.013 |
| 2010 | 17779 | 384 | 2.160 | 12621 | 22 | 0.174 | 16194 | 5 | 0.031 |
| 2011 | 17832 | 392 | 2.198 | 13441 | 12 | 0.089 | 17815 | 3 | 0.017 |
| 2012 | 17397 | 370 | 2.127 | 15687 | 10 | 0.064 | 19107 | 3 | 0.016 |
| 2013 | 16151 | 315 | 1.950 | 16475 | 8 | 0.049 | 20177 | 1 | 0.005 |
| 2014 | 15235 | 271 | 1.779 | 16080 | 6 | 0.037 | 22191 | 4 | 0.018 |
| 2015 | 12366 | 210 | 1.698 | 14494 | 3 | 0.021 | 22692 | 4 | 0.018 |
| 2016 | 8472 | 58 | 0.685 | 13337 | 0 | 0.000 | 23934 | 1 | 0.004 |
| 2017 | 6752 | 21 | 0.311 | 13945 | 2 | 0.014 | 26046 | 0 | 0.000 |
| 2018 | 5895 | 6 | 0.102 | 13444 | 4 | 0.030 | 25344 | 0 | 0.000 |
| 2019 | 5373 | 6 | 0.112 | 12822 | 1 | 0.008 | 23839 | 1 | 0.004 |
| 2020 | 6546 | 24 | 0.367 | 13002 | 0 | 0.000 | 20617 | 1 | 0.005 |
| 2021 | 6962 | 43 | 0.618 | 13450 | 2 | 0.015 | 20603 | 1 | 0.005 |
| 2022 | 8296 | 55 | 0.663 | 13927 | 0 | 0.000 | 19378 | 0 | 0.000 |
| 2023 | 7466 | 41 | 0.549 | 13395 | 3 | 0.022 | 17740 | 0 | 0.000 |
| 2024 | 9549 | 82 | 0.859 | 15144 | 2 | 0.013 | 19662 | 0 | 0.000 |
| Total | 306528 | 5704 | 1.861 | 250350 | 147 | 0.059 | 378986 | 79 | 0.021 |
4.4. Geographic Distribution
Seroprevalence varied across districts (P < 0.001). The highest overall prevalence was observed in Iranshahr (0.709%) and Chabahar (0.696%), followed by Zahedan (0.642%) and Zabol (0.593%); Saravan had the lowest prevalence (0.157%). All districts showed consistent downward trends, with annual rates below 0.4% by 2024 (Table 4).
Table 4.
Geographic Distribution of HBsAg Seroprevalence by City (2005 - 2024) a
| Year | Zahedan | Zabol | Iranshahr | Chabahar | Saravan | ||||||||||
|---|---|---|---|---|---|---|---|---|---|---|---|---|---|---|---|
| N | n | Prevalence (%) | N | n | Prevalence (%) | N | n | Prevalence (%) | N | n | Prevalence (%) | N | n | Prevalence (%) | |
| 2005 | 30376 | 623 | 2.051 | 5049 | 112 | 2.218 | NA | NA | NA | 3719 | 63 | 1.694 | NA | NA | NA |
| 2006 | 34037 | 656 | 1.927 | 6244 | 65 | 1.041 | 6260 | 181 | 2.891 | 3449 | 70 | 2.030 | NA | NA | NA |
| 2007 | 33846 | 452 | 1.335 | 4950 | 67 | 1.354 | 5784 | 83 | 1.435 | 3620 | 64 | 1.768 | NA | NA | NA |
| 2008 | 39091 | 420 | 1.074 | 5378 | 95 | 1.766 | 6020 | 94 | 1.561 | 4337 | 53 | 1.222 | NA | NA | NA |
| 2009 | 38078 | 251 | 0.659 | 5500 | 68 | 1.236 | 5780 | 71 | 1.228 | 5672 | 65 | 1.146 | NA | NA | NA |
| 2010 | 27899 | 192 | 0.688 | 5747 | 76 | 1.322 | 7204 | 79 | 1.097 | 5744 | 64 | 1.114 | NA | NA | NA |
| 2011 | 29377 | 190 | 0.647 | 6182 | 76 | 1.229 | 8006 | 79 | 0.987 | 5523 | 62 | 1.123 | NA | NA | NA |
| 2012 | 31670 | 204 | 0.644 | 5705 | 41 | 0.719 | 9057 | 91 | 1.005 | 5759 | 47 | 0.816 | NA | NA | NA |
| 2013 | 32228 | 190 | 0.590 | 6711 | 40 | 0.596 | 8507 | 59 | 0.694 | 5357 | 35 | 0.653 | NA | NA | NA |
| 2014 | 32195 | 171 | 0.531 | 6487 | 33 | 0.509 | 8125 | 45 | 0.554 | 6699 | 32 | 0.478 | NA | NA | NA |
| 2015 | 28602 | 107 | 0.374 | 6494 | 24 | 0.370 | 7977 | 49 | 0.614 | 5080 | 29 | 0.571 | 1399 | 8 | 0.572 |
| 2016 | 26232 | 24 | 0.091 | 6274 | 10 | 0.159 | 6657 | 9 | 0.135 | 4352 | 11 | 0.253 | 2228 | 5 | 0.224 |
| 2017 | 25991 | 8 | 0.031 | 6493 | 6 | 0.092 | 7140 | 4 | 0.056 | 4151 | 3 | 0.072 | 2968 | 2 | 0.067 |
| 2018 | 25136 | 4 | 0.016 | 6865 | 1 | 0.015 | 6510 | 3 | 0.046 | 3993 | 2 | 0.050 | 2179 | 0 | 0.000 |
| 2019 | 22863 | 3 | 0.013 | 7185 | 0 | 0.000 | 5940 | 2 | 0.034 | 3521 | 3 | 0.085 | 2525 | 0 | 0.000 |
| 2020 | 21202 | 6 | 0.028 | 6378 | 2 | 0.031 | 5386 | 8 | 0.149 | 3633 | 2 | 0.055 | 3566 | 7 | 0.196 |
| 2021 | 21376 | 22 | 0.103 | 6342 | 5 | 0.079 | 5881 | 9 | 0.153 | 3977 | 10 | 0.251 | 3439 | 0 | 0.000 |
| 2022 | 20666 | 22 | 0.106 | 6907 | 5 | 0.072 | 5962 | 18 | 0.302 | 3940 | 5 | 0.127 | 4126 | 5 | 0.121 |
| 2023 | 18249 | 15 | 0.082 | 6656 | 7 | 0.105 | 5936 | 9 | 0.152 | 3743 | 3 | 0.080 | 4017 | 10 | 0.249 |
| 2024 | 21000 | 34 | 0.162 | 7702 | 10 | 0.130 | 7134 | 24 | 0.336 | 3756 | 4 | 0.106 | 4763 | 12 | 0.252 |
| Total | 560114 | 3594 | 0.642 | 125249 | 743 | 0.593 | 129266 | 917 | 0.709 | 90025 | 627 | 0.696 | 31210 | 49 | 0.157 |
a Abbreviation: NA, Data not available (Saravan center not active or data not recorded in early years).
4.5. Age Distribution
Age-specific analysis showed significant downward trends across all cohorts (P = 0.0001). From 2005 to 2010, the highest prevalence was observed in older age groups (55 - 61 years: 5.06% in 2005). By 2024, prevalence in all age brackets had fallen below 0.4%, with the lowest rates among donors younger than 30 years (0.04%–0.05%). Donors aged 21 to 25 years constituted the largest proportion of positive cases (21.13%).
4.6. Multivariable Risk Factor Analysis
Univariable analysis identified significant associations with household HBV contact, drug abuse, jaundice, knife wounds, dental procedures, imprisonment, blood transfusion, and tattooing (P < 0.05). Cupping, alcohol consumption, surgery, and endoscopy were not significant.
The final multivariable model identified four independent risk factors: household contact with an HBV-positive individual, which was the strongest predictor (aOR = 54.51; 95% CI, 15.86 - 187.32; P < 0.001); a history of drug abuse (aOR = 19.40; 95% CI, 2.22 - 169.78; P = 0.007); a history of jaundice/icterus (aOR = 8.12; 95% CI, 2.32 - 28.43; P = 0.001); and a history of knife wounds (aOR = 7.35; 95% CI, 1.85 - 29.23; P = 0.005). Dental procedures were protective (aOR = 0.35; 95% CI, 0.14 - 0.89; P = 0.028). Imprisonment (aOR = 2.24; P = 0.085) and blood transfusion (aOR = 3.08; P = 0.195) lost significance after adjustment (Table 5).
Table 5.
Univariable and Multivariable Logistic Regression Analysis of Potential Risk Factors for HBsAg Positivity a
| Risk Factors | Case (HBsAg+) | n = 300 | Control (HBsAg-) n = 300 | Univariable Analysis | OR (95% CI) | P-Value | Multivariable Analysis | aOR (95% CI) | b | P-Value |
|---|---|---|---|---|---|---|
| Household contact with HBV+ | 93 (31.0) | 3 (1.0) | 44.48 | (13.897 - 142.353) | 0.000002 | 54.509 | (15.862 - 187.322) | 0.00000002 |
| Drug Abuse History | 23 (7.3) | 1 (0.3) | 23.66 | (3.168 - 176.712) | 0.00028 | 19.396 | (2.216 - 169.782) | 0.007 |
| History of Jaundice (Icterus) | 23 (7.7) | 3 (1.0) | 8.22 | (2.440 - 27.680) | 0.00006 | 8.120 | (2.320 - 28.430) | 0.001 |
| Blood Transfusion History | 16 (5.3) | 3 (1.0) | 5.57 | (1.608 - 19.347) | 0.007 | 3.077 | (0.561 - 16.870) | 0.195 |
| Knife Wound History | 20 (6.7) | 7 (2.3) | 3.01 | (1.249 - 7.207) | 0.014 | 7.345 | (1.846 - 29.231) | 0.005 |
| History of Imprisonment | 32 (10.7) | 14 (4.7) | 2.44 | (1.274 - 4.671) | 0.007 | 2.244 | (0.893 - 5.639) | 0.085 |
| Unsafe Sexual contact | 20 (6.7) | 10 (3.3) | 2.07 | (0.953 - 4.504) | 0.06 | 1.145 | (0.370 - 3.540) | 0.814 |
| Tattooing | 49 (16.4) | 31 (10.3) | 1.70 | (1.051 - 2.753) | 0.03 | 0.935 | (0.446 - 1.959) | 0.858 |
| Alcohol consumption | 11 (3.7) | 7 (2.3) | 1.56 | (0.611 - 4.182) | 0.34 | 1.506 | (0.362 - 6.264) | 0.574 |
| Surgical History | 94 (31.3) | 86 (28.7) | 1.14 | (0.801 - 1.610) | 0.48 | 0.848 | (0.464 - 1.551) | 0.593 |
| Endoscopy History | 18 (6.0) | 19 (6.3) | 0.94 | (0.485 - 1.837) | 0.87 | 1.341 | (0.500 - 3.593) | 0.56 |
| Dental procedure | 159 (53.7) | 214 (71.3) | 0.47 | (0.332 - 0.655) | 0.0001 | 0.354 | (0.140 - 0.894) | 0.028 |
| cupping | 69 (23.0) | 62 (20.7) | 1.152 | (0.781 - 1.697) | 0.47 | 1.575 | (0.859 - 2.887) | 0.142 |
a Values are expressed as percentage unless otherwise indicated. P values < 0.05 indicate statistical significance. Abbreviations: OR, odds ratio; aOR, adjusted odds ratio; CI, confidence interval.
b The multivariable model was adjusted for baseline matching and socioeconomic variables, including age, sex, educational attainment, and occupational status.
5. Discussion
This 20-year analysis of 935,864 blood donors in Sistan and Baluchestan Province found an overall HBsAg seroprevalence of 0.634%, with a marked decline from 2.039% in 2005 to 0.189% in 2024 (> 90% reduction; P < 0.001). This decline reflects the success of Iran's 1993 universal infant HBV vaccination program (11) and the 2007 transition to voluntary non-remunerated donation (6).
5.1. Comparison With National and Regional Data
The observed seroprevalence of 0.634% exceeds the national pooled estimate of 0.53% (95% CI, 0.37%–0.72%) for Iranian blood donors (12), which is consistent with expectations for a border province. The general population prevalence in Sistan and Baluchestan has historically ranged from 2.5% to 3.38% (6, 13). The donor prevalence observed in this study (0.634%) is substantially lower, confirming the healthy donor effect and indicating that many community infections remain undiagnosed.
Nationwide data estimated a prevalence of 0.053% among Iranian blood donors in 2018 (14), compared with 0.022% in this study for the same year. Studies from Fars Province reported declines from 0.36% to 0.024% (12), similar to the trajectory observed here. These findings contrast sharply with data from eastern neighbors; Attaullah et al. reported an HBsAg prevalence of 2.68% among blood donors in Peshawar, Pakistan (2), reflecting later vaccine introduction and differences in donor-safety infrastructure. Despite cross-border movement, Iran's relatively low rate of 0.634% indicates effective prevention efforts.
5.2. Sharp Decline After 2015
The striking decline after 2015, culminating in a nadir of 0.019% in 2019, was driven by two factors. First, the IBTO enforced stringent deferral criteria for first-time donors, who accounted for 96.2% of positive cases, while expanding the recall of repeat donors. This strategic transition to a secure repeat-donor pool explains the near-zero prevalence observed in 2017 and 2018. Second, the switch from automated ELISA to CLIA in November 2019 enhanced diagnostic accuracy.
The modest post-pandemic increase from 2021 to 2024 (0.112% to 0.189%) mirrors global trends. US data confirmed a demographic shift toward repeat donors during the pandemic, with HBV odds remaining resiliently higher (15). In this setting, the minor resurgence reflects post-pandemic normalization of collections and the return of first-time donors, in addition to NAT implementation in August 2024, which detected occult HBV infections previously missed by serological screening.
5.3. Age-Specific Trends and Vaccination Impact
In the early study years (2005 - 2010), prevalence was highest among older donors (55 - 61 years: 5.06%), reflecting the pre-vaccination baseline. By 2024, prevalence in all cohorts had dropped below 0.4%, with the most profound reductions among donors younger than 30 years (0.04%–0.05%). This finding underscores the efficacy of Iran's 1993 universal infant vaccination program (11). Although 21.13% of positive cases were among donors aged 21 to 25 years, this reflects the large number of young first-time donors rather than a higher risk of infection.
5.4. Independent Risk Factors
Household contact with an HBV-infected person was the strongest predictor (aOR = 54.51), highlighting intrafamilial transmission in southeastern Iran, where large family size and collective living may facilitate spread. This finding aligns with evidence on familial clustering of HBV in low-income populations (16) and historical data from Zahedan (17). Other risk factors included drug abuse (aOR = 19.40), a history of jaundice (aOR = 8.12), and knife wounds (aOR = 7.35). The association with knife injury suggests cultural practices or nonsterile environments that require targeted education. Imprisonment lost significance after adjustment, likely because of collinearity with drug abuse (18). Dental procedures were protective (aOR = 0.35), potentially serving as a proxy for higher socioeconomic status and a greater likelihood of HBV vaccination, consistent with the protective effect of higher education.
5.5. Geopolitical and Operational Implications
Sistan and Baluchestan shares porous borders with high-endemicity Pakistan and Afghanistan (19). Persistent hotspots, including Iranshahr (0.709%) and Chabahar (0.696%), indicate that standard deferral is insufficient. The disparity between first-time donors (1.861%) and repeat donors (0.021%) provides a clear roadmap: expanding the repeat donor pool and strengthening pre-donation screening are essential. This aligns with domestic models in which pre-donation viral screening for first-time donors reduced confirmed transfusion-transmitted infection markers to zero (20). NAT implementation in August 2024 is a critical milestone for closing the diagnostic window and detecting occult HBV infection (21, 22).
5.6. Study Limitations
This study has several limitations. First, the findings are limited to blood donors, who are healthier than the general population and may not be generalizable. Second, self-reported risk factors are subject to recall bias. Third, Saravan data were unavailable in the early years. Fourth, NAT was implemented only at the end of the study period; therefore, pre-2024 occult infections could not be assessed. Fifth, changes in screening technology and donor policies over time may have influenced trends. Sixth, small case numbers in some risk categories produced wide confidence intervals, although the associations remained significant.
5.7. Conclusions
This 20-year retrospective analysis demonstrates a sustained decline of more than 90% in HBsAg seroprevalence among blood donors in Sistan and Baluchestan Province, shifting the region to low endemicity. This success reflects Iran's universal infant vaccination program and voluntary blood donation system. However, persistent local hotspots and cross-border population movement require continued vigilance. Strategies to further secure the blood supply should focus on expanding the repeat donor pool, maintaining rigorous pre-donation screening, and using NAT to detect occult infections.