
1. Background
Breast cancer is a heterogeneous disease and the most common malignant disease in women around the world with more than 2 million new cases and nearly 630 000 estimated deaths worldwide in 2018 (1). There is ongoing research to determine precise histopathologic methods in the diagnosis of breast cancer (2).
The human epidermal growth factor receptor 2 (HER2) is an established biomarker for the management of patients with breast cancer (3). Amplification of the HER-2/neu proto-oncogene has been reported to occur in about 15% of cases with malignant breast conditions (4). Positive HER-2 tumors have two more clinically important issues. Like the first issue, such tumors are usually chemotherapy-resistant. The second issue is that positive HER-2 tumors are usually diagnosed in younger patients (3, 4).
Of different methods available to assess HER-2 in breast cancer tissues, presumably, immunohistochemistry (IHC) and fluorescence in-situ hybridization (FISH) are the most used and available methods (5) However, there is controversy regarding what algorithm is the optimal approach for HER-2 testing and it is estimated that up to 20% of HER2 testing may not be necessarily accurate (6). This inconsistency is even more pronounced in equivocal HER-2 testing results performed by IHC, namely score 2+ (range, 0 to 3+). Therefore, complementary testing is recommended when borderline IHC staining results are observed (7).
The digitization of pathology is recognized as a reproducible and rapid method. This process is done via computerized image analysis.
With the introduction of whole-slide digital scanning technology, it is possible to store digitalized tissue histopathology slides. Advanced image analysis techniques (digital image analysis, DIA) have provided promising results for resolving equivocal IHC staining results (8, 9). In previous studies, DIA was reported to be a useful technique in the identification of borderline HER-2 expression in breast cancer tissues (10) as well as to minimize the variations of observer reports (11).
2. Objectives
In this study, we assessed the accuracy and reliability of a DIA system via a web application in the diagnosis of HER2 positive invasive ductal carcinoma.
3. Methods
In this cross sectional study, 60 samples of invasive ductal carcinoma with an IHC staining score of 2+ for HER2 were included. All samples (from 2013 to 2017), which met the criteria, were gathered from the department of pathology archive, which serves to the Oncology Clinic of our university hospital. The inclusion criteria comprised sufficient quality for slides of cancerous tissue to be studied, while the exclusion criteria were insufficient sample or failure in providing the image with the appropriate quality of the slides.
At first, we cleaned the slides for two pathologists to check them in terms of scoring and staining quality. We also applied white balance (WB) adjustment and exposure value setting for the slides. Then, based on the appropriate area of each slide, we took an average of 4 to 6 images with scanning magnification of 20X and 40X. The images were saved in high quality (HQ) (1840*3264 pixels ~6-megapixel resolution, 600-1500 kilobytes file sizes) JPEG compression. Finally, we examined the quality of images in terms of sharpness, resolution, and focus on the computer and replaced the ones that were not eligible.
To analysis the digital images of the IHC slide for the HER-2 marker, we used a free online application named “ImmunoMembrane”, which is available at https://153.1.200.58:8080/immunomembrane.
In the online version of this application accessed by any browsers, images are uploaded one by one and the application carries out automatic color deconvolution and, then, the results are provided.
Before image analysis, we uploaded a control positive image so that the application would consider it as a reference for contrast and intensity. Based on the control positive image, the software defines the reference contrast (RC) and reference intensity (RI) and saves the measurements to normalize staining changes in different image series and score images while analysis.
Blank field correction is another step to calibrate the software. The blank image captures all aberrations in color balance and illumination that are not inherent in the stained tissue. During the image analysis, the application compares each image with a blank field image and correct the RGB (red, green, blue) color channels according to ICF = (IC/BC)*255, where the ICF is the corrected channel, IC is the original channel, and BC is the blank field image channel. Since there are aberrations in color balance and illumination in different areas of an optical microscopic field, this correction is carried out to minimize its effect on the final analysis.
The next step is color deconvolution, which is a method used in diagnostic bright field microscopy to transform color images of multiple stained biological samples into images representing the stain concentrations. It is done through decomposing the absorbance values of stain mixtures into singe stains represented by absorbance values. The color deconvolution produced image will be normalized by reference contrast from control positive image.
In the next steps, the image is processed by multiple filters like Median Filter, Unsharp Mask Filter, and Threshold Filter. The output is an image, in which each cell can be analyzed in terms of intensity and completeness. Completeness uses to show HER-2 status in cells’ membranes included complete or incomplete and intensity uses for the degree of HER-2 staining. If a cell has a complete and strong HER-2 expression, it turns to red, while the negative ones are green.
The degree of intensity and the status of completeness are separately scored and used to show the status of HER-2 expression. The final score is counted based on the recommended criteria of the American Society of Clinical Oncology/College of American Pathologists (ASCO/CAP) 2013.
We took an image of all samples, using a digital camera (true ChromeII). For each sample, there was at least one image with 50 or 100 magnification and one image with 200X to 400X. There were on a total of 307 images, on average 5 images for each sample. Images were saved as JPEG files in an external hard with 298 megabytes size. Two pathologists, who were associate professors of the pathology department with at least 10-year experience, were responsible to examine the sample slides as well as images.
3.1. Statistical analyses
Sensitivity and specificity values of DIA were determined by calculating true positive, false positive, false negative, and true negative considering FISH as the reference standard. For analysis of the coefficient agreement, Cohen’s kappa coefficient and Kendall’s W Ranks were used. The coefficient agreement less than 0.4 were considered low, between 0.4 and 0.7 was considered moderate, and greater than 0.7 was considered sufficient. All analyses were performed, using SPSS software (ver. 22.0, IBM, US).
3.2. Ethics
The study protocol was fully supported by the Research Council Ethics Committee of our medical university (960260). The study conformed to the Declaration of Helsinki.
4. Results
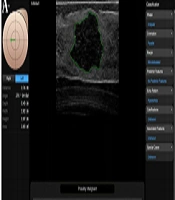
DIA diagnosed 52 samples correctly (86.7%) (Figures 1-3). This was higher than positive diagnoses by the FISH method and much higher than positive diagnoses made by pathologists (Table 1). There were some discrepancies between DIA and FISH reference methods (Figures 4-5).
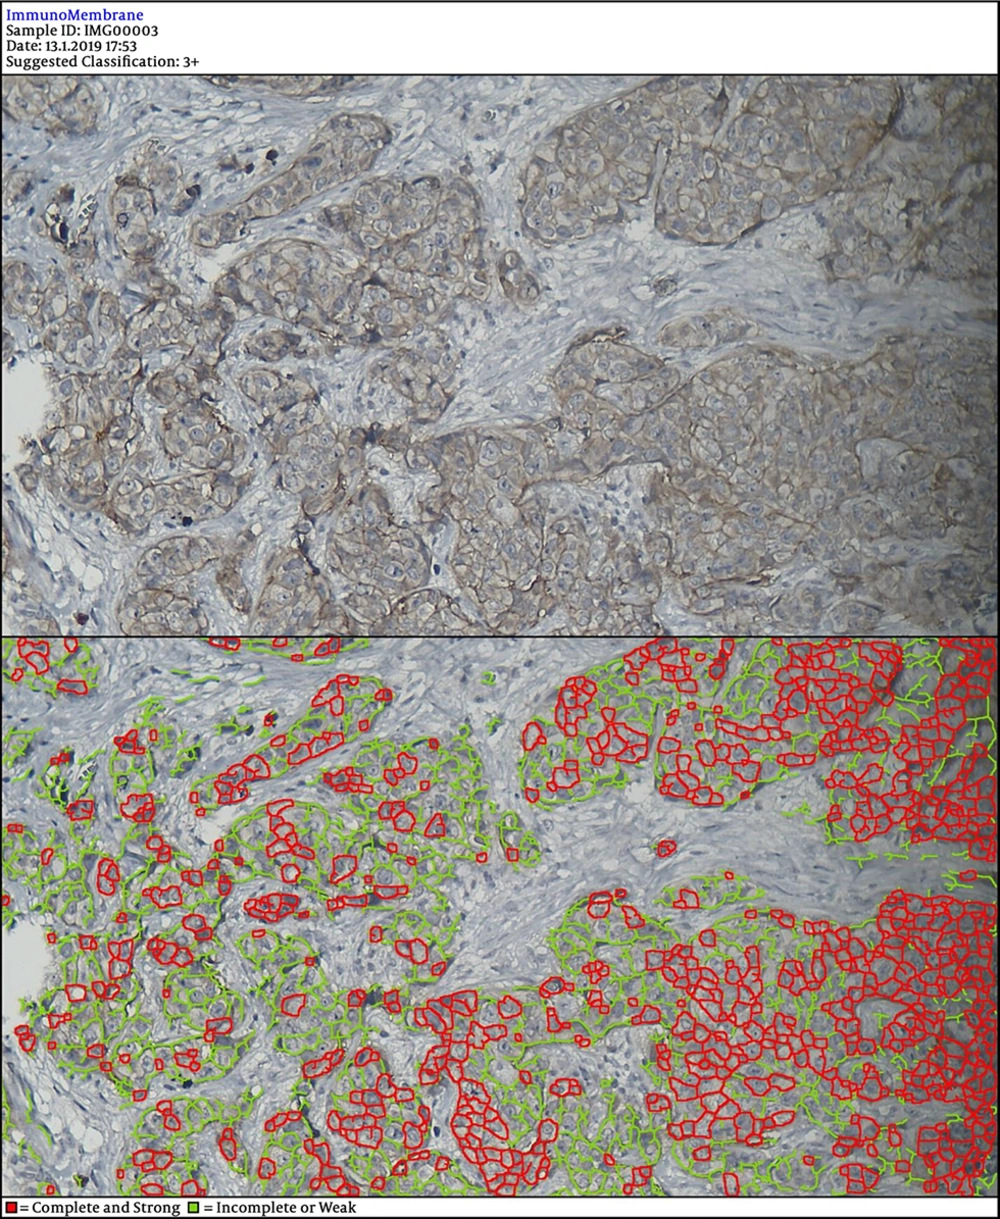
Figure 1.
IDA Suggested Classification: 3+
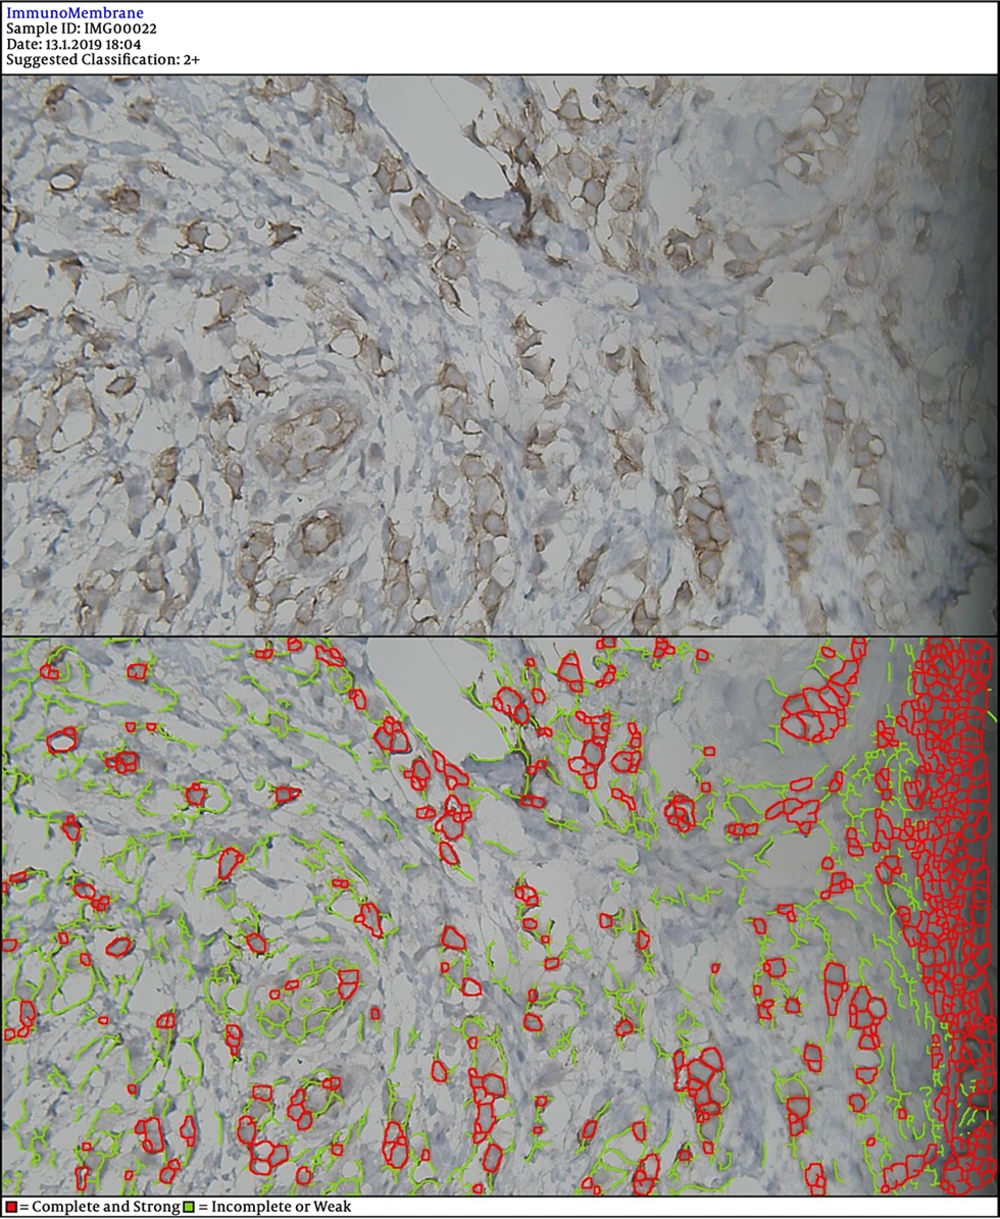
Figure 2.
IDA Suggested Classification: 2+
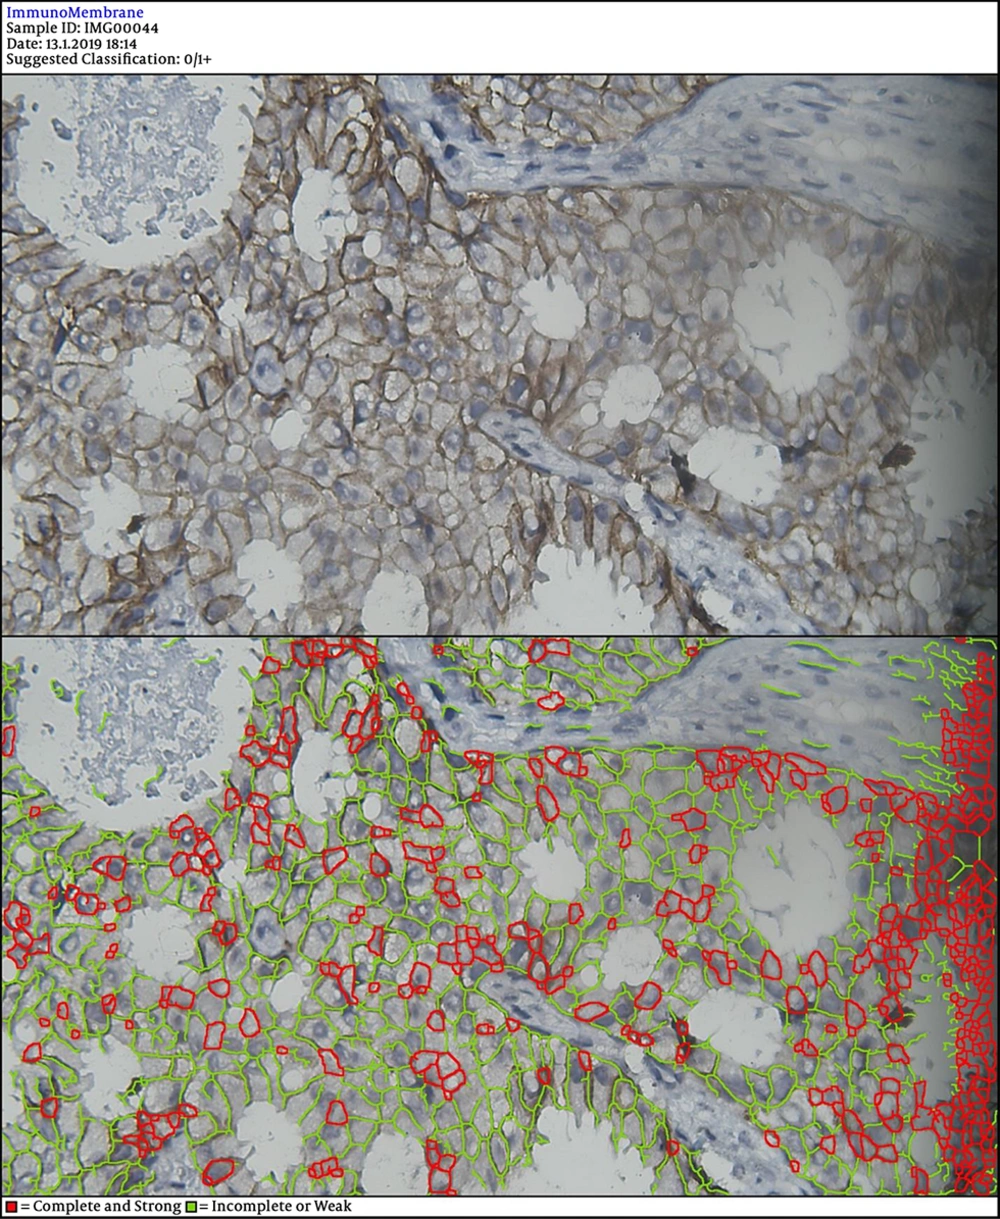
Figure 3.
IDA Suggested Classification: 0/1+
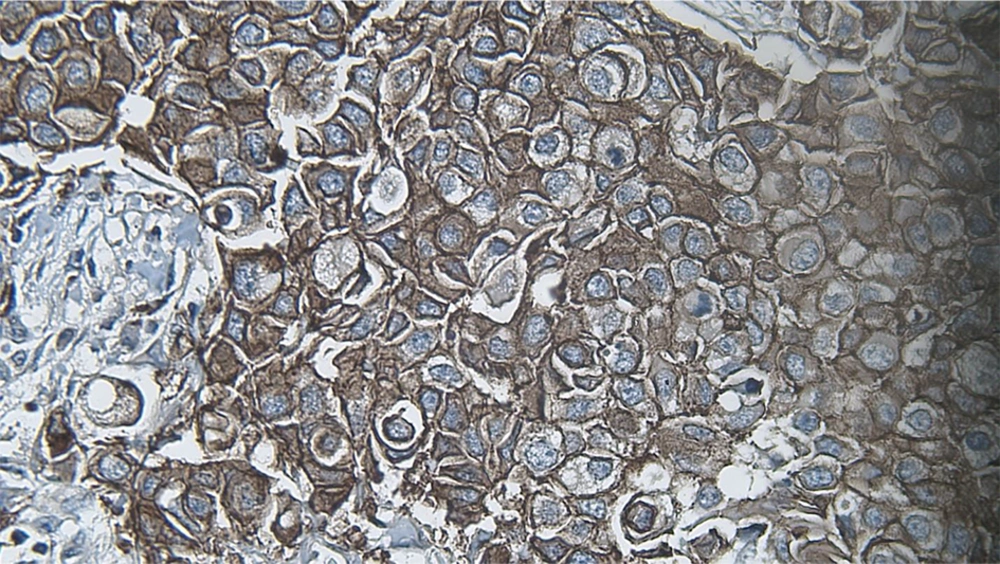
Figure 4.
IDA Classified as HER2 = 3 + While in FISH, it was Negative
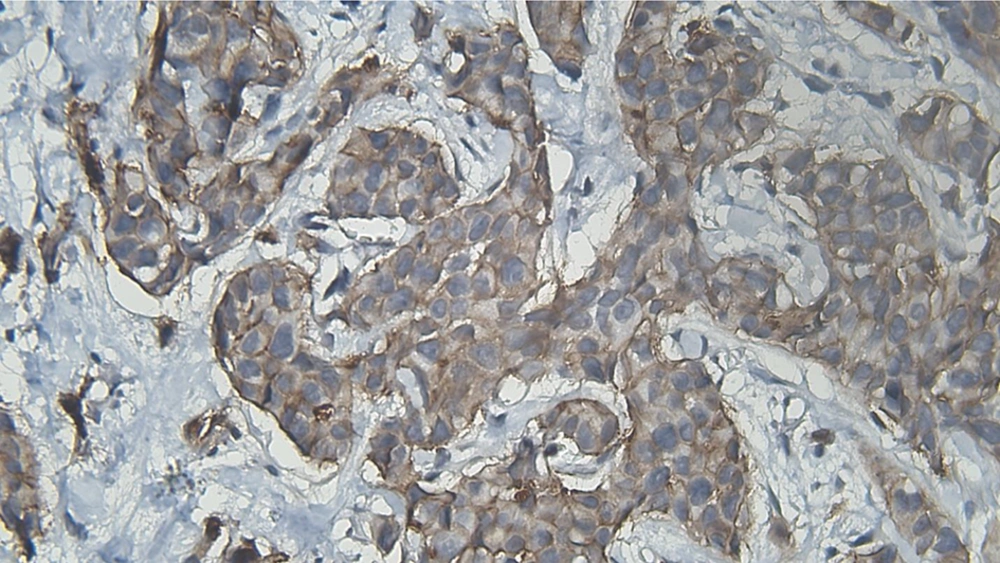
Figure 5.
IDA Classified as Negative While in FISH, it was Positive
Table 1.
Frequencies of Positive, Negative, and Borderline Diagnosis by FISH, DIA < and Pathologists
| Index | Positive Diagnosis | Negative Diagnosis | Borderline Diagnosis |
|---|---|---|---|
| FISH | 47 (78.3 %) | 13 (21.7 %) | |
| DIA | 52 (86.7 %) | 8 (13.3 %) | |
| Pathologist 1 | 5 (8.3 %) | 28 (46.7 %) | 27 (45 %) |
| Pathologist 2 | 4 (6 %) | 25 (42 %) | 31 (52 %) |
Abbreviations: FISH, fluorescence in situ hybridization; DIA, Digital image analysis.
The sensitivity and specificity values of DIA to diagnose HER-2 breast cancer tissues were 46.15% and 97.87%, respectively (Table 2).
Table 2.
Diagnostic Performance of Digital Image Analysis in the Diagnosis of Borderline HER-2 positive (IHC Staining Score 2+) in Invasive Ductal Carcinoma
| Accuracy | Sensitivity | Specificity | Positive likelihood ratio | Negative likelihood ratio | |
|---|---|---|---|---|---|
| DIA | 86.6 % | 46.15 % | 97.87 % | 23 | 0.55 |
Abbreviation: DIA, Digital image analysis.
There was good agreement between two pathologists (kappa= 0.69) and moderate agreement between pathologists and DIA (Table 3).
Table 3.
Agreement Between Different Methods used to Diagnose HER2 Positive Borderline Invasive Ductal Carcinoma on IHC Staining Testing (Score of 2+)
| Coefficient Agreement Kendall tau and Kappa | |
|---|---|
| Agreement between pathologist1 and the gold standard method | 0.413 |
| Agreement between the two pathologist | 0.69 |
| Agreement between pathologist1 and image analysis | 0.42 |
| Agreement between pathologist2 and image analysis | 0.41 |
5. Discussion
In the management of patients with invasive breast cancer, correct biomarker evaluation is critical in making correct therapeutic options. This issue becomes more important when HER2 expression is being considered. DIA in the histopathologic examination of invasive ductal carcinoma helps improve diagnostic accuracy (2).
Several techniques are available for the assessment of HER2 expression, namely IHC, FISH, and CISH. But, as earlier stated each method may be accompanied by shortcomings in the correct diagnosis. Here we used a free web application for DIA of invasive ductal carcinoma samples. This method yielded an accuracy of 86% in the correct diagnosis.
Most of these techniques apply a visual scoring system, which is a semi-quantitative method. But, this approach may be associated with inter-observer variability (11).
In a former study, scores of HER2/neu expression calculated by DIA were studied. For comparison, the FISH method was used. The author reported that modified FISH scores had a significant correlation with DIA scores (12).
A separate investigation including 40 samples of breast cancer (invasive ductal carcinoma) provided data that a significant correlation existed between DIA with HER-2/neu gene expression assessed by FISH. FISH results were quantified as the mean number of fluorescent signals per nucleus, and immunohistochemical slides were read by semiquantitatively assessing membranous immunostaining intensity in tumor cells vs. nonneoplastic breast tissue or quantitatively evaluated by image analysis (13).
Another investigation examined whether using DIA to score HER2 scoring is reproducible or not. Herceptest-stained Tissue Micro Arrays of breast carcinomas were scored (DAKO protocol) by three observers. DIA scores were comparable with consensus scores between three pathologists (14).
The authors of one report applied the free web application we used in this study (i.e., ImmunoMembrane) to interpret borderline HER2 (score of 2+) breast cancer on IHC staining reported six false-positive cases and six false-negative cases. ImmunoMembrane is a free web application to score IHC staining. This software has been used in several studies (15). There was a moderate agreement between pathologists and DIA. This was reported higher in a similar study as kappa of 0.67 (16). In agreement with our results, the mentioned study reported 14.7% of borderline results.
5.1. Limitations
Since WSIs have not been yet approved for primary diagnostics, validating their use for different diagnostic purposes is still mandatory.
In Conclusions DIA had high accuracy in the diagnosis of borderline HER2 positive invasive ductal carcinoma. ImmunoMembrane is a free web application that provides quantitative scoring of IHC staining. This method can help resolve borderline IHC staining. We recommend assessing the use of ImmunoMembrane in the routine assessment of borderline HER2 positive samples.