
1. Background
In diabetes as a metabolic illness, we observe plasma glucose levels more than average resulting from insensitivity to insulin, lack of insulin secretion, or both (1). Recent evidence has shown an increase in the popularity of diabetes around the world today. The World Health Organization (WHO) reports that type 2 diabetes mellitus (T2DM) is directly caused by the death of 1.5 million persons as well as more than 2 million deaths due to diabetes-related diseases (2). Also, as reported by the international diabetic federation (IDF) and WHO, 8.8% of adults in the world suffer from diabetes, and it is expected to increase to more than 10% by 2030 to 2040 (3).
The primary cause of pathogenesis and progression of the diabetes complication is related to increased oxidative stress; more importantly, the very reactive oxygen species (ROS) (4). The products of ROS like superoxide anion (O2-) and hydrogen peroxide (H2O2) induce mitochondrial dysfunction, increase lipid peroxidation, damage DNA and RNA, protein, and cell membranes as well as change in the cellular signaling process (5). Different studies have shown raising in oxidative pressure causes lipid peroxidation in animals and clinical diabetes (6). The ability of organs for decreasing the toxicity of ROS and maintaining the balance of oxidative state depends on the anti-oxidative enzymes such as superoxide dismutase (SOD), catalase, and glutathione peroxidase (GSH-Px) (5). Oxidative stress induces many complications due to diabetes such as retinopathy (7), cardiomyopathy (8), nephropathy (9), neuropathy (10), and reproductive dysfunction (11). Induction of oxidative damage to DNA and genotoxicity due to hyperglycemia is associated with inactivation and a reduction in the expression of DNA repair genes in the mitochondria and nucleus (12). The increasing oxidation damage causes a single and double-strand break of DNA, which results in the fragmentation and apoptosis of DNA (13). Studies have shown a considerable formation of DNA damage in diabetic patients through checking the leukocytes by the comet assay method (10).
L-carnitine (LC) is a structurally amino acid- and vitamin-like that regulates many cellular functions. It is the leading responsible carrier of long chain fatty acids of the cytosol to inner mitochondrial for β-oxidation and energy production (14, 15). This molecule is soluble in water, and it is widespread in the food provided by the animal such as meat, fish, and milk. Also, it synthesizes inside the human body from 2 amino acids, lysine and methionine in the brain, liver, and kidney (16, 17). Our body cannot use the generated energy of the dietary lipid without LC. As a consequence, it will accumulate fatty acid and results in obesity. Moreover, the LC improves lipid metabolism, increases insulin-like growth factor (IGF), and reduces obesity in rats with a high-fat diet (14, 18).
The LC has a potent antioxidant activity (18-20) that inhibits lipid peroxidation, reduces oxidative stress, protects cell membranes, and attenuates DNA damage due to ROS (19, 21). Various studies have indicated a wide range of biological effects, including neuroprotective, anti-inflammatory, cardioprotective, and gastroprotective properties (22). It also reported the genoprotective effect of LC via enhancement of the immune response in elderly rats (18, 23, 24). The therapeutic effect of LC on Alzheimer’s, AIDS disease, and ischemic injury has been demonstrated. Additionally, the anti-apoptotic effect of LC through inhibition of caspase 3 activity has been reported (25).
2. Objectives
In the current study, we first aimed at assaying the probable protective effect of LC on DNA damage in streptozotocin-induced diabetic rats by comet assay, and the other secondary aims were the evaluation of the changes in antioxidant markers and liver function enzymes after the administration of LC.
3. Methods
3.1. Animals
In the present study, we obtained 36 male Wistar rats (200 - 230 g) from the animal laboratory facility of Pharmacy, Isfahan University of Medical Sciences. The animals were maintained under controlled conditions (temperature of 23 ± 2°C, 12: 12 light-dark cycle, and humidity 55%) and allowed free access to food and tap water. The animal experiments were following the medical research ethics committee of Isfahan University of Medical Sciences.
3.2. Chemicals and Reagents
Streptozotocin (STZ) was purchased from Sigma-Aldrich. L-carnitine was a gift from Darou Pakhsh Pharmaceutical Mfg. Co. Ficoll was prepared from the Biowest Company (France). EDTA, H2O2, NaCl, NaOH, Na2CO3, NaH2PO4, Tris, and Triton x-100 were acquired from Merck Co. (Germany). Normal melting point agarose (NMA) was supplied by Cinnagen Co (Iran). Low melting point agarose (LMA), Na2HPO4, KCL, and ethidium bromide were from Sigma Co (USA).
3.3. Animal Groups and Empirical Design
We randomly divided 36 rats into 6 groups:
Group 1: Control and treatment with normal saline at the matched volumes
Group 2: LC treatment with LC at 600 mg/kg (LC)
Group 3: Diabetic rats (STZ)
Group 4: STZ + LC 200 diabetic rats treated with LC at 200 mg/kg.
Group 5: STZ + LC 300 diabetic rats treated with LC at 300 mg/kg.
Group 6: STZ + LC 400 diabetic rats treated with LC at 400 mg/kg.
The treatments were continued once a day for 21 consecutive days. Changes in body weight and blood glucose level were recorded during the study.
3.4. Chemical Induction of Diabetes in Experimental Animals
At first, the animals fasted for 12 h. Then, the diabetes was achieved by intraperitoneal injection of one dose of STZ (65 mg/kg) that was dissolved in freshly 0.1 M citrate buffer (pH 4.5) in ice-cold. To confirm diabetes induction in rats, 72 h after STZ injection, we measured blood glucose, using a glucometer instrument (Easy Gluco, Korea). With blood glucose levels over 250 mg/dL, the animals were considered diabetic.
3.5. Isolation of Lymphocytes
On days 7, 14, and 21 after diabetes, the blood samples were taken from all groups. Blood was collected freshly in a sterilized heparin vial. The whole blood (2 mL) from each rat was diluted 1: 1 with phosphate-buffered saline (PBS) in (pH 7.4) layer over 2 mL of Ficoll. The tube was centrifuged for 30 min at 500 g (without brake). The upper layer that contains plasma was drawn off, using a sterile pipet, and was stored at -21°C to perform other tests. The mononuclear cells were transferred to a sterile centrifuge tube. Then, it was washed with 5 mL of PBS and centrifuged at 200 g for 10 min. The lymphocytes of supernatant were suspended in 1 mL PBS and the amount of 100 μL was used for the comet assay. The whole steps were performed at room temperature.
3.6. Single-Cell Gel Electrophoresis (Comet Assay)
The comet assay procedure was performed under alkaline conditions (26, 27). Briefly, 100 μL of cell suspension was mixed with 100 μL low melting point agarose (1% in PBS) at 37°C and was placed on the pre-coated slides (1% NMP agarose). Then, it is covered with a cover-slip and set at 4°C for 20 min. The cover slip was slowly removed and the slides were lysed in a solution containing 100 mM EDTA, 2.5 M NaCl, 0.2 M NaOH, and 10 mM Tris (pH 10) with freshly prepared 1% Triton x-100 for 40 min. After the lysis, the slides were rinsed with deionized water to remove the detergent and salt. The slides were placed in electrophoresis alkaline buffer (0.3 M NaOH, 1 mM EDTA, pH ≥ 13) for 40 min. Then, the electrophoresis was carried out for 30 min at 300 mA and 25 V in the same buffer. After this stage, the slides were neutralized with 0.4 M Tris (pH 7.5) for 10 min before staining with ethidium bromide (20 μg/mL) and washed in phosphate buffer saline and distilled water. All stages of comet assay were performed in dark conditions and at room temperature. All solutions were prepared freshly and used coldly. The comets were visualized under 400 × magnification, using a fluorescence microscope. For each condition, 100 randomly selected comets (from 3 slides with the same concentration) were scored (28, 29). Tail length and % DNA in tail and tail moment were determined by comet score software (TriTec Corporation, USA, version 1.5). Usually, the tail length was considered the best parameter when a low level of DNA damage is present, and the percentage of DNA in the tail is preferred in the broadest range of damage (30).
3.7. Measurement Function of Liver Enzymes
The level of plasma alanine aminotransferase (ALT) and aspartate aminotransferase (AST) were determined with a multifunctional biochemistry analyzer (auto analyzer Hitachi-917, Roche).
3.8. Measurement of Oxidative Stress Markers
The activity of reduced glutathione (GSH) and SOD were measured by the ELISA technique, using commercial kits (ZellBio GmbH, Germany) according to the manufacturer’s instructions.
3.9. Statistical Analysis
The results were expressed as mean ± standard error of the mean (SEM) and statistical analysis was performed with GraphPad Prism (GraphPad Software, CA, USA). The differences between the groups were analyzed, using one-way analysis of variance (ANOVA) followed by Tukey’s post hoc. The differences were considered statistically significant at P < 0.05.
4. Results
4.1. Effect of L-carnitine on Body Weight and Blood Glucose Level
We observed a significant decrease in final body weight in all groups except the LC-treated group (P < 0.01). The blood glucose level on day 1 of the experiment was normal, and there was no difference between groups. Injection of STZ produced a marked increase in the blood glucose level. Moreover, the blood glucose level was identical for the LC group at the end of the assessment (Table 1). The blood glucose levels were significantly increased in the diabetic and STZ + LC group compared to non-diabetic rats on 7, 14, and 21 days after the induction of diabetes (P < 0.05).
Table 1.
The Blood Glucose Level in Control, L-carnitine, and STZ Groups a
| Groups | Blood Glucose Level (mg/dL) | |||
|---|---|---|---|---|
| Day 1 | Day 7 | Day 14 | Day 21 | |
| Control | 108.00 ± 3.21 | 110.00 ± 2.30 | 106.33 ± 4.91 | 111.33 ± 4.91 |
| L-carnitine | 116.00 ± 3.78 | 122.00 ± 3.60 | 115.00 ± 3.05 | 114.70 ± 3.52 |
| STZ | 115.00 ± 4.61 | 418.70 ± 26.66 b | 499.00 ± 35.08 b | 561.00 ± 13.87 b |
a The results are shown as values ± standard error of the mean (SEM) for six rats per group.
b There is a significant difference compared to the control group (P < 0.001).
The blood glucose level in treated diabetic rats with LC 300 and 400 mg/kg per day showed a significant decrease compared to the STZ group (P < 0.001) (Figure 1).
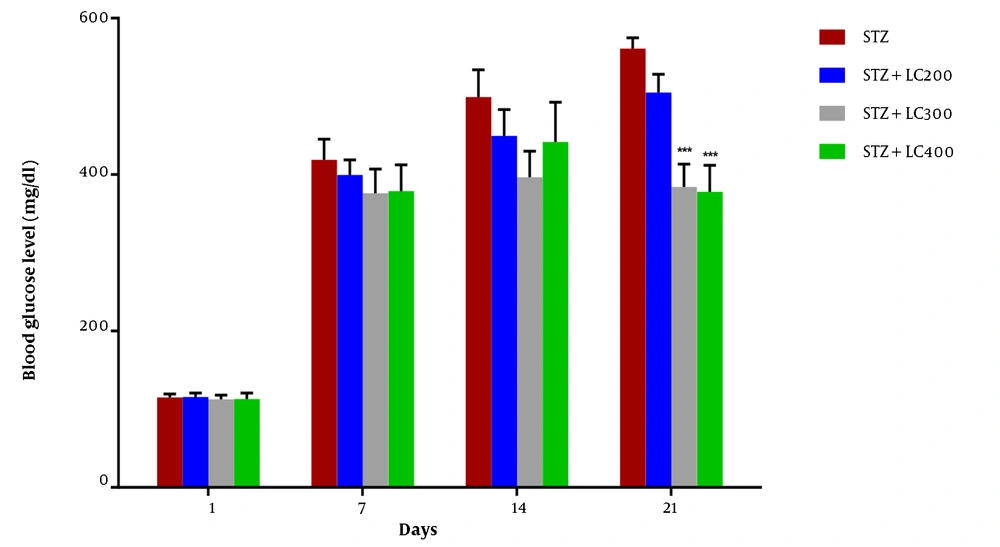
Figure 1.
Effect of L-carnitine (200, 300, and 400 mg/kg) on blood glucose level of diabetic rats (STZ) at 1, 7, 14, and 21 days. The results were shown as values ± standard error of the mean for six rats per group. Sign (*) indicates a significant difference compared to the STZ group on the same days (P < 0.001).
4.2. Evaluation of DNA Damage by Comet Assay
The results of the genoprotective effects of LC on DNA damage in diabetic rats were shown in Figures 2 to 4. We studied the tail length, % DNA and tail moment of comets in 7, 14, and 21 days after the induction of diabetes. The data indicated a significantly higher level of DNA damage on day 21 rather than in other groups (P < 0.001). Furthermore, LC treatment in the STZ group led to a remarkable decrease in genotoxicity compared to the diabetic group (P < 0.001).
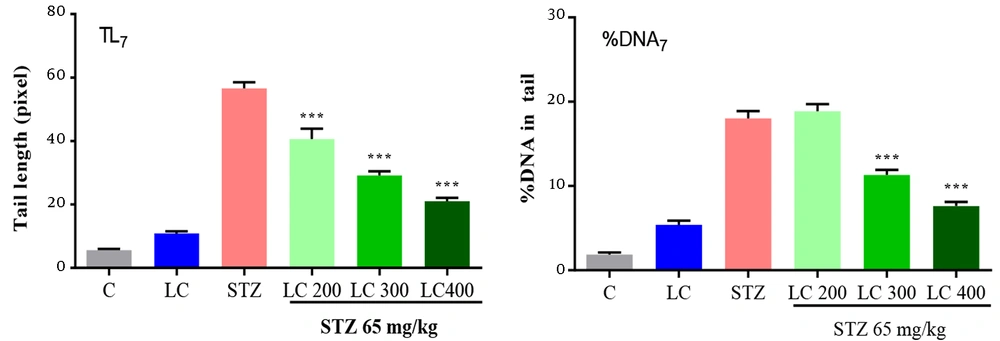
Figure 2.
Effect of L-carnitine (LC) on DNA damage of day 7 after the induction of diabetes. TL7: Tail length, % DNA7: % DNA in tail, TM7: Tail moment. C: Treated rats with normal saline, LC: Treated rats with LC 600 mg/kg per day, STZ: Diabetic rats, and treated diabetic groups with LC 200, 300, and 400 mg/kg per day. The results are shown as values ± standard error of the mean for six rats. Sign (***) shows a significant difference compared to the STZ group (P < 0.001).

Figure 3.
Effect of L-carnitine (LC) on DNA damage of day 14 after the induction of diabetes. TL14: Tail length, % DNA14: % DNA in tail, TM14: Tail moment. C: Treated rats with normal saline, LC: Treated rats with LC 600 mg/kg per day, STZ: Diabetic rats, and treated diabetic groups with LC 200, 300, and 400 mg/kg per day. The results are shown as values ± standard error of the mean for six rats. Signs (**) and (*) show a significant difference compared to the STZ group (P < 0.01) and (P < 0.05).
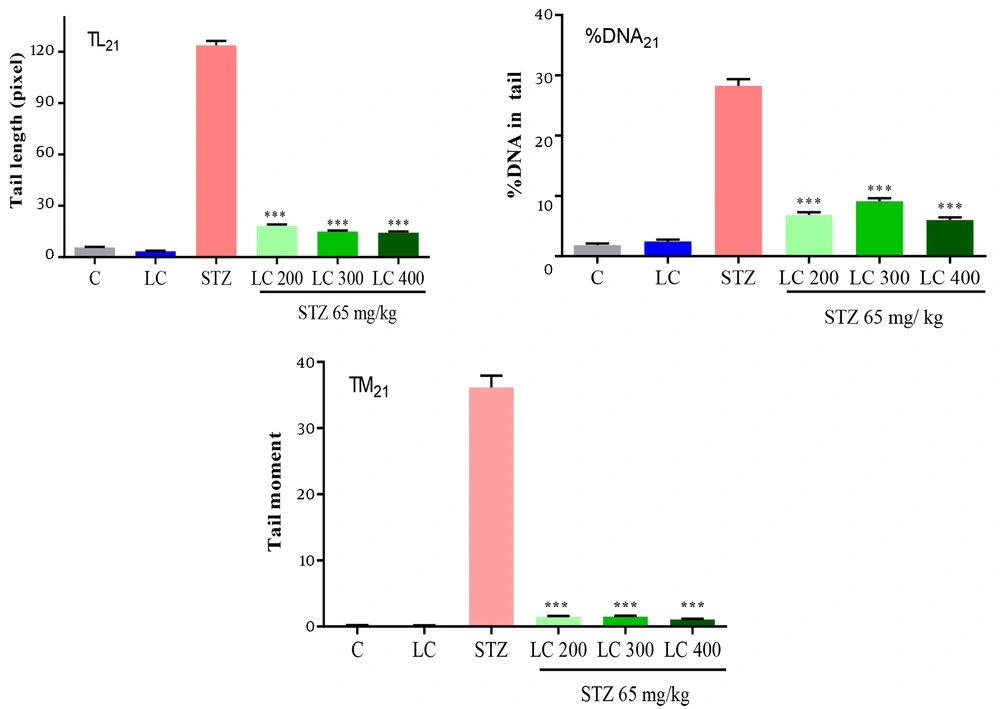
Figure 4.
Effect of L-carnitine (LC) on DNA damage of day 21 after the induction of diabetes. TL21: Tail length, % DNA21: % DNA in tail, TM21: Tail moment. C: Treated rats with normal saline, LC: Treated rats with LC 600 mg/kg per day, STZ: Diabetic rats, and treated diabetic groups with LC 200, 300, and 400 mg/kg per day. The results are shown as values ± standard error of the mean for six rats. Sign (***) shows a significant difference compared to the STZ group (P < 0.001).
4.3. Effect of L-carnitine on Liver Function and Oxidative Stress Markers
As shown in (Figure 5), ALT and AST activities were measured in all groups of rats. The plasma level of ALT and AST were significantly higher in the diabetic group compared to the control group (P < 0.001). Treated diabetic rats with LC improve the level of liver enzyme markers. The level of GSH and SOD in all groups was summarized in Table 2. These levels in the LC group were higher than in the control group (P < 0.05). The daily administration of LC 200, 300, and 400 mg/kg to the diabetic rats group caused a reversal in GSH level and SOD activity compared to the diabetic group (P < 0.001).
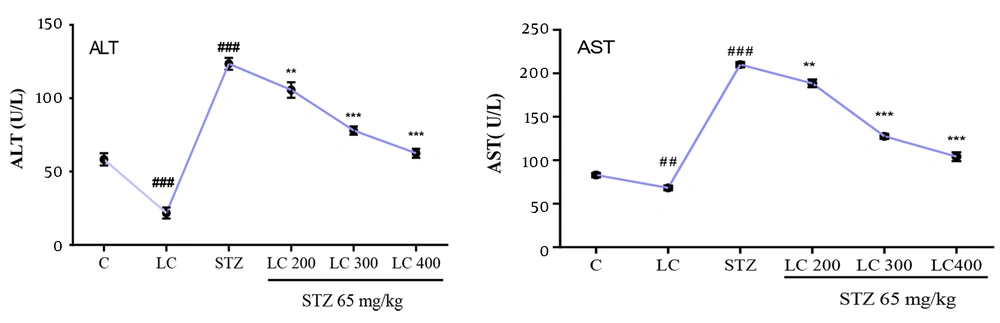
Figure 5.
Effect of L-carnitine (LC) on plasma levels of alanine aminotransferase (ALT) and aspartate aminotransferase (AST). C: Treated rats with normal saline, LC: Treated rats with LC 600 mg/kg per day, STZ: Diabetic group and treated diabetic groups with LC 200, 300, and 400 mg/kg per day. The results are shown as values ± standard error of the mean for six rats per group. Sign (##) and (###) show a significant difference compared to the control group (P < 0.01) and (P < 0.001) and signs (**) and (***) show a significant difference compared to the STZ group (P < 0.01) and (P < 0.001).
Table 2.
Effect of L-carnitine on Oxidative Stress Markers a
| Parameters | Control | L-carnitine | STZ | Diabetic Rats + L-carnitine (mg/kg) | ||
|---|---|---|---|---|---|---|
| 200 | 300 | 400 | ||||
| Glutathione (μmol/L) | 129 ± 14.06 | 132 ± 6.01 b | 20 ± 3.61 c | 28 ± 1.06 d | 32 ± 5.41 d | 94 ± 4.87 d |
| Superoxide Dismutase (U/mL) | 1.56 ± 0.02 | 1.61 ± 0.06 e | 1.18 ± 0.04 c | 1.31 ± 0.06 d | 1.37 ± 0.05 d | 1.41 ± 0.05 d |
a The results are shown as values ± SEM for six rats per group.
b P < 0.05, significant difference compared to the control group
c P < 0.001, significant difference compared to the control group
d P < 0.001, significantly decreased compared to the STZ group
e P < 0.01, significant difference compared to the control group
5. Discussion
Diabetes is one of the most common problems in people’s health systems all over the world (31). In this disease, an imbalance between antioxidant mechanisms and ROS production resulted in DNA damage and oxidative stress (32). As a consequence of exposure to excessive amounts of ROS, the risk of damage to macromolecules was significantly increased (33). Streptozotocin is widely used to induce diabetes in animal models (34). Streptozotocin led to the dysfunction of pancreatic β-cells. As a result, it does not produce insulin and diabetes will be created (35).
The 75% of LC obtains from the diet, and 25% of it synthesize in the human body (8). The vital role of LC in the mammalian body is the facilitating transportation of long-chain fatty acids from the cytosol to inner mitochondria for β-oxidation and energy production (16). Besides, it has been shown that the beneficial role of LC in different human disease states is associated with mitochondrial decay and oxidative stress (36). In our study, diabetic animals received LC 200, 300, and 400 mg/kg daily for 3 weeks. In the STZ group and diabetic rats treated with LC, we observe increased urine output and water consumption. The protective effect of LC was described both in vitro and in vivo in previous studies. In vitro studies have demonstrated LC protects the neuronal cell against ischemic injury (37). In vivo research has exhibited the protective effect of LC in infertility (38, 39), cardiomyopathy (40), acute liver damage (41, 42), and kidney injuries (43). Furthermore, Mescka et al. reported that LC clinically decreases DNA damage in treated Maple syrup urine disease (MSUD) patients (44).
In the current study, the injection of a single dose of STZ (65 mg/kg) induces a significant increase in blood glucose levels and a decrease in body weight, respectively. However, Baldissera et al. (45) found the administration of low dose STZ (30 mg/kg i.p) with a high-fat diet for 8 weeks and caused an increased weight in diabetic rats. Moreover, treatment of diabetic rats with LC 300 and 400 mg/kg/day after 21 days led to a remarkable decrease in blood glucose than diabetic rats. However, there were no statistically significant changes in the values of body weight and blood glucose level in the LC group. This result was confirmed by other reports in previous experimental studies (20).
In this work, we focused on the protective effect of LC on DNA damage in diabetic rats. The comet assay is a sensitive, rapid, and reliable method for DNA damage analysis. The comet assay can be used in vitro, in vivo, and human clinical studies for the detection of strand breaks (46). Although a direct correlation between diabetes and DNA damage have reported before (47), treating diabetic rats with LC and using comet assay for detection of DND damage at 7, 14, and 21 days after induction diabetes is a new approach. Analysis of DNA strand breaks by comet assay clearly showed the extent of genotoxicity in the diabetic group increased with time and remarkably increased to a maximum at the end of 21 days. Also, in this study, we showed consumption of LC 600 mg/kg per day could decrease genotoxicity parameters such as % DNA in the tail, tail length, and tail moment with increasing exposure time. In the diabetic rats treated with LC, we observed recovery or a significant decrease in parameters of DNA damage over time. Evidence suggests the protective effect of LC in peripheral blood human lymphocytes after exposure to oxidative agents (20). Also, de Moraes et al. reported the protective effects of LC on DNA damage in fatty acid oxidation disorders (FAOD) patients (48).
Alanine aminotransferase and AST were considered important indexes, indicating hepatocellular injuries (49). Sometimes liver is injured or damaged, and ALT and AST are released into the circulation from the cytosol and subcellular organelles of hepatocytes and their activities increase in the blood (50).
Our data revealed a substantial increase in the level of ALT and AST in diabetic rats, similar to other studies (51, 52). In line with our findings, they reported a significant reduction in ALT and AST levels after oral supplementation with LC (53). Also, treatment with LC in the STZ group ameliorates enzyme liver functions and our results agree with previous studies (54).
On the other hand, ROS has a central role in diabetes. In the first, ROS are removed, using antioxidant markers such as SOD and glutathione, either by administration of these antioxidation compounds or by increasing their in vitro activities. In the second, oxidant radical production and accumulation are prevented (55). The major enzymatic antioxidant is SOD, which scavengers superoxide hydrogen peroxide and molecular oxygen. Glutathione is a major nonenzymatic antioxidant found in almost all living cells, which is a biomarker of redox imbalance at the cellular level (56). Result reported that GSH and SOD level was decreased in type 2 diabetic patients compared to controls (57).
L-carnitine improves oxidative stress in STZ-induced diabetic rats (58). In the present study, administration of LC in diabetic rats decreases oxidative stress as evident from the GSH and SOD levels. Ibrahim et al. reported that LC increases GSH levels and the activity of antioxidant enzymes such as SOD, too (59). Furthermore, reduction in the level of antioxidation compounds in the diabetic group and elevation in the treated diabetic group with LC show scavenging effects of LC against ROS production during oxidative stress (17, 18).