1. Background
Human tumors can remain undetectable at the minimal residual level for even decades because of a balance between neoplastic cell proliferation and apoptosis, known as tumor mass dormancy, or remaining cancer cells in the G0 phase, known as tumor cell dormancy (1). Although cellular intrinsic alterations acquired during leukemogenesis are required for their maintenance, cellular and molecular factors within the tumor microenvironment significantly regulated this phenomenon (2, 3). Among different tumor microenvironments, bone marrow succeeded in attracting the attention of numerous cancer researchers because of its profound role in cell dormancy, drug resistance, and cancer relapse of metastatic cancer cells, as well as leukemias (4).
In brief, the bone marrow (BM) space is considered to have two different specialized microenvironments known as endosteal and perivascular niches, which are in close contact with low-cycling, primitive, and highly proliferative, more differentiated cells, respectively (5). The endosteal niche mainly comprises heterogeneous populations of stromal cells, including mesenchymal stem cells (MSCs), osteoblasts, and macrophages, which form intricate and dynamic interactions with both HSCs and LSCs through direct contact and release of soluble factors such as extracellular vesicles (6). Based on findings obtained from normal bone marrow, alterations of the bone marrow stromal cells (BMSCs) were tested and found to facilitate hematologic abnormality formation (6, 7). More interestingly, a study on patients with MDS and AML revealed that overall mortality and leukemia-related mortality occur more frequently in patients with MSCs genetic aberrations (8). Examining the BMSCs in leukemia may, then, provide opportunities for altering it in such a way that it becomes less hospitable to malignant cells (7).
Although the introduction of targeted therapy in APL and CML patients profoundly improved their outcome and survival rate, the risk of disease relapse and resistance after discontinuation of treatment remains between 20 to 30% for APL patients treated with ATRA or ATO (9), and about 30 to 70% for CML patients who achieve deep molecular response (10). The risk of treatment resistance after relapse in both CML and APL, the risk of coagulopathy after APL relapse, and the side effects of long-term use of TKIs are strong motives to find new approaches for the eradication of leukemic stem cells.
The effects of different environmental factors could be recorded in cellular memory through epigenetic changes (11, 12). In cancers, regardless of whether the alterations are genetically or epigenetically, they exert pleiotropic effects on gene expression. So in this study, we checked the effect of co-culture of BMSCs on mRNA expression of quiescence regulators, acting through cell cycle exist, hypoxia induction, growth inhibitory signaling pathway, autophagy initiation, and establishing tumor dormancy in the bone marrow (13-21). Alongside quiescence regulators, we also measured the expression of p210 oncogene in K562 and bcr1 in NB4 cells as a factor that determined the oncogene dependence of leukemic cells.
Because of the reversible nature of the epigenome, several classes of drugs targeting epigenetic aberrations have emerged, particularly for the treatment of myeloid malignancies with widespread epigenetic changes (22). Panobinostat is an FDA-approved histone deacetylase (HDAC) inhibitor that was recently used in the treatment of different hematologic malignancies and solid tumors (23). Interestingly, it has been indicated that panobinostat can be effective in abrogation of persistent senescent cells, which accumulated after chemotherapy, through reversing Histone 3 acetylation and re-expression of epigenetically silent genes (24). Since another and more important non-proliferative state of malignant cells is quiescence, we speculate whether inhibition of HDAC is a rational strategy for targeting this population in leukemias.
2. Objectives
Based on this observation and given the profound role of BMSCs in the development, progression, and relapse of leukemia, in this work, we sought to investigate the effect of most BMSCs on cell dormancy, expression of the oncogenic transcripts, and quiescence related genes, and finally to examine the efficacy of panobinostat in attenuating the effects of stromal cells upon NB-4 and K-562 cell lines.
3. Methods
3.1. Materials
Mouse monoclonal anti-human CD73, CD90, CD105, CD45, CD34, CD13, CD33, HLA-DR, CD117, CD133, CD11b, CD11c, Ki-67 (all from Dako, Denmark), CD14 (Beckman Coulter, USA), CD86 (Abcam, USA), and CD163 (R&D Systems, UK), Annexin V-FITC apoptosis detection kit and Acridine Orange (Merck, Darmstadt, Germany) were used for flow cytometric measurements. Cell culture materials were DMEM, RPMI, IMDM, L-glutamine, Penicillin-Streptomycin, FBS (all from Gibco, USA), Ficoll-Hypaque Lymphodex (Inno-Train, Germany), and trypan blue (Sigma-Aldrich, USA). For molecular analyses, Taq DNA Polymerase 2x Master Mix RED and Real Q Plus Master Mix Green (Ampliqon Copenhagen, Denmark), the High Capacity cDNA Reverse Transcription Kit (Thermo Fisher Scientific, USA), TRIzol LS (Thermo Fisher Scientific, USA), and primer and stem-loop Oligonucleotides (Metabion, Germany) were used. We used Rotor-Gene 6000 cyclers for RTq-PCR and Attune Flow Cytometer for analyzing the CD markers.
3.2. Patients, Isolation of MSCs and Macrophages, and Cell Lines
MSCs and human macrophages were isolated from bone marrow and apheresis samples of 6 subjects with normal hematopoiesis, respectively. Informed consent was obtained from every participant. Bone marrow samples were taken from patients with non-hematologic disorders, who underwent BM aspiration for evaluation of metastasis. Apheresis samples were collected from donors of allogeneic HSCs transplantation. Subjects were referred to Taleghani Hospital (Tehran, Iran).
For isolation of MSCs, BM mononuclear cells were separated, using ficoll histopaque and cultured at a density of 1 × 10⁶ cells per mL in Iscove’s modified Dulbecco’s medium (IMDM) media supplemented with 10% heat-inactivated FBS, 2 mmol/L L-glutamine (Gibco BRL) and 1% penicillin and streptomycin. After 1 week, suspended cells were removed and the adherent ones were cultured with fresh media to reach a 90% confluency. The confluent cells were detached, using a 0.5% trypsin (w/w) and 0.1% EDTA (w/w) solution, replated in a T75 flask, and used for experiments after 3 to 5 expansion passages to ensure depletion of monocytes/macrophages and to avoid replicative senescence due to prolonged culture conditions. MSCs were assessed by flow cytometry for the expression of the MSCs markers CD73, CD90, CD105, and CD133 and the absence of the hematopoietic cells markers CD45, CD34, and CD14.
For differentiation of monocyte-derived macrophages, apheresis isolated PBMCs were plated at a density of 4 × 10⁶ cells per mL in RPMI with 10% FBS, 2 mmol/L L-glutamine (Gibco BRL), and 1% penicillin and streptomycin. After 24 hours, floating cells were washed away and attached cells were further cultured in RPMI with 10% FBS (Bioclear) in 5% CO2, 95% humidity at 37°C. These cells were used for experiments after 4 days. One T25 flask of differentiated macrophages was trypsinized and detached by scraper and, then, analyzed for expression of CD14, CD11b, CD11c, CD86, and CD163 in comparison with their respective isotype controls.
We used the osteosarcoma-derived MG-63 cell line as a model of human immature osteoblast cells. The MG-63 cells share characteristics with primary osteoblasts, such as the expression of most integrin subunits, a similar organization of internal cellular structures, and adhesion to physicochemically modified surfaces. Thus, they represent a very suitable cell model for bone research (25). The MG-63 cells were cultured in DMEM, supplemented with 10% FBS and 1% antibiotic.
For investigation of the crosstalk between different bone marrow and stromal cells with leukemic cells, we used an APL-derived cell line (NB4, positive for PML-RARA, bcr1 transcript) and human CML derived K562 cells (positive for BCR-ABL, p210 transcript).
3.3. 3-(4,5-dimethylthiazol-2-yl)-2,5-diphenyltetrazolium Assay
After 10 days of co-culture of NB4 and K562 cell lines with stromal cells, 5 × 10³ leukemic cells were harvested, seeded in 96 well plates, and treated with different concentrations of panobinostat (10, 20, 40, 60, and 80 nM) for 24 h and 48 h. Then, the media was removed from each plate, cells were incubated with MTT ((4,5-dimethylthiazol-2-yl)-2,5-diphenyltetrazolium) solution (thiazolyl blue tetrazolium bromide Sigma, Aldrich), and finally, after dissolving the MTT crystals, the optical density (OD) was measured by the ELISA reader (Biotech ELX800, USA) at a wavelength of 570 nm. The OD of co-cultured cells was compared with monoculture cells for evaluating the effect of stromal cells on drug resistance of the leukemic cells.
3.4. AnnexinV/PI Staining
The OD values of the MTT assay could be reduced by the growth inhibitory effects of drugs, induction of apoptosis, and finally reduction of the metabolic activity of cells due to a reduction in mitochondria count or function. To determine the apoptotic effect of panobinostat on NB4 and K562 cells in monoculture and co-culture with stromal cells, briefly, cells were treated with the concentration of drug causing IC50 in monoculture evaluating with MTT assay. Next, the apoptotic effect was measured by Annexin V-FITC/PI apoptosis detection kit following the instructions of the manufacturer (bioscience Annexin V Apoptosis Detection Kit).
3.5. G0 Subphase Analysis
Under certain circumstances in contact with endosteal niches, cells can enter the G0 subphase, where the cells are neither dividing (unreplicated chromosomes) nor committed for proliferation (the lowest Ki-67 index). To define the effect of stromal cells on G0 subpopulations of NB4 and K562 cell lines, the cells were stained with fluorescent DNA dye (PI) and Ki-67 antibodies. After treating the cells with the same concentration of panobinostat used for the Annexin V-FITC/PI assay, pellet cells were formed in 10 mL PBS by centrifuging 5 min at 200 × g. cells were resuspended in 0.5 mL PBS and fixed using 4.5 mL pre-chilled 70% ethanol while vortexing. After 2 h incubation at -20°C, the ethanol was removed and pellet cells rinse with 5 mL FACS buffer and finally stained with Ki-67-FITC antibody and PI and the result was assessed by flow cytometry at a low flow rate. Cells with the lowest Ki-67 expression and DNA content were considered G0. The sub-G1 subset was ignored in analyses to only evaluate the cell cycle status of viable cells.
3.6. RNA Analysis, cDNA Synthesis, and RT- qPCR Assay
To determine the effect of co-culture on mRNA expression of genes that could induce the G0 phase including cell cycle regulators p27 and p21, hypoxia-responsive HIF-1α, cell signaling pathway TGF-β, autophagy initiator Beclin-, and growth factor Gas6, the total RNA of the cell lines was extracted by TRizol™ Reagent (Qiagen) and the cDNA was synthesized following manufacturer's instructions (Thermo Scientific). The concentration and purity of extracted RNAs were evaluated by Nano-drop (Thermo Scientific, USA). The relative expression of bcr1 and p210 was measured in NB4 and K562 cell lines, respectively. 1 µg of RNA was used for cDNA synthesis. ABL gene expression, as the control gene, was analyzed on synthesized cDNA. The real-time PCR assay was carried out, using SYBR™ Green Real-time PCR Master Mixes (Amplicon, Denmark). Primers used in this study were designed by Gene Runner version 3.05 (Hastings Software, Inc.) and the specificity of sequences was analyzed, using BLAST in GenBank data (Table 1). The fold change of each gene in co-cultured cells compared with monoculture ones was calculated based on the 2-ΔΔCT relative expression formula.
3.7. Statistical Analysis
Experimental data were expressed by mean ± standard deviation (SD) of 3 independent experiments. A one-way ANOVA was performed for multivariate data that were measured at the same time and paired t-test for bivariate data. For evaluation of the effects of interventions during different times, repeated measure ANOVA was performed. A probability value was defined significant when *P < 0.05, **P < 0.01. The flow cytometry results were analyzed by the FlowJo software (v.7.6.1).
4. Results
4.1. Morphology and Immunophenotyping of MSCs and MQ
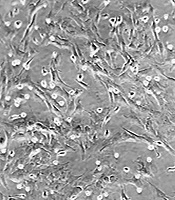
To verify the entity of harvested MSCs, their morphology and CD-markers were analyzed, using invert microscopy and flow cytometry, respectively. Spindle shape MSCs were observed after incubation of the culture flask (approximately 3 - 4 days), which indicated these cells adhered to the flask (Appendix 1 in the Supplementary File). When the spindle shape cells became 70 to 90% confluent, cells were ready to subculture and treatment with panobinostat. Flow cytometry results indicated the expression of CD44, CD90, CD105, and CD73 on the surface of MSCs and the absence of CD11b, CD45, CD34, and HLA-DR (Appendix 2 in the Supplementary File), confirming that these cultured cells were MSCs.
The majority of isolated human macrophages had the classical “fried egg” morphology with multiple projections and the rarity of cells were spindle-like in shape (Appendix 1 in the Supplementary File). In flow cytometry, dissociated cells were positive for CD11b, CD11c, CD14, CD163, and CD86 and negative for CD34 (Appendix 2 in the Supplementary File) and MSCs markers (data not shown).
4.2. Stromal Cells Could Confer Resistance Phenotype to Leukemic Cells
BMSCs can facilitate the growth of leukemic cells and offer a chemo-protective milieu for them (26). To test whether stromal cells could lead to panobinostat resistance in leukemic cells, three co-culture systems using MSC, osteoblast, and MQ with NB4 and K562 cell lines were set. After 10 days of co-culture, we found that the sensitivity of leukemic cells was profoundly influenced as compared with cell culture alone. Although we found an overall resistance mediated by all stromal cells, the effect of MQ was lowest on both cell lines. We also found that osteoblast and MSC displayed the highest conferring resistance for CML and APL cells, respectively (Figure 1). Based on this evidence that the leukemic cells were isolated from stromal cells before testing the drug sensitivity, we concluded that the drug resistance phenotype probably was imprinted in the cells (maybe through epigenetic alterations) and that direct contact with stromal cells is not a requirement for drug resistance thereafter.
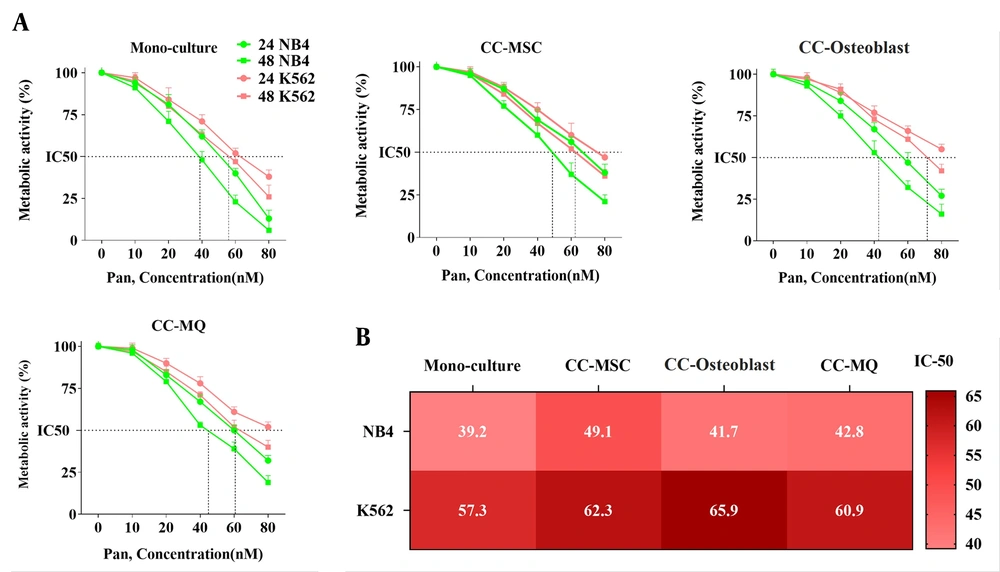
Figure 1.
Panobinostat confers growth inhibitory effect both in monoculture and co-culture models. (A) Panobinostat caused a 50% reduction in the metabolic activity of NB4 and K562 cells in a dose-dependent and time-dependent manner. Co-culture with stromal cells confers resistance to panobinostat at both times. (B) The exact IC50 of panobinostat at 48 h incubation is shown for NB4 and K562 cell lines in monoculture and co-cultured with different stromal cells.
4.3. Stromal Cells Could Reduce the Panobinostat-Mediated Apoptosis of Leukemic Cells
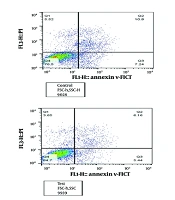
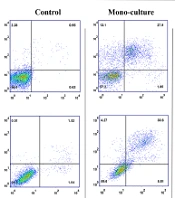
To determine whether co-culture can reduce cell death mediated by panobinostat, the apoptosis rate of NB4 and K562 cells that were co-cultured with stromal cells for the last 10 days before the experiment was compared with control cells when were incubated with the IC50 dose of panobinostat. The data of the NB4 cell line showed that the IC50 concentration of panobinostat failed to induce comparable apoptosis in cells cocultured with MSC to that of cultured alone (P < 0.01). However, the apoptosis rate was also lower in cells co-cultured with osteoblast and MQ, the difference did not reach statistical significance (Figure 2). In contrast to NB4, all stromal cells substantially halted the panobinostat-induced apoptosis of K562 cells (Figure 2).
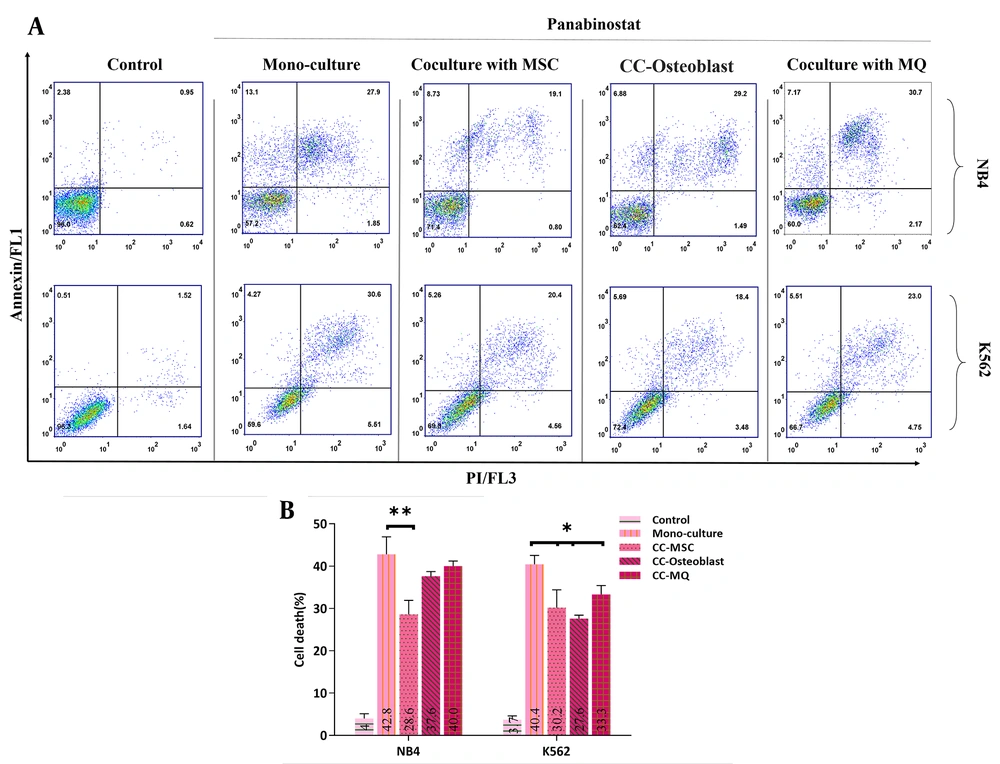
Figure 2.
Panobinostat induces programmed cell death in leukemic cells. Panobinostat could induce cell death in NB4 and K562 cell lines after treatment with IC50 concentrations. Stromal cells reduce the apoptotic effect of panobinostat more significantly in the K562 cell line.
4.4. Stromal Cells Induced a Reversible Leukemic Cells Quiescence State
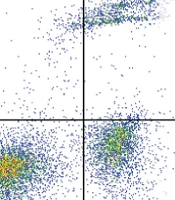
Stromal cells could provide a niche-dependent, oncogene-independent microenvironment for leukemic cells, which is also involved in the induction of cell dormancy (27). Using Ki-67 and DNA staining, we found that stromal cells could significantly increase the cell fraction in the G0 subphase either in NB4 or K562 cells (Figure 3 and 4). MQ was the weakest inducer of quiescence while the MSC and osteoblast had the highest impact on NB4 and K562 quiescence, respectively. Using panobinostat, we found that all G0 subsets significantly reduced at IC50 concentration, except for K562 cells co-cultured with MSCs (Figure 3 and 4). The expression patterns of quiescence regulator genes showed a broad alteration after co-culture with stromal cells (Figure 5A). As the expression of TGF-β, HIF-1α and Beclin-1 were more significantly elevated in K562 cells co-cultured with MSC compared to other cells, we speculate these pathways are the key players of rigid cell quiescence unresponsive to panobinostat treatment.
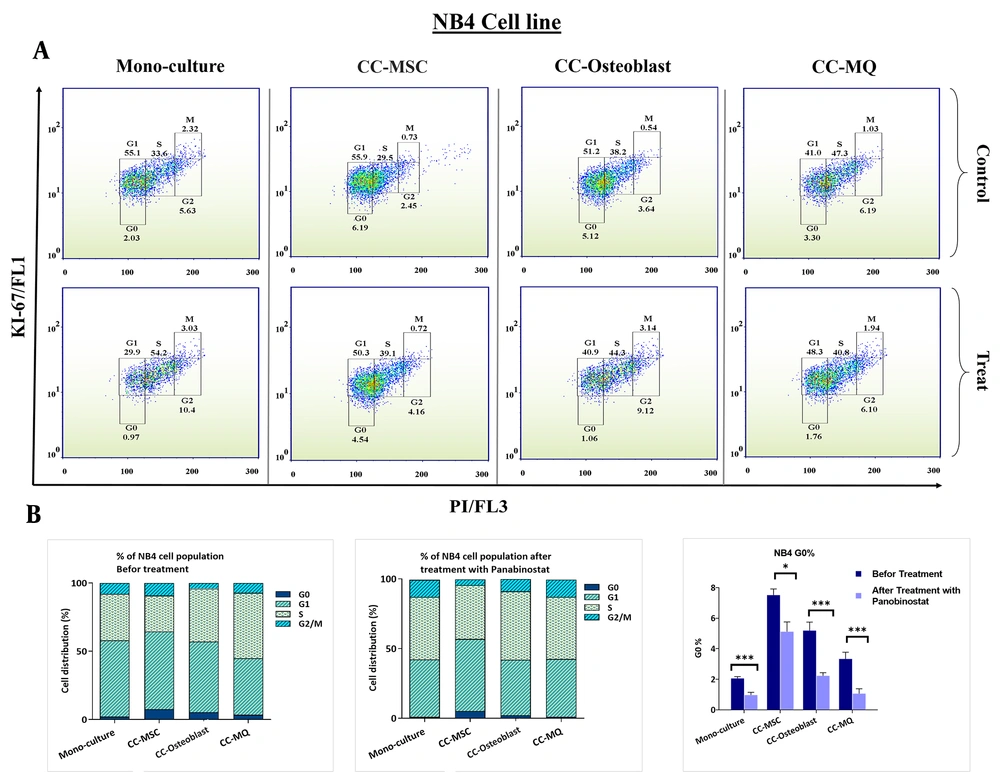
Figure 3.
G0 subphase analyses in NB4 cell line in monoculture and co-cultured with stromal cells and the effect of panobinostat on G0 decreases. Stromal cells caused G0 accumulation in NB4 cells. MSC, osteoblast, and Macrophage had the highest effect, respectively. Treatment with panobinostat reduces the G0 population in all models.
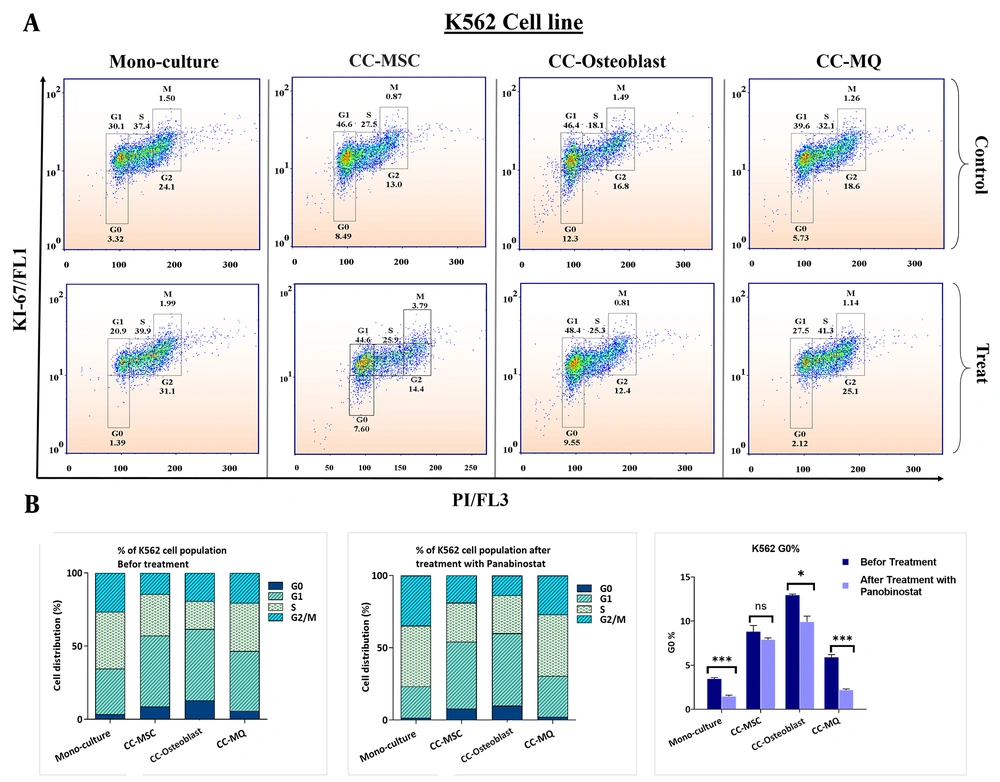
Figure 4.
G0 subphase analyses in K562 cell line in monoculture and co-cultured with stromal cells and the effect of panobinostat on G0 decreases. (A) Different cell cycle populations of the K562 cell line are depicted in this figure. In K562 cells, the G0 accumulation was significantly more than NB4 cells either in monoculture or in co-cultured with stromal cells. (B) Column graphs of cell cycle populations before and after treatment with panobinostat are delineated on the left side and middle of the figure and for facilitation, G0 populations are depicted solely on the right side. Osteoblast induced quiescence more than other stromal cells. Although the panobinostat significantly reduced the G0 cells, its effect was weaker when compared with NB4 cells, particularly in the co-culture of K562 with MSCs.
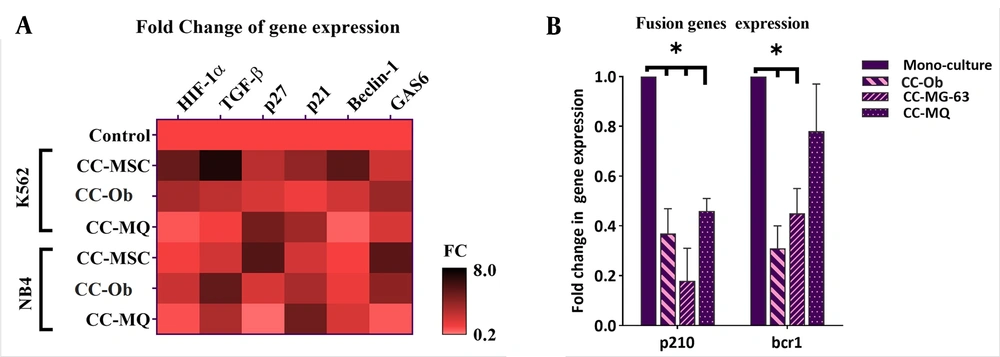
Figure 5.
Co-culture of leukemic cells with stromal cells altered the gene expression pattern of some quiescence inducer genes and leukemia-driver genes. Stromal cells caused an overall overexpression of quiescence-related genes and downregulation of p210 and bcr1 genes. CC-Ob, cocultured with osteoblasts.
3.5. Leukemic Cells Co-cultured with Stromal Cells Had Less Dependence on Their Fusion Genes
Previous studies have demonstrated that the stem cell niche can significantly attenuate the oncogene dependence of cancer cells and suppresses the expression of disease causative oncogenes (28). In this, stat targeted therapy directed against oncogenes may not be efficacious in the eradication of cancer cells (28, 29). So, we decided to inspect the effect of stromal cells on the expression of p210 and bcr1 in CML and APL cells, respectively. The results showed a noticeable downregulation of these genes after co-culture with all stromal cells, except for a lower reduction of bcr1 in NB4 co-cultured with MQ. These data are consistent with previous studies that showed stromal cells could serve as a shelter for escaping APL (2) and CML cells (30) from targeted therapy.
5. Discussion
The sum of intracellular and extracellular factors leads to the transformation and clonal growth of the cells, an event that eventually initiates the onset and the progression of cancer (31). A compelling body of evidence in murine models demonstrated that genetic mutation in MSCs provides the opportunity for the transformation of hematopoietic stem cells (HSC). Although the exact interactions in stem cells niche that regulate cell cycle progression and entry to quiescence, they are yet to be identified.
Our results demonstrated that co-culture of chronic myeloid leukemia (CML)-derived K562 cells and acute promyelocytic leukemia (APL)-derived NB4 cells with BMSCs could stall leukemic cells in G0. In the present study, we found that upon 10 days of co-culture, as compared to macrophages, MSCs and osteoblasts were more effective in induction of quiescence in NB4 and K562 cells, respectively. Quiescence is one of the main cellular mechanisms, which is designed to prevent exhaustion and is the best approach to enhance chemo-resistance in malignant cells (3). In this cellular context, cells reversibly exit from cell cycle progression, which not only adjusts them to a new metastatic environment but also causes their escape from anti-proliferative drugs effects (2, 28). It seems that quiescence reduces the affiliation of cancer cells to oncogenes (28). One of the best examples of this hypothesis is evident in quiescence leukemic stem cells, which have a significantly reduced level of BCR-ABL as compared to proliferating malignant cells in these patients (28). In the leukemic BM, leukemic cells repeatedly transfer from proliferating oncogene-dependent state to a quiescence niche-dependent state. Our results showed that the rate of quiescence induction after co-culture was higher in K562 cells compared to NB4 cells. In accordance, we also found that the reduction in the expression levels of BCR-ABL was more significant than the decrease in the expression level of PML-RARA in NB4 cells. It seems that the induction of quiescence is one of the main mechanisms responsible for induction resistance against PML-RARA targeting agents, as our results showed that PML-RARA had reduced expression in the co-culture models. The quiescence-mediated attenuation in the expression of oncogenes seems to cause one of the main clinical dilemmas in cancer, especially in the evaluation of minimal residual disease (MRD) (32). Indeed, data from follow-up samples obtained from CML and APL patients showed that 48% of CML patients and 21% of APL patients can be DNA+/RNA- for BCR-ABL and PML-RARA fusion genes, respectively, suggesting low dependence of some leukemic cells to oncogenes (33).
To evaluate the molecular changes at the level of gene expression during the co-culture study, 6 key genes involved in leukemic cells dormancy including HIF1α, TGF-β, p21, p27, Beclin-1, and GAS6 were analyzed. It became evident that there was a significant elevation in the expression of all genes in the co-culturing of leukemic cells with one of the BMSCs. The wide alteration in the gene expression is indicative that induction of quiescence is the consequence of a set of changes. In keeping with the elevation of HIF1α and downregulation of oncogenes in our co-culture models, Cheloni et al. (28) demonstrated that induction of hypoxia could markedly reduce the expression of p210 and PML-RARA in K562 and NB4 cells, respectively. Furthermore, p21 and p27, and TGF-β are critical for the prevention of stem cells exhaustion and maintaining the stem cell pool in both normal and leukemic tissues (14, 21) is in concordant with their overexpression in the present work. Previous data also delineate the importance of autophagy (13) and GAS6 (16) in quiescence and drug resistance that corroborate our findings in co-cultured models. Given these and based on the effects of epigenetics alteration on gene expression profile (34), we evaluated the effects of an HDAC inhibitor panobinostat on NB4 and K562 cells co-cultured with stromal cells (35). We found that although the IC50 concentration of panobinostat failed to induce significant apoptotic cell death in some co-culture models when compared with cells cultured alone, it could profoundly reduce the quiescence population in the majority of them. The elimination of quiescent cells is a promising approach to overcoming the acquired resistance of leukemic cells against targeted therapy. In this regard, accumulating evidence supports the strategies that drive quiescent cells to the cell cycle to promote chemotherapy effects (36, 37).
Drug resistance is one of the most devastating events in the current treatment strategies for human cancers, which seems to be mainly a result of malignant cell quiescence (38). Disease recurrence in the following years after the diagnosis of CML and APL suggested the presence of quiescence population in both leukemias (39-41). In the present study, we showed that while co-culturing K562 and NB4 cells with stromal cells, enhanced the induction of quiescence in the leukemic cells, panobinostat could profoundly reduce this phenomenon. In agreement with our findings, Samaraweera et al. showed a senolytic effect for panobinostat against senescence non-proliferative cells accumulated post-chemotherapy (24). Matsuda et al. demonstrated that panobinostat could induce apoptosis in tyrosine kinase inhibitor (TKI)-resistant K562 cells (42). In another study, Nebbioso et al. also indicated that HDAC inhibitors could decrease the survival of AML blasts by reducing the expression of c-Myc (43). Moreover, Fujita et al. showed that inhibiting epigenetics by using EZH1/2 inhibitors could eliminate AML quiescence stem cells (44). Although the pace of scientific advances in debulking leukemias has been astonishing, there are still serious challenges in the eradication of a minority of leukemia-initiating cells. These cells mimic the characteristic of normal hematopoietic stem cells and are frequently found in a quiescent state, which reduces their sensitivity to antiproliferative agents. Our study represented that BMSCs could induce a quiescent state in leukemic cells either derived from CML primitive cells or from APL with a precursor entity. We also found that treatment with an HDAC inhibitor could be a promising approach for eliminating the leukemic cells by preventing cell quiescence. So, panobinostat can be repurposed as an anti-quiescent agent and be used in combination with other anti-leukemic drugs in strategies that followed the idea of awakening and killing leukemic cells; however, conducting further experiments such as clinical trials and in vivo studies are required to evaluate the safety as well as the efficacy of this strategy.
Table 1.
Nucleotide Sequences of Primers Used for Real-time RT-PCR.
| Genes | Forward Primer (5′-3′) | Reverse Primer (5′-3′) |
|---|---|---|
| ABL1 | CTT CTT GGT GCG TGA GAG TGA G | GAC GTA GAG CTT GCC ATC AGA AG |
| p210 | TCC GCT GAC CAT CAA YAA GGA | CAC TCA GAC CCT GAG GCT CAA |
| bcr1 | TCT TCC TGC CCA ACA GCA A | GCT TGT AGA TGC GGG GTA GAG |
| HIF-1α | GCA GCA ACG ACA CAG AAA CT | TTC AGC GGT GGG TAA TGG AG |
| TGF-β | AAG GAC CTC GGC TGG AAG TG | CCC GGG CCA TGC TGG TTG TA |
| p27 | AGC AAT GCG CAG GAA TAA GGA AGC | CAC AGA ACC GGC ATT TGG GGA ACC |
| p21 | CCT GTC ACT GTC TTG TAC CCT | GCG TTT GGA GTG GTA GAA ATC T |
| Beclin-1 | TGC AGG TGA GCT TCG TGT G | CTG GGC TGT GGT AAG TAA TGG AG |
| GAS6 | ATC AAG GTC AAC AGG GAT GC | CTT CTC CGT TCA GCC AGT TC |