
1. Background
Nasopharyngeal carcinoma (NC) is one of the most chemotherapy and radiation-sensitive tumors, and radiotherapy alone can provide good local control in patients with early stages (I and II), with a teen-year disease-free survival (DFS) and overall survival (OS), over 95% and 90%, respectively (1).
However, treatment outcomes for patients in locally advanced NC (stages III and IVA) with radiotherapy alone are less than satisfactory, and local recurrence and distant metastases are leading causes of treatment failure (2, 3). Since early 1980 in locally advanced NC, the standard of care is concurrent chemo-radiation with or without induction chemotherapy (4, 5).
The total dose of radiotherapy delivered to the primary tumor determines the local control of the tumor in patients with NC (6). Initially, 2-dimensional and 3-dimensional techniques of external beam radiotherapy (EBRT) were used for the treatment of patients with NC, the loco-regional control was excellent for tumors such as T1 and T2 but was lower with tumors such as T3 and T4 (7, 8).
In recent years, the development and application of intensity-modulated radiotherapy (IMRT) led to a significant increase in the total dose of radiotherapy delivered to the primary tumor as increasing in the primary tumor local control rate and control of distant metastases and improve overall survival in patients with advanced NC (9, 10).
A prospective randomized study with compared outcomes and toxicities of IMRT versus conventional2- dimensional radiotherapy for the treatment of NC has found that IMRT is better than conventional 2-dimensional radiotherapy in local control and overall survival (11).
2. Objectives
The current study aimed at evaluating the results of management strategies in Iranian patients with NC treated by IMRT in terms of local recurrence, regional recurrence, distant recurrence, three-year DFS, and three-year OS and provide better knowledge that could help tailor the most effective strategies.
3. Methods
Our study was a historical cohort study, consisting of 65 patients treated for NC who were selected and reviewed at the Shohadai-e-Tajrish Hospital of the Shahid Beheshti University of Medical Sciences (SBMU) between October 2017 and October 2019.
The inclusion criteria of this study included: After initial diagnosis, NC patients with acceptable follow-up who had all 15 variables (gender, age at diagnosis, tumor histology type, tumor classification nodal status, total stage, total duration time, total duration of IMRT, the dose of IMRT, type of chemotherapy, MRI response, loco-regional recurrence [if present], distant failure [if present], remission status [no loco-regional and distant recurrence], and death [if present]).
The exclusion criteria were NC patients who did not complete their follow-up after initial diagnosis and patients with distant metastasis as mentioned before.
All patients received radical radiotherapy with IMRT. Patients were treated in a supine position with heads and necks immobilized in a thermoplastic mask under the CT simulation. Enhanced CT-scan slices measuring 3mm were obtained from the top of the head to the arch of the aorta inferiorly. The IMRT target volume includes primary nasopharyngeal tumor, gross tumor volume (GTV), positive neck lymph nodes (GTV lymph node), high-risk clinical target volume (CTV1), and low-risk clinical target volume (CTV2). Primary fields are the portals used to deliver a radiation dose to the primary site of cancer; neck fields are additional portals used to treat cervical lymph nodes not included in the primary fields. The first course of radiation treatment was delivered to GTV, GTV, CTV1, and CTV2. The prescribed dose is 61.6, 61.6, 60.0 Gy, and 53.2 Gy, respectively, in 28 fractions. In the second course, GTV was increased by 9-15 Gy in 3-5 fractions, and if there were still residual lymph nodes, the GTV lymph node was increased by 6-9 Gy in 3-5 fractions.
Reverse meter fins using Eclipse to design 7 co-planar irradiated fields, and the treatment plan evaluation criteria were that the PTV receiving > 105% of the prescribed dose volume < 20%, < 95% of the prescribed dose volume < 3%, and no > 110% of the prescribed dose could occur anywhere outside the PTV.
Chemotherapy was administered either in induction, concomitantly with radiotherapy, or as adjuvant therapy. The 5 regimens are used as induction or adjuvant chemotherapy: Cisplatin and gemcitabine, cisplatin and 5- Fluorouracil, cisplatin and docetaxel, cisplatin and 5- Fluorouracil and docetaxel, paclitaxel and carboplatin, concurrent chemotherapy were cisplatin or capecitabine.
After IMRT, all NC patients were clinically visited and evaluated by the radiation oncologist and otolaryngologist in the first year, with 3 months intervals, and in the second and third years with 6 months intervals. Three months after the completion of radiation therapy, a baseline MRI of the nasopharynx and neck was performed and repeated every 6 to 12 months thereafter. Every clinical or imaging recurrence was confirmed by biopsy.
We considered all eligible patients, consecutively, without sample size and power calculation. Differences in all 15 variables were evaluated and compared by using a two-sided Pearson’s χ2 test. A P < 0.05 was considered significant. Three years of DFS and OS were calculated according to the Kaplan-Meier method and compared, using the Log-rank test. The OS was calculated from the initiation of any treatment to the date of death or last follow-up visit. For DFS, the end-point was the occurrence of loco-regional or distant metastasis or death.
The ethical regulations dictated were approved to review the medical records for our study in the act provided by SBUMS (ethical code: IR.SBMU.MSP.REC.1401.553).
The categorical parameters were compared, using two-sided Pearson’s χ2 test or Fisher’s exact test, as appropriate. The overall survival (OS) time was defined as the period from the diagnosis until the death of any cause or until the date of the last follow-up, at which the data point was censored. All summary statistics on time-to-event variables were estimated according to the Kaplan-Meier method and compared, using the Log-rank or Breslow test. SPSS software (version 21.0) was used for statistical analysis. A P < 0.05 was considered significant.
4. Results
In this historical cohort study, 65 NC patients were analyzed. Forty-two patients (64.6%) of total NC patients were male and 23 patients (35.4%) were female. The mean age of patients was 43.38 years.
T1, T2, T3, and T4 were seen in 27.7%, 32.3%, 18.5%, and 21.5% of the NC patients, respectively. NO, N1, N2, and N3 were observed in 26.2%, 12.3%, 49.2%, and 12.3% of the patients, respectively. Based on tumor stage, 7 cases (10.8%) had stage I, 13 cases (20%) had stage II, 11 cases (16.9%) had stage III, and 34 patients (52.3%) had stage IV.
The mean total duration days of treatment was 132.7 days and the mean of IMRT duration days was 49.83 days.
Six patients (7.8%) received IMRT only and 59 patients (92.2%) received IMRT and chemotherapy.
Complete responses by the treatment were seen in 28 cases (43%) and partial responses were seen in 37 cases (57%). There was no patient without any responses. The median follow-up was 36 months. Patient characteristics and treatment factors were detailed in Table 1.
Table 1.
Patient Characteristics and Treatment Factors (n = 65)
| Characteristic | Patients a |
|---|---|
| Gender | |
| Male | 42 (64.6) |
| Female | 23 (35.4) |
| Age, y: mean (range) | 43.38 (15 – 78) |
| Histopathologic type | |
| Undifferentiated | 41 (63.1) |
| Differentiated | 2 (3.1) |
| Non-keratinazing SCC | 15 (23.1) |
| Keratinazing SCC | 4 (6.2) |
| Low-grade Adenocarcinoma | 1 (1.5) |
| Lymphoproliferative | 1 (1.5) |
| Basaloid SCC | 1 (1.5) |
| Tumor classification | |
| T1 | 18 (27.7) |
| T2 | 21 (32.3) |
| T3 | 12 (18.5) |
| T4 | 14 (21.5) |
| Node classification | |
| N0 | 17 (26.2) |
| N1 | 8 (12.3) |
| N2 | 32 (49.2) |
| N3 | 8 (12.3) |
| Total stage | |
| I | 7 (10.8) |
| II | 13 (20) |
| III | 11 (16.9) |
| IV | 34 (52.3) |
| Total time duration, d | 132.7 ± 7.2 |
| IMRT treatment duration, d | 49.83 ± 2.02 |
| RT alone | 6 (7.8) |
| Chemotherapy | 59 (92.2) |
| MRI response | |
| Complete response | 28 (43) |
| Partial response | 37 (57) |
a Values are expressed as Mean ± SD or No. (%).
During the follow-up period, 50 cases (76.9%) were without any recurrence, and 15 patients (23.1%) experienced recurrence, which was consistent with 8 patients (12.3%) with loco-regional recurrence and 7 patients (10.8%) with distant metastasis recurrence.
In 8 patients with loco-regional recurrence, 2 patients (28.6%) experienced recurrence in the primary site, and 5 patients (71.4%) experienced recurrence in the in-field. There was not any information on 1 patient, who experienced loco-regional recurrence.
In 7 patients with loco-regional recurrence, the mean volume of GTV of the primary tumor was 26.31CC ± 9.74 CC and the mean volume of GTV of the lymph nodes was 14.0 5CC ± 2.63 CC. The mean D95% for CTV60 and CTV was 58.60 Gy ± 1.01 Gy and 51.54 Gy ± 0.29 Gy, respectively. The mean volume of tumor recurrence was 26.87CC ± 12.09CC.
The mean dose of D95% for patients with marginal failure was 37 Gy and in in-field failure, it was 52.20 Gy ± 4.16 Gy. The mean volume of V100 for marginal failure was 21% ± 2% and in in-field failure, it was 83% ± 6.04%. Details of 7 recurrent patients and their local-regional failures and dosimetric data were summarized in Table 2.
Table 2.
Details of 7 Recurrent Patients and Their Local-regional Failures
| GTV p (Volume) | GTVLN (Volume) | D 98 GTV p | D95 CTV60 | D95 CTV54 | Recur Rent Volume | V100 Recurrent | D100 Recurrent | Miss | |
|---|---|---|---|---|---|---|---|---|---|
| T1N2 | 18 cc | 11cc | 68.6 GY | 58.9 | 51.3 GY | 30 cc | 19% | 40 GY | Marginal miss to CTV 60 a |
| T4NO | 18.7 | - | 68.2 gy | 57.9 | 51.1 | 23.6 | 89% | 44.3 GY | In field miss to CTV60 b |
| T1NO | 43.7 | - | 69.2 GY | 60.5 | 51.5 | 30.3 | 100% | 60.4 GY | In the field to CTV 60 |
| T4N2 | 30.1 | 17.1 | 68.7 | 59.1 | 51.7 | 43.2 | 73% | 56.7 GY | In-field to CTV 60 |
| T2N2 | 21.4 | 13 | 68.9 | 58.1 | 51.7 | 21 | 23% | 34 GY | Marginal miss to CTV60 |
| T4N2 | 19.9 | 15.1 | 68.3 | 58.3 | 51.5 | 11 | 76% | 41.4 GY | In field to CTV60 |
| T3N0 | 33.33 | - | 68 | 57.4 GY | 52 | 8 | 83% | 50.3 GY | In field to CTV 60 |
Abbreviations: CTV, clinical target volume; GTV, gross tumor volume; V100%, % of the volume of failure receiving at least 100% of prescribed total dose; Vrecur, the recurrent tumor volume.
a Marginal refers to 20 – 95% of the recurrence volume receiving 95% of the prescribed dose.
b In field refers to 95% of the recurrence volume receiving more than 95% of the prescribed dose.
The three-year DFS rates were 93.20%, 98.56%, 86.76%, and 79.80% in T1, T2, T3 and T4 patients, respectively (P = 0.013). The three-year OS rates were 94.44%, 80.95%, 83.33%, and 78.57% in T1, T2, T3 and T4 patients, respectively (P = 0.043). The study observed a significant correlation between T status and three-year DFS and three-year OS.
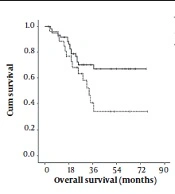
The three-year DFS rates were 98%, 89.43%, 93.42%, and 68.30% in N0, N1, N2 and N3 patients, respectively (P = 0.071). The three-year OS rates were 88.23%, 100%, 75%, and 69.74% in N0, N1, N2 and N3 patients, respectively (P = 0.028). The study did not show a significant correlation between N status and the three-year DFS but showed a significant correlation between N status and the three-year OS. Figure 1 showed Kaplan-Meier Estimates for 36 months of overall survival of 65 patients according to tumor and node.
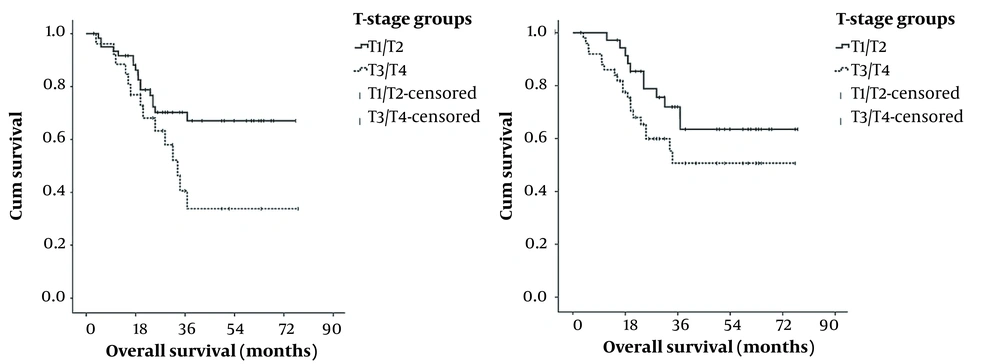
Figure 1.
Kaplan-meier estimates for overall survival of the study patients according to tumor and node
The three-year DFS rates were 95.72%, 92.32%, 72.73%, and 73.26% in stage I, II, III, and IV patients respectively (P = 0.119). The three-year OS rates were 100%, 84.61%, 90.90%, and 79.41% in stage I, II, III, and IV patients respectively (P = 0.155). The study did not show a significant correlation between stage status and three-year DFS and three-year OS. The total three-year DFS rate and the total three-year OS rate were 76.47% and 84.60% in all cases. The three-year DFS rate and the three-year OS based on the T stage, N stage, and total stage in 65 patients are shown in Table 3.
Table 3.
The Three-Year Disease-Free Survival (DFS) Rate and the Three-Year Overall Survival Rate (OS) Based on T Stage, N Stage, and Total Stage in 65 Patients
| Variables | Three Years DFS | Three Years OS | ||
|---|---|---|---|---|
| % | P-Value | % | P-Value | |
| T stage | 0.013 | 0.043 | ||
| T1 | 98 | 94.44 | ||
| T2 | 89.34 | 80.95 | ||
| T3 | 93.42 | 83.33 | ||
| T4 | 79.80 | 78.57 | ||
| N stage | 0.071 | 0.028 | ||
| N0 | 93.20 | 88.23 | ||
| N1 | 98.56 | 100 | ||
| N2 | 86.76 | 75 | ||
| N3 | 68.30 | 69.74 | ||
| Total stage | 0.119 | 0.155 | ||
| I | 95.72 | 100 | ||
| II | 92.32 | 84.61 | ||
| III | 72.73 | 90.90 | ||
| IV | 73.26 | 79.41 | ||
| Total | 76.47 | 84.60 | ||
Based on the Pearson Correlation Test, there was a significant correlation between the duration of IMRT time and three-year DFS (correlation = 0.138, P = 0.017) and the number of concurrent cycles of chemotherapy with IMRT and three-year DFS (correlation = 0.375, P = 0.002). There was not a significant correlation between total time duration, MRI response, induction chemotherapy, age, sex, and the three-year DFS.
Based on Pearson Correlation Test, there was a significant correlation between total time duration and three-year OS (correlation = 0.263, P = 0.040) and the number of concurrent cycles of chemotherapy with IMRT and three-year OS (correlation = 0.334, P = 0.007). There was not a significant correlation between the duration of IMRT time, MRI response, induction chemotherapy, age, sex, and the three-year OS. Predictors of the three-year DFS rate and the three-year OS rate and these variables were detailed in Table 4.
Table 4.
Predictors of the Three-year Disease-Free Survival (DFS) Rate and the Three-year Overall Survival Rate (OS) (Pearson’s χ2 Test)
| Variables | Three Years DFS | Three Years OS | ||
|---|---|---|---|---|
| % | P-Value | % | P-Value | |
| Sex | 0.174 | 0.166 | 0.167 | 0.183 |
| Age | 0.017 | 0.895 | 0.007 | 0.995 |
| T stage | 0.308 | 0.013 | 0.251 | 0.043 |
| N stage | 0.226 | 0.071 | 0.326 | 0.028 |
| Total stage | 0.195 | 0.119 | 0.178 | 0.155 |
| Total time duration | 0.138 | 0.289 | 0.263 | 0.040 |
| Duration of radiotherapy | 0.287 | 0.017 | 0.140 | 0.288 |
| MRI response | 0.003 | 0.979 | 0.015 | 0.904 |
| Cycles of concurrent chemotherapy | 0.375 | 0.002 | 0.334 | 0.007 |
| Induction chemotherapy | 0.377 | 0.189 | 0.419 | 0.251 |
Abbreviations: DFS, disease-free survival; OS, overall survival.
5. Discussion
The anatomical location of NC makes radiation therapy a preferred method for local control. The 2D and 3D irradiation alone makes the average 5-year OS rate of patients at different clinical stages have remained below 60%. The main reasons for treatment failure in patients with locally advanced disease are the occurrence of distant metastases and lack of local control (12).
Previous studies on the treatment of locally advanced NC have mostly focused on the combination of different modes of chemotherapy and radiotherapy, such as concurrent chemo-radiotherapy plus adjuvant chemotherapy, and neo-adjuvant chemotherapy plus concurrent chemo-radiotherapy. This model has become the standard treatment model for patients with stage III and IV NC in the United States since the first prospective randomized controlled study in the United States Intergroup Study comparing concurrent chemo-radiotherapy plus adjuvant chemotherapy with radiotherapy alone showed significant improvement in survival benefit (13, 14).
Su et al. have shown that the stage of the disease is an important predictor for OS and DFS (15). Su et al.’s study was inconsistent with our study in that it showed the three-year DFS rates were 95.72%, 92.32%, 72.73%, and 73.26% in stage I, II, III, and IV patients, respectively, (P = 0.119) and the three-year OS rates were 100%, 84.61%, 90.90%, and 79.41% in stage I, II, III and IV patients, respectively, (P = 0.155) and were not a significant correlation between stage status and three-year DFS and three-year OS.
The three-year DFS rates were 93.20%, 98.56%, 86.76%, and 79.80% in T1, T2, T3 and T4 patients, respectively, (P = 0.013) and the three-year OS rates were 94.44%, 80.95%, 83.33%, and 78.57% in T1, T2, T3 and T4 patients, respectively, (P = 0.043). The study observed a significant correlation between T status and three-year DFS and three-year OS. Our study was consistent with Guo et al.’s study that showed the T stage of the disease is an important predictor for OS and DFS (16).
The three-year DFS for NC treated by IMRT ranges between 70% and 85% as shown in studies by Chen et al. and Rakhsha et al. In the present study, the three-year was 76.47%, which is very good and comparable to reports of Chen et al. and Rakhsha et al. (17, 18).
A study by Wang et al. showed that the three-year OS rate of 695 patients treated with the IMRT technique was 77.1% and was lower than our study with 84.60% of three-year OS (19). But, the number of patients (695) in Wang et al.’s study was significantly more than our study with 65 patients.
IMRT can achieve a simultaneous integrated boost (SIB), which is essential to increase the dose per fraction of the target area to improve the biological effect. In the present study, there were 8 loco-regional recurrences and 7 cases of distant metastasis after treatment, indicating that IMRT may be more effective in terms of local tumor control.
In our study as shown in Table 2, 4 of 5 of the in-field recurrences occurred in locally advanced disease (staged T3N0, T4N0, T4N2, and T4N2) and we had only 1 patient in early stage (T1N0) with in-field recurrence. Two marginal misses were observed in this study (staged T1N2 and T2N2). The main patterns of local-regional recurrence are in-field failures. A recent Medline review by Hong et al. showed that radioresistance may be the ultimate cause of a local-regional failure (20).
Kazemian et al.’s study showed that the duration of EBRT was not related to DFS and OS (21). Our results were inconsistent with Kazemian et al.’s study that showed a significant correlation between the duration of IMRT time and three-year DFS (correlation = 0.138, P = 0.017); the results of this study were also in line with Kazemian A et al.’s study that showed no significant correlation between duration of IMRT time and the three-year OS (correlation=0.140, P = 0.288).
We found that the administration of induction chemotherapy was not associated with better three-year DFS and OS (P = 0.189 and P = 0.251, respectively). Our result was inconsistent with Kawahira et al. and Hennessy and Morris’s studies that showed induction chemotherapy before chemo-radiotherapy has survival benefits (22, 23). However, induction chemotherapy appears to be an acceptable approach for bulky and locally advanced diseases, especially N2-3. In summary, the standard approach for NC patients is still concurrent chemo-radiotherapy.
Although IMRT achieved good tumor local control, the distant metastases rate was still high, about 20%, and 2/3 occurred after a loco-regional control the author has carried out a comprehensive chemo-radiotherapy mode to improve the long-term survival rate (22). The main strength of our study was the number of concurrent cycles of chemotherapy with IMRT and three-year DFS (correlation = 0.375, P = 0.002) and three-year OS (correlation = 0.334, P = 0.007) are significantly correlated. There is not any known study to evaluate the number of concurrent cycles of chemotherapy with IMRT and DFS or OS.
The limitations of this study included the short follow-up time (about 3 years) and factors such as different chemotherapy regimens have evolved.
5.1. Conclusions
The initial findings of this study showed that IMRT with concurrent chemo-radiotherapy has three-year DFS and OS, which were comparable with the other published results.
We emphasize the number of concurrent cycles of chemotherapy with IMRT for NC patients has an important role in both three-year DFS and OS. The duration of IMRT time has an important role in the three-year DFS but not in the three-year OS. A longer follow-up time for the patients to evaluate 10-year DFS and OS is recommended.