
1. Background
Acute lymphoblastic leukemia (ALL), as the most common childhood cancer, mostly affects children aged between 2 and 5 years (1-4), and accounts for approximately 22% of hematologic malignancies in Iran (5). In spite of endorsed and exponential researches to improve treatment strategies, efforts have not yet converted into better prospect for patients and resistance to conventional chemotherapies still remain a significant problem in ALL (6-9). Glucocorticoids, such as Prednisolone, were among the very first drugs used to treat ALL and remain as the integral parts of the current intensive regimens (10). Despite prednisolone effectiveness, the appropriate effects are achieved in high doses, which are not clinically achievable without the risk of various side effect such as immune system suppression, increased skin fragility, delayed wound healing, and digestive system diseases (11, 12). Due to its toxicity, the clinical use of prednisolone is dose-limited by its safety profile, providing opportunities for innovative combined-modality strategies that would increase cure rates, while reducing adverse effect.
Based on the higher compliance of medicinal plants with living organism, intense interest has focused on herbal medicine as either single agent or in combination for patient suffering from cancer (13-15). Curcuma Longa (CL) extract, a natural yellow compound derived from CL roots, belongs to the Zingiberaceae family (16). This plant, which is widely cultivated as a flavor in tropical regions of Asia and central America (13), demonstrates highly diverse pharmaceutical activities such as anti-inflammatory, anti-bacterial, anti-oxidant, and anti-cancer effects (17, 18). Curcumin, a derivative of CL extract, is known as one of the most effective anti-cancer plants due to its powerful anti-oxidant properties (17).
In this study, we investigated the effects of CL extract on growth and apoptosis in pre B ALL cells. Moreover, to enhance the effectiveness of ALL treatment, especially in patient with resistance to glucocorticoids, we designed experiment to evaluate the effects of CL extract in combination with prednisolone in both semi-sensitive (Nalm-6) and resistant (REH) pre B ALL cells.
2. Methods
2.1. Cell Culture and Drugs
Human lymphoblastic leukemia Nalm-6 and REH cell lines and bovine kidney (MDBK) cell line were obtained from the Pasteur institute (Tehran, Iran). These cell lines were cultured in a RPMI 1640 medium containing 10% FBS, 100 U/mL of penicillin, 100 U/mL of Streptomycin, and 5% CO2 at 37. The medium culture of the Nalm-6 and REH cells were changed every 48 hours, whereas MDBK cells were trypsinized every 72 hours and the medium culture were also changed.
Curcuma Longa extract was obtained from the traditional medicine research center of Shahid Beheshti University of Medical Sciences (Tehran, Iran), and a stock solution was prepared with a concentration of 30 mg/mL in DMSO and was stored at -80. Prednisolone powder was obtained from Sigma Aldrich Company (St. Louis, MO, USA), and the stock solution with a concentration of 1mM was prepared in DMSO and was stored at -80. Cells were treated with adequate amounts of CL extract and Prednisolone to obtain 6, 8, 10, 12, 16, and 20 μg/mL doses of CL extract and 0.5, 1, 10, 50, and 100μM doses of Prednisolone.
2.2. Trypan Blue Dye Exclusion Assay
The Trypan blue dye exclusion assay was carried out to study proliferation and viability of cells. To conduct this assay, first, equal numbers of living cells (3 × 10⁵) per mL were put in the wells of a 6-well plate in the medium culture for each dose of CL extract and Prednisolone. Cells were counted after 24 and 48 hours of incubation with the method described in the following. First, the cells were centrifuged, the supernatant was removed, and the cell plate was suspended with 1mL of the medium. Next, 10 to 15 μL of the cell suspension was removed and an equal amount of Trypan blue dye was added to the suspension, which was incubated at room temperature for 1 to 2 minutes to allow for absorption of the dye by dead cells. Afterwards, the cells were counted with a hemocytometer, and the number of living cells per mL of the medium was counted. Viability of the cells was calculated, using the following formula:
Viability% = Number of living cells / Total number of cells × 100
2.3. MTT Assay
A MTT assay was carried out to study the metabolic activity of cells. To this end, 5 × 10³ cells from the Nalm-6 and REH cell lines and 10 × 103 cells per 100 μL of the MDBK cell line were put in the wells of a 96-well plate for different doses of CL extract (6 to 20 μg/mL) and Prednisolone (0.5 to 50 μM). Afterwards, the cells and the CL extract and prednisolone were incubated for 24 and 48 hours at 37 with 5% of CO2. To assess the cytotoxic effects of MTT, 100 μL of MTT solution (5 mg/mL in PBS) was added to each well. After 3 to 4 hours of incubation at 37, the plate was centrifuged at 350 g for 10 minutes and the supernatant was removed. Moreover, 100 μL of DMSO was added to the plate sediment, and after the mixing, the plate was incubated for 5 minutes at 37 in the dark. Finally, the plate was put in an ELISA plate reader and absorbance of the wells was read at a wavelength of 570 nM. Metabolic activity% = OD of experimental group samples/ OD of control group samples × 100.
2.4. Annexin V Staining
Apoptosis was assessed with Annexin V (FITC) and PI (eBioscience, Vienna, Austria), using a flow cytometry device (Partec cyflo space, Germany). Next, 5 × 10⁵ cells per milliliter of Nalm-6 and REH cells were added to the selective doses of CL extract and Prednisolone simultaneously and separately. In addition, the control cells did not receive any extract or drug. After 48 hours of incubation, the cells were collected and rinsed twice with PBS buffer. Afterwards, 200 μL of a binding buffer was added to the cells, and 5 μL of Annexin V (FITC) was added to the cell suspension and was incubated for 10 minutes. The cells were rinsed and 200 μL of the binding buffer was added. Then, PI was added before reading the values with the aid of flowcytometry. Analyses were carried out in Flomax software, in which the two-dimensional Annexin V (FITC) vs. PI curve was divided into the Q1 to Q4 zones, where Q1, Q2, Q3, and Q4 showed early apoptosis (Annexin V (FITC)+ and PI-), late apoptosis (Annexin V (FITC)+ and PI+), living cells (Annexin V (FITC)- and PI-), and necrosis (Annexin V (FITC)- and PI+), respectively.
2.5. Real Time RT PCR
RNA was extracted, using a RNAX plus kit (SinaClone, Tehran, Iran) in accordance with the kit instructions. The cDNA was built, using a cDNA synthesis kit (TAKARA, Japan) according to the kit instructions. Real time quantitative RT PCR was carried out with a Bulk SYBR® Premix Ex Taq ™ (Tli RNaseH Plus, Takara, Japan) according to the kit protocol and a 30-second hold program at 95 and 40 two-stage cycles including 5 seconds at 95 and 30 seconds at primer Tm and, finally, the melt curve was obtained at 70 - 95 with a Rotor-Gene Q (QIAGENE, US).
Table 1.
Primer Sequences
| Gene | Forward Primers (5’ - 3’) | Reverse Primers (5’ - 3’) | Size (bp) |
|---|---|---|---|
| HPRT | TGGACAGGACTGAACGTCTTG | CCAGCAGGTCAGCAAAGAATTTA | 111 |
| BAX | CGAGAGGTCTTTTTCCGAGTG | GTGGGCGTCCCAAAGTAGG | 242 |
| BCL-2 | CGGTGGGGTCATGTGTGTG | CGGTTCAGGTACTCAGTCATCC | 90 |
2.6. Caspase-3 Activity
With the Caspase-3 colorimetric kit (Sigma Aldrich, St. Louis, MO, USA), the caspase protease activity was measured based on the identification and breakdown of amino acid sequence of DEVD-pNA of the substrate (i.e. poly adenosine diphosphate ribose polymerase, PARP). A total of 1 × 10⁶ cells and the growth medium were put in a 25-cm2 flask, and the selective doses of CL extract and Prednisolone were simultaneously and separately added to the flask to increase the volume to 5 mL. After 48 hours, the content of the flask was centrifuged (5 minutes, 1500 RPM) and the supernatant was removed. A lysing buffer was added and the cells were incubated for 10 minutes in ice and were centrifuged thereafter (1 minute, 10000 g). In the next step, a reaction buffer along with a DTT and a DEVD substrate containing nitroanilide chromophore was added to the supernatant resulted from the centrifuge and the mix was incubated for 2 hours at 37. The breakdown of p-Na chromophore with caspase-3 enzyme was indicative of enzymatic activity. The samples were read with an ELISA reader at a wavelength of 405 nM and were assessed based on absorbance of 630 Nm.
2.7. Statistical Analysis
The data was presented as mean ± SD values obtained from 3 separate tests. The data significance levels were expressed as *P < 0.05, **P < 0.01, and ***P < 0.001, using the t student test, SPSS 16, and Excel.
3. Results
CL extract reduced proliferation and viability of Nalm-6 and REH cells, and the effect of prednisolone increased in combination with CL extract on Nalm-6 cells.
First, the effect of CL extract on proliferation and viability of Nalm-6 and REH cells was assessed through a Trypan blue dye exclusion assay. As shown in (Figure 1A-B), as dosage of CL extract increased from 6 to 20 μg/mL proliferation of Nalm-6 and REH cells was inhibited after 24 and 48 hours, while viability of the cells subsided in a dose and time-dependent manner. Afterwards, to study the synergistic effect of CL extract with Prednisolone, the effect of Prednisolone was studied and results showed the inhibition of cell proliferation, a decline in viability of Nalm-6 cells in relation to dosage (0.5 to 100 ) and time (24 and 48 hours), and the lack of effect of prednisolone on REH cells (Figure 1C-D). To study the synergistic effect, the 1 μM of Prednisolone was used, since it was lower than the maximum clinical dose and it was used in other studies (1, 19, 20). Examinations of the synergistic effect revealed that CL extract amplified the effect of prednisolone on inhibition of cell proliferation and the decrease in viability of Nalm-6 cells in combination with Prednisolone, but no synergistic effect was observed in REH cells (Figure 1E-F).
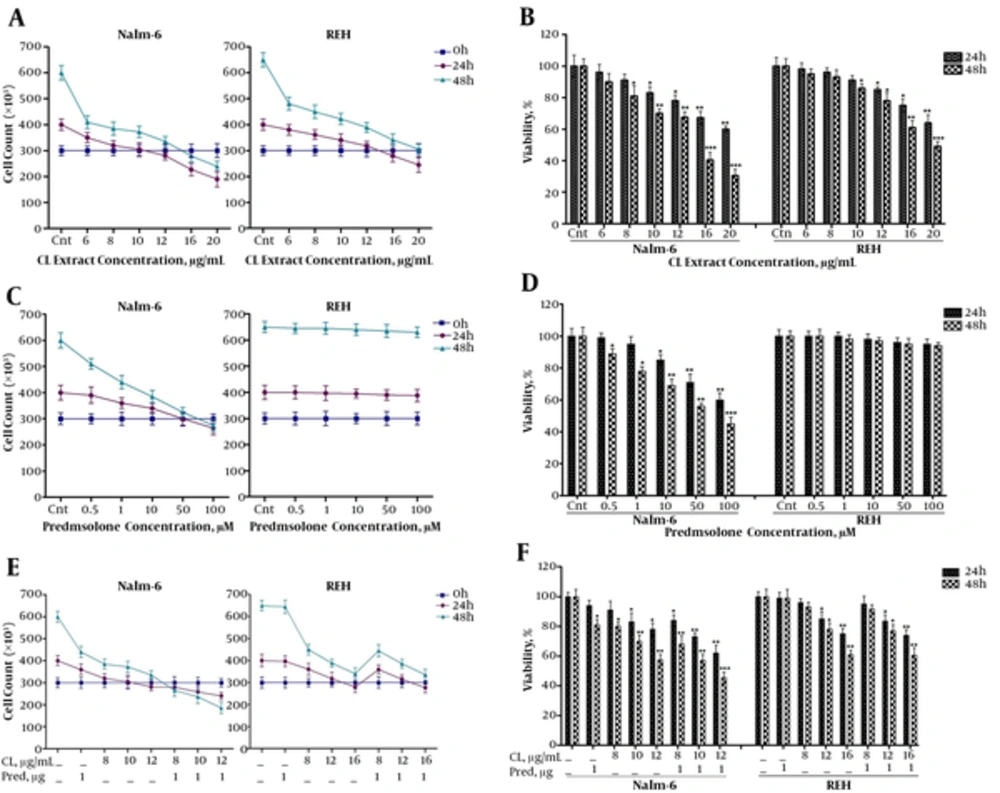
Figure 1.
Analysis of the effects of CL extract (6 to 20 µg/mL) and prednisolone (0.5 to 100 µM) on cell death of Nalm-6 and REH cells within 24 and 48 hours incubation: A, effect of CL extract on proliferation of Nalm-6 and REH cells; B, effect of CL extract on viability of Nalm-6 and REH cells; C, effect of prednisolone on proliferation of Nalm-6 and REH cells; D, effect of prednisolone on viability of Nalm-6 and REH cells: E, effect of the combination of CL extract and prednisolone on proliferation of Nalm-6 and REH cells; F, effect of the combination of CL extract and prednisolone on viability of Nalm-6 and REH cells. Error bars indicate standard deviations and data significance levels are shown as *P < 0.05, **P < 0.01, ***P < 0.001.
CL extract reduced the metabolic activity of Nalm-6 and REH cells and increased the cytotoxic effect of Prednisolone on Nalm-6 cells.
We assessed the effect of CL extract on metabolic activity of Nalm-6 and REH cells through an MTT assay. CL extract reduced the metabolic activity of Nalm-6 and REH cells in a dose-dependent (6 - 20 μg/mL) and time-dependent (24 and 48 hours) growing trend (Figure 2A). The calculated IC50 of CL extract on Nalm-6 and REH cell lines during 48 hours of incubation was 13.2 and 19.3, respectively. Afterwards, assessment of the cytotoxic effect of Prednisolone using MTT assays indicated that Prednisolone reduced the metabolic activity of Nalm-6 cells in a dose-dependent (0.5 - 100) and time-dependent (24 and 48 hours) growing trend. However, it did not affect the REH cells (Figure 2B). The calculated IC50 of Prednisolone on Nalm-6 and REH cells during 48 hours of incubation was 72.7 and > 1000 μM, respectively. These results reflect semi-sensitivity of Nalm-6 cells and resistance of REH cells to prednisolone.
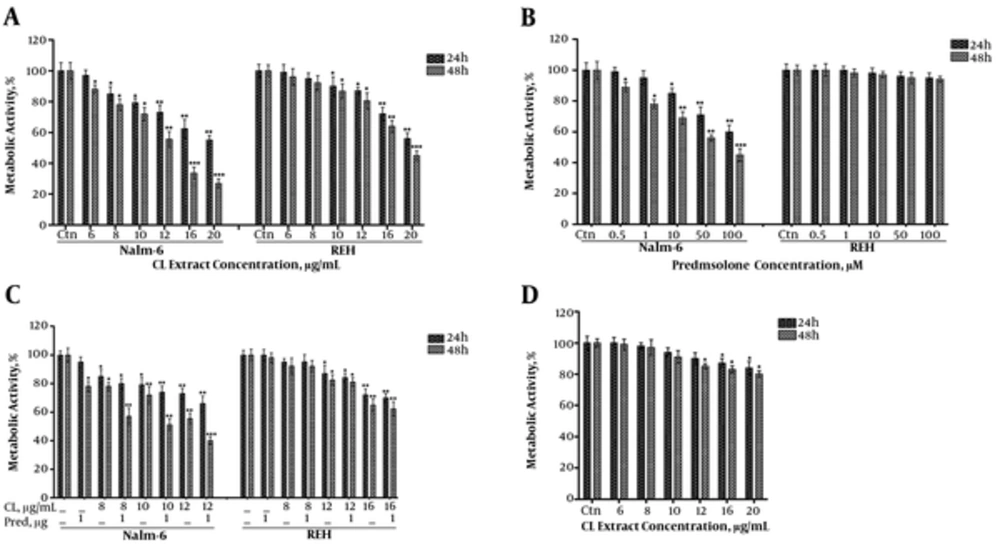
Figure 2.
Analysis of the effect of CL extract (6 to 20 µg/mL) and prednisolone (0.5 to 100 µM) on metabolic activity of Nalm-6 and REH cells within 24 and 48 hours incubation: A, effect of CL extract on metabolic activity of Nalm-6 and REH cells; B, effect of prednisolone on metabolic activity of Nalm-6 and REH cells; C, effect of the combination of CL extract and prednisolone on metabolic activity of Nalm-6 and REH cells; D, analysis of the effects of the treatments on metabolic activity of MDBK cells. Error bars indicate standard deviations and data significance levels are shown as *P < 0.05, **P < 0.01, ***P < 0.001.
To examine the synergistic effect of CL extract and prednisolone, different doses of CL extract and 1 μM of prednisolone were put on Nalm-6 and REH cells (Figure 2C). The combination index (CI) with different doses of CL extract and Prednisolone in Nalm-6 cells was smaller than 1 and CI of the same combination on REH cells was approximately 1, which showed the synergistic effect of this combination on Nalm-6 cells and the additive nature of this combination on REH cells.
In addition, to study the cytotoxic effect of CL extract on natural cells, different doses of CL extract were tested on the natural MDBK cell line, which showed survival of most natural MDBK cells as a result of these treatments (Figure 2D).
CL extract induced apoptosis in Nalm-6 and REH cells and increased the apoptotic effect of Prednisolone on Nalm-6 cells.
To determine whether apoptosis was the reason for the reduction in metabolic activity and viability of cells, Nalm-6 cells were treated with different doses of CL extract and 1μM of prednisolone simultaneously and separately, whereas the REH cells were only treated with different doses of CL extract. Following 48 hours of incubation, the cells were assayed using the Annexin ν/PI method and flowcytometry. Results revealed an increase in the apoptosis caused by concentration of CL extract as compared to the control cells of both cell lines. The following combination of CL extract and prednisolone on Nalm-6 cells, apoptosis increased as compared to the apoptotic effect of each one alone (Figure 3).
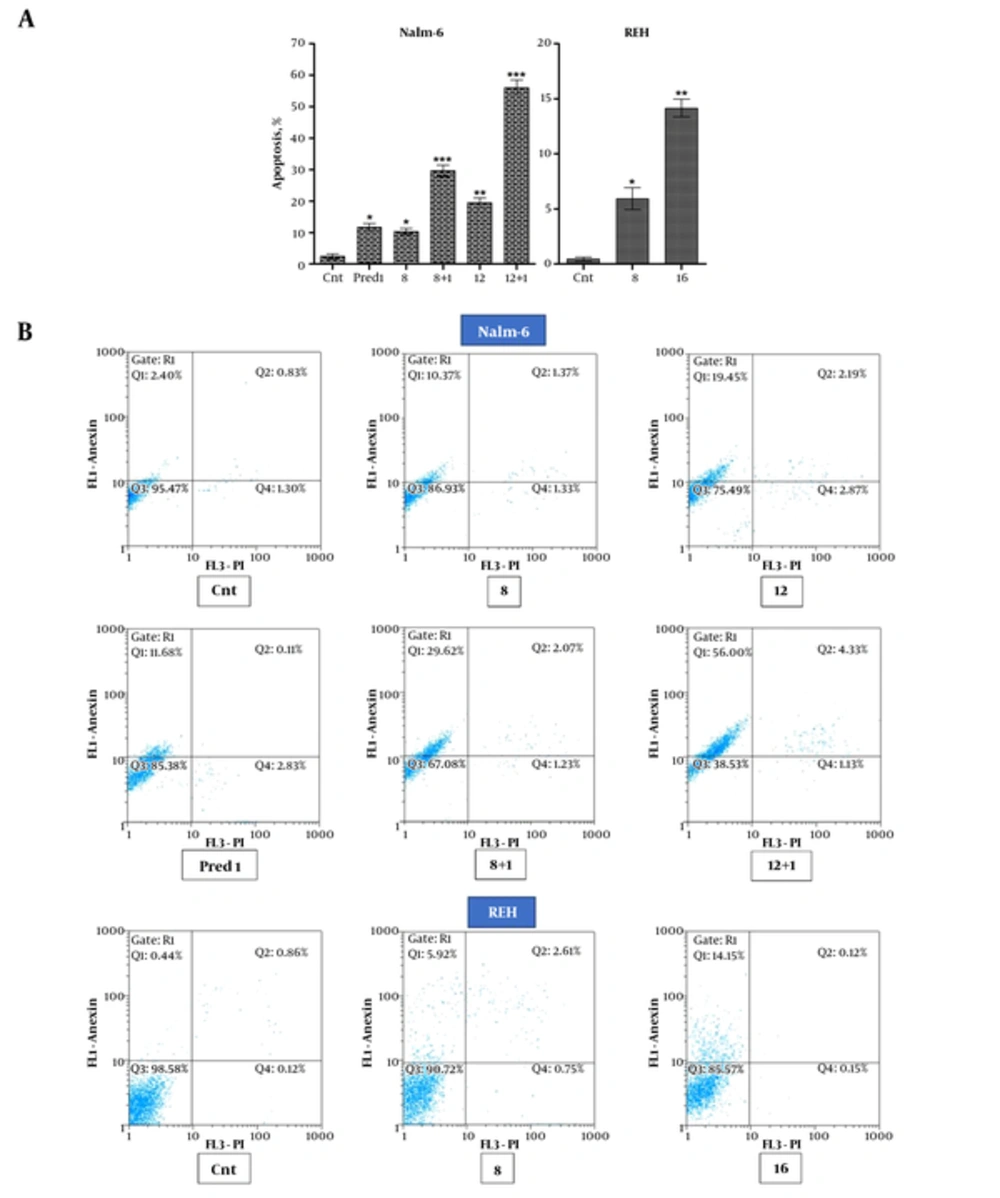
Figure 3.
Analysis of apoptosis induction in Nalm-6 cells treated with 8 and 12 µg/mL of CL extract and 1 µM of prednisolone and their combination and apoptosis induction in REH cells treated with 8 and 16 µg/mL of CL extract during 48 hours of incubation: A, The bars show percentage of Annexin V (FITC)+ and PI- cells, which are indicative of early apoptosis; B, Cytograms show the Annexin V (FITC) and PI staining carried out for apoptosis. Error bars indicate standard deviations and data significance levels are shown as *P < 0.05, **P < 0.01, ***P < 0.001.
Expression of Bax and Bcl-2 in Nalm-6 and REH cells was changed by CL extract treatments.
Throughout apoptosis-related examinations, the pro-apoptotic and anti-apoptotic Bax and Bcl-2 mRNA expressions were studied. Therefore, REH cells were treated with 8 and 16 μg/mL of CL extract and Nalm-6 cells were treated with 8 and 12 μg/mL of CL extract and 1 μM of prednisolone both simultaneously and separately. Following 48 hours of incubation, mRNA expression of the Bax and Bcl-2 genes was measured semi-quantitatively, using Real Time PCR. Results revealed an increase in Bax gene mRNA expression and a decrease in Bcl-2 gene mRNA expression (totally increased Bax/Bcl-2 Ratio) in Nalm-6 and REH cells, and CL extract amplified this effects in combination with 1 μM of prednisolone in Nalm-6 cells as compared to the control cells (Figure 4).
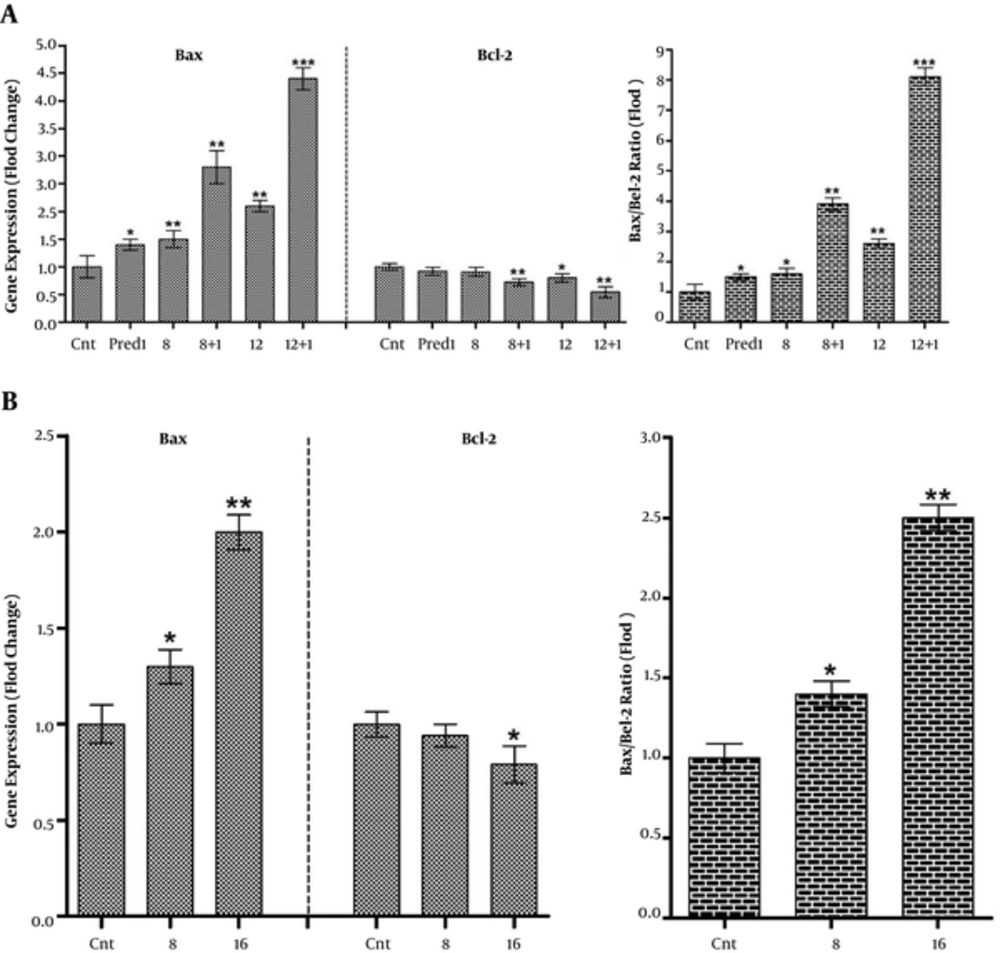
Figure 4.
Variations of Bax and Bcl-2 gene expressions and increased Bax/Bcl-2 ratio in: A, Nalm-6 cells treated with 8 and 12 µg/mL of CL extract and 1 µM of Prednisolone and their combination, and B, REH cells treated with 8 and 16 µg/mL of CL extract and after 48 hours of incubation. Expression of the aforementioned genes was assessed using Rq-PCR after normalizing the cycle threshold (Ct) against the related HPRT. Error bars indicate standard deviations and data significance levels are shown as *P < 0.05, **P < 0.01, ***P < 0.001.
CL Extract increased the enzymatic activity of caspase-3 on Nalm-6 and REH cells.
Afterwards, to determine whether the apoptosis was caused by the rise in caspase activity, after treating the REH cells with 8 and 16 μg/mL of CL extract and treating Nalm-6 cells with 8 and 12 μg/mL of CL extract and 1 μM of prednisolone separately and simultaneously, the enzymatic activity of caspase-3 was measured, using the ELISA method following 48 hours of incubation by measuring the released p-NA. As shown in Figurer 5, CL extract increased the activity of caspase-3 enzyme in Nalm-6 and REH cells, and this effect was intensified in Nalm-6 cells in combination with 1 μM of prednisolone.
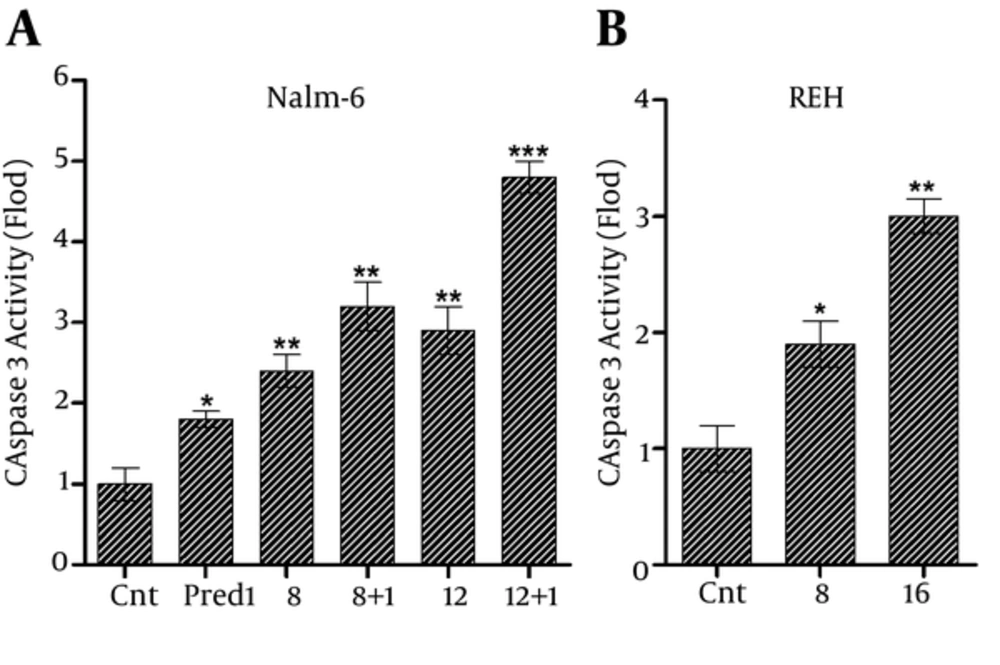
Figure 5.
The increase in caspase-3 activity in: A, Nalm-6 cells treated with 8 and 12 µg/mL of CL extract and 1 µM of prednisolone separately and simultaneously, and B, REH cells treated with 8 and 16 µg/mL of CL extract within 48 hours of incubation. Error bars indicate standard deviations and data significance levels are shown as *P < 0.05, **P < 0.01, ***P < 0.001.
4. Discussion
The use of natural products as anti-cancer agents has a long history (21). As reported by Cragg and Newman, over 50% of anti-cancer drugs used in clinical experiments are derived from natural sources or are dependent on them (22). As a natural derivative of Curcuma Longa, CL extract demonstrates strong cancer chemopreventive properties through the activation of apoptosis or inhibition of the cell cycle (23, 24). Numerous studies have revealed that CL extract causes anti-cancer activities in many types of malignancies either as single agent or in combination with other drugs (25-30). In this study, we aimed at examining the anti-cancer activity of CL extract and its synergistic effect in combination with prednisolone on acute lymphoblastic leukemia Nalm-6 and REH cell lines.
The results of the present study indicated that CL extract induce a significant dose- and time-dependent cytotoxic effects on both Nalm-6 and REH cells. Results from published studies showed that Curcumin, as an ingredient of CL extract, has cytotoxic effects on different cancer cell lines such as Acute Lymphoblastic Leukemia (25, 31, 32). In addition, the analysis of synergistic effect showed that CL extract significantly amplified cytotoxic effect of prednisolone on Nalm-6 cells (CI < 1); however, no synergistic effect was seen in REH cells, which could be attributed to lack of glucocorticoid receptor in this cell line (33). Of particular interest, we found minimum damage by different doses of CL extract on bovine kidney MDBK cells, which is in consistent with a study by Christine Syng-ai et al., who reported that CL extract does not cause any damage to normal lymphocyte, primary hepatocytes, rat skin fibroblasts, and some normal cell lines (34). To study whether CL extract-induced cytotoxicity is mediated through induction of apoptosis, Annexin V staining method was employed. The results of flowcytometry revealed that CL extract not only induced apoptosis in both Nalm-6 and REH cells, but also enhanced prednisolone-induced apoptosis in Nalm-6, but not REH, as compared to the administration of each agent alone. In line with our findings, Mishra et al. found considerable pro-apoptotic potential of curcumin in REH and RS4; 11 cell lines (26).
Apoptosis can be promoted by a variety of extra- and/or intra-cellular factors in highly conserved and intimately cellular process. Among cellular factors, a fine-tuned balance between Bax (potent activator of apoptosis) and Bcl-2 (anti-apoptotic counterpart of Bax) is the most important and determines the receptiveness of the cell to death stimulus (35). To investigate the role of apoptotic genes that may modulate CL-induced apoptosis, the transcriptional activity of aforementioned genes was studied. Our results revealed that single agent of CL extract shifted the ratio of death promoter to death repressor genes via alteration of Bax and Bcl-2 expression in both Nalm-6 and REH cells. These change resulted in caspase 3 activation, which in turn initiated downstream events that lead to DNA fragmentation and subsequent apoptosis. In corroboration, Gue et al. indicated that curcumin-induced apoptosis in colorectal cancer cells is mediated through the induction of Bax coupled with reduced mRNA expression of Bcl-2 genes (36). The analysis of combination treatment series in Nalm-6, but not REH, also showed that CL extract plus 1 μM of prednisolone resulted in a significant increase both in Bax/Bcl-2 ratio and caspase 3 activities, which was more than inductive effect when either agent used alone.
In conclusion, our results showed that CL extract, as a natural nontoxic compound, not only exerts cytotoxic effect in Nalm-6 and REH pre B ALL cells, but also enhances the effectiveness of prednisolone on cell growth inhibition and apoptosis induction in semi-resistance Nalm-6 cells. This study may supply insight into the application of this new combination therapy to ALL cells intrinsically less sensitive to glucocorticoids and suggested a novel combination therapy for patient with more aggressive disease. However, further investigations, including clinical trial, are warranted to determine the usefulness of CL extract.