


1. Background
2. Objectives
3. Methods
3.1. Ethics Approval and Consent to Participate
3.2. Inclusion Criteria
3.3. Exclusion Criteria
3.4. Sample Size Calculation
3.5. Cohorts
3.6. Professional-Led Care
3.6.1. Nurse-Led Care
3.6.2. Consultant-Led Usual Care
3.7. Aerobic Exercises
3.8. Outcome Measures
3.9. Demographical and Clinical Parameters
3.10. Quality of Life
3.11. Hospital Anxiety and Depression Scale
3.12. Survival
3.13. Personal Satisfaction of Patients
3.14. Clinical Benefits for Treatment of Thyroid Cancer with 12 Months of Aftercare
3.15. Statistical Analyses
4. Results
4.1. Study Population
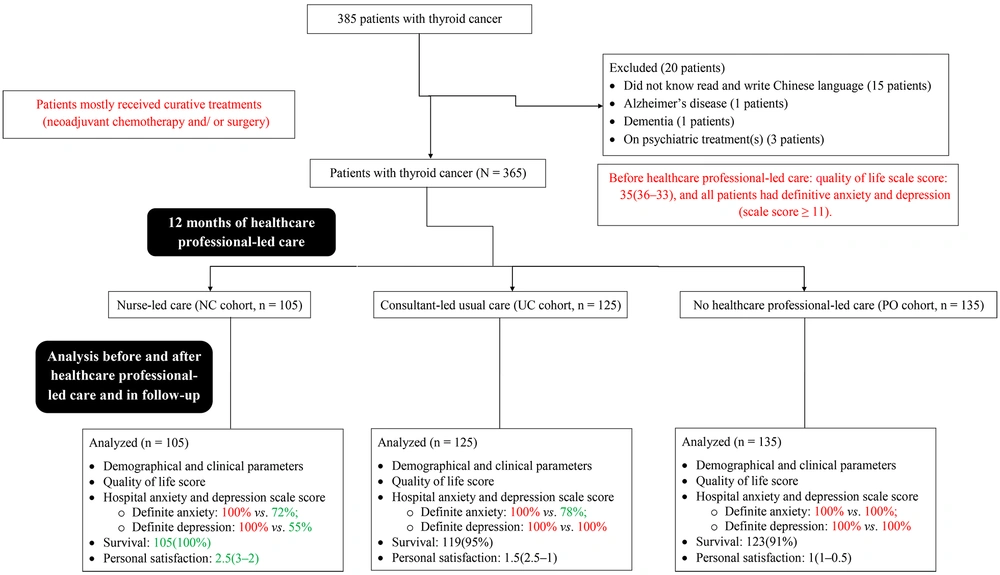
The study flow chart of retrospective analysis. Red color indicates worse parameters. Green color indicates good outcomes after 12 months of treatment for thyroid cancer with healthcare professional-led care. Black indicates stable parameters — not better, but not worse either.
4.2. Demographical and Clinical Parameters
| Health Professional for Cancer Supportive Care | Total (N = 365) | Cohorts | Comparisons Among Cohorts | |||
|---|---|---|---|---|---|---|
| NC (n = 105) | UC (n = 125) | PO (n = 135) | ||||
| - | Nurse | Consultant | None | P-Value | df | |
| Gender | 0.9032 (χ2-test of independence) | 2 | ||||
| Female | 215 (59) | 60 (57) | 75 (60) | 80 (59) | - | - |
| Male | 150 (41) | 45 (43) | 50 (40) | 55 (41) | - | - |
| Age (y) | 56 (60 - 48) | 54 (59 - 50) | 58 (60 - 49) | 56 (60 - 45) | 0.1032 (Kruskal-Wallis’ test) | N/A |
| Marital status | 0.9168 (χ2-test of independence) | 2 | ||||
| Married | 350 (96) | 100 (95) | 120 (96) | 130 (96) | - | - |
| Single | 15 (4) | 5 (5) | 5 (4) | 5 (4) | - | - |
| Educational status | 0.2435 (χ2-test of independence) | 6 | ||||
| Primary | 44 (12) | 10 (10) | 18 (14) | 16 (12) | - | - |
| Secondary | 145 (40) | 40 (38) | 50 (40) | 55 (41) | - | - |
| Higher secondary | 104 (28) | 30 (28) | 37 (30) | 37 (27) | - | - |
| Graduate and above | 72 (20) | 25 (24) | 20 (16) | 27 (20) | - | - |
Abbreviations: df, degree of freedom; N/A, not applicable.
a Categorial variables are depicted as the frequencies with percentages in parenthesis.
b Continuous not normal variables are depicted as medians with Q3-Q1 in parentheses.
c All results were considered significant if the P-value was less than 0.05 at a 95% confidence interval.
| Parameters | Total (N = 365) | Cohorts | Comparisons Among Cohorts | |||
|---|---|---|---|---|---|---|
| NC (n = 105) | UC (n = 125) | PO (n = 135) | ||||
| - | Nurse | Consultant | None | P-Value | df | |
| Health Professional for Supportive Cancer Care | ||||||
| Body Mass Index (kg/m2) | 24.5 (25 - 24) | 24.5 (25 - 24) | 25 (25 - 24) | 24.5 (25 - 24) | 0.6747 (Kruskal-Wallis’ test) | N/A |
| Co-morbidities | 29 (8) | 7 (5) | 11 (9) | 11 (8) | 0.8323 (χ2-test of Independence) | 2 |
| Treatments | 0.8263 (χ2-test of independence) | 6 | ||||
| Neoadjuvant | 19 (5) | 5 (5) | 7 (6) | 7 (5) | ||
| Surgery | 150 (41) | 45 (43) | 55 (44) | 50 (37) | ||
| Adjuvant chemotherapy | 45 (12) | 15 (14) | 15 (12) | 15 (11) | ||
| Adjuvant chemoradiotherapy | 151 (42) | 40 (38) | 48 (38) | 63 (47) | ||
| EORTC QLQ-C30 Chinese version d | 35 (36 - 33) | 35 (38 - 32.5) | 35 (35 - 33) | 34 (36 - 32) | 0.286 (Kruskal-Wallis’ test) | N/A |
| Hospital Anxiety and Depression Scale Score e | ||||||
| Anxiety Scale | 0.1644 (Kruskal-Wallis’ test) | N/A | ||||
| Mean (Q3 - Q1) | 15 (17 - 13) | 14 (17 - 12) | 14 (16.5 - 13) | 15 (17 - 13) | ||
| No anxiety | (0) | (0) | (0) | (0) | ||
| Mild anxiety | (0) | (0) | (0) | (0) | ||
| Definite anxiety | 365 (100) | 105 (100) | 125 (100) | 135 (100) | ||
| Depression Scale | 0.069 (Kruskal-Wallis’ test) | N/A | ||||
| Mean (Q3 - Q1) | 12 (12.5 - 11) | 12 (12 - 11) | 12 (13 - 11) | 12 (12 - 11) | ||
| No depression | (0) | (0) | (0) | (0) | ||
| Mild depression | (0) | (0) | (0) | (0) | ||
| Definite depression | 365 (100) | 105 (100) | 125 (100) | 135 (100) | ||
Abbreviations: df, degree of freedom; N/A, not applicable.
a Categorial variables are depicted as the frequencies with percentages in parenthesis.
b Continuous and ordinal not normal variables are depicted as medians with Q3-Q1 in parentheses.
c All results were considered significant if the P-value was less than 0.05 at a 95% confidence interval.
d The total score was 100. The higher the score higher is quality of life.
e 0 - 7: No anxiety/ depression, 7 - 10: Mild anxiety/ depression, 11 - 21: Definite anxiety/ depression.
4.3. Outcome Measures
4.3.1. Quality of Life
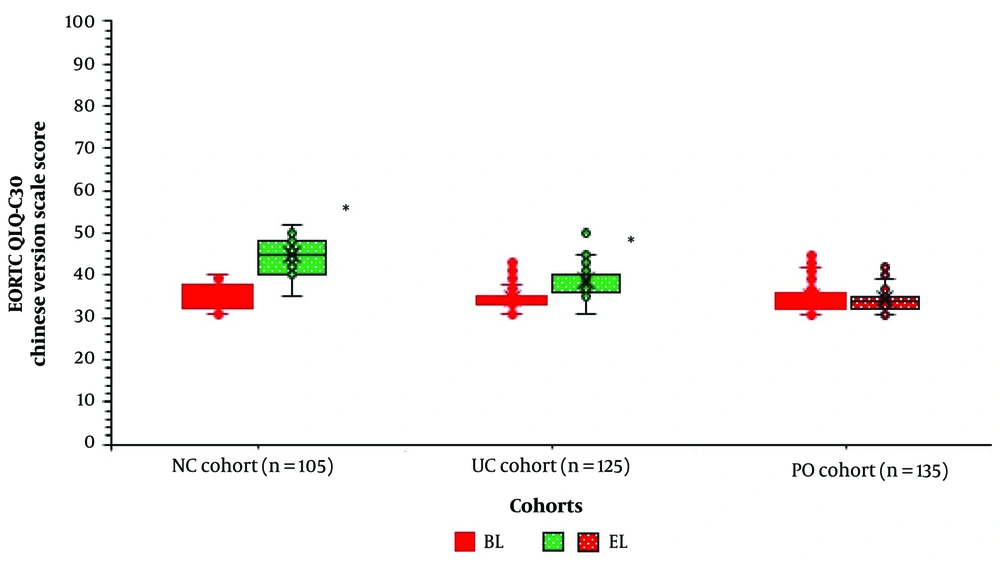
Quality of life of patients with thyroid cancer. The total score of EORTC QLQ-C 30 was 100. A higher score indicated a higher quality of life. BL: Before the treatment of thyroid cancer and the follow-up period; EL: After the treatment of thyroid cancer and the follow-up period (12 months of healthcare professional-led care). * Significantly higher than BL. Upper whisker: Maximum value, upper box line: Third quartile value, x: Median value, lower box line: First quartile value, lower whisker: Minimum value. Red color indicates worse score of EORTC QLQ-C 30. Green color indicates good score of EORTC QLQ-C 30 after 12 months of treatment of thyroid cancer with healthcare professional-led care. Black indicates no improvements in score of EORTC QLQ-C 30.
4.4. Hospital Anxiety and Depression Scale
4.4.1. Anxiety Scale Score
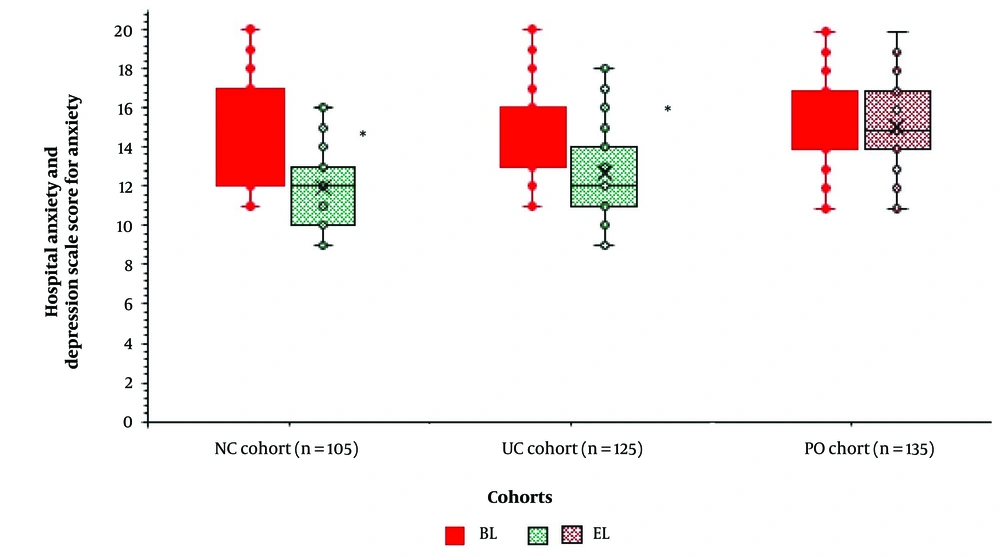
Anxiety scale score for Hospital Anxiety and Depression Scale. The total score is 21. 0 - 7: No anxiety, 7 - 10: Mild anxiety, and 11 - 21: Definite anxiety. BL: Before the treatment of thyroid cancer and the follow-up period, EL: After 12 months of healthcare professional-led care. * Significantly lower than BL. Upper whisker: Maximum value, upper box line: Third quartile value, x: Median value, lower box line: First quartile value, lower whisker: Minimum value. Red color indicates worse score of anxiety. Green color indicates good score of anxiety after 12 months of treatment of thyroid cancer with healthcare professional-led care. Black indicates no improvements in the score of anxiety.
4.4.2. Depression Scale
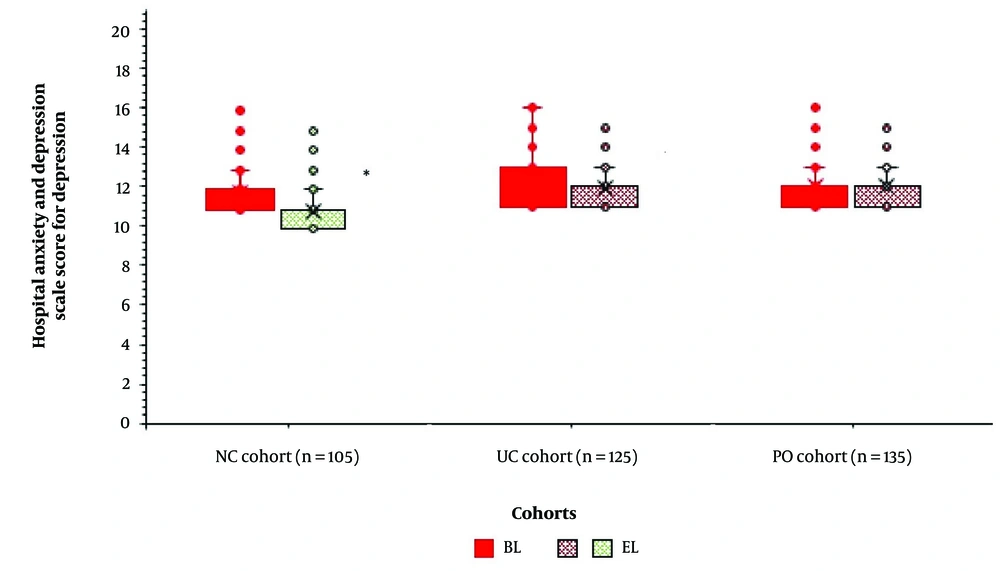
Depression Scale score for Hospital Anxiety and Depression Scale. The total score is 21. 0 - 7: No depression, 7 - 10: Mild depression, and 11 - 21: Definite depression. BL: Before the treatment of thyroid cancer and the follow-up period with or without healthcare professional-led care, EL: After 12 months of treatment of thyroid cancer and the follow-up period with or without healthcare professional-led care. * Significantly lower than BL. Upper whisker: Maximum value, upper box line: Third quartile value, x: Median value, lower box line: First quartile value, lower whisker: Minimum value. Red color indicates worse score of depression. Green color indicates good score of depression after 12 months of treatment of thyroid cancer with healthcare professional-led care. Black indicates no improvements in the score of depression.
4.5. Survival
4.6. Personal Satisfaction of Patients
| Parameter | Total (N = 365) | Cohorts | Comparison Between UC and PO | ||||
|---|---|---|---|---|---|---|---|
| NC (n = 105) | Cohorts UC (n = 125) | PO (n = 135) | |||||
| - | Nurse | P-Value d | Consultant | P-Value d | None | P-Value | |
| Health Professional for Cancer Supportive Care | |||||||
| EORTC QLQ-C30 Chinese version scale score e | 40 (42 - 35) | 45 (48.5 - 40) | < 0.001 (Kruskal - Wallis’ test/Dunn’s multiple comparison test) | 40 (40 - 35.5) | < 0.001 (Kruskal-Wallis’ test/Dunn’s multiple comparison test) | 34 (35 - 32) | < 0.001 (Kruskal-Wallis’ test/Dunn’s multiple comparison test) |
| Hospital Anxiety and Depression Scale Score f | |||||||
| Anxiety Scale | |||||||
| Medians (Q3 - Q1) | 15 (13 - 11) | 12 (13.5 - 10) | < 0.001 (Kruskal-Wallis’ test/Dunn’s multiple comparison test) | 12 (14.5 - 11) | < 0.001 (Kruskal-Wallis’ test/Dunn’s multiple comparison test) | 15 (17 - 13) | < 0.001 (Kruskal-Wallis’ test/Dunn’s multiple comparison test) |
| No anxiety | (0) | (0) | 0.3654 (χ2-test) | (0) | < 0.0001 (Fisher exact test) | (0) | < 0.0001 (Fisher exact test) |
| Mild anxiety | 56 (15) | 29 (28) | 27 (22) | (0) | |||
| Definite anxiety | 309 (85) | 76 (72) | 98 (78) | 135 (100) | |||
| Depression Scale | |||||||
| Medians (Q3-Q1) | 12 (12 - 11) | 11 (11 - 10) | < 0.001 (Kruskal-Wallis’ test/Dunn’s multiple comparison test) | 12 (12 - 11) | > 0.05 (Kruskal-Wallis’ test/Dunn’s multiple comparison test) | 12 (12 - 11) | > 0.05 (Kruskal-Wallis’ test/Dunn’s multiple comparison test) |
| No depression | (0) | (0) | < 0.0001 (Fisher exact test) | (0) | < 0.0001 (Fisher exact test) | (0) | N/A |
| Mild depression | 47 (12) | 47 (45) | (0) | (0) | |||
| Definite depression | 318 (88) | 58 (55) | 125 (100) | 135 (100) | |||
| Survival | 347 (95) | 105 (100) | 0.0327 (Fisher exact test) | 119 (95) | 0.0014 (Fisher exact test) | 123 (91) | 0.2277 (Fisher exact test) |
| Personal satisfaction of patients g | 1.5 (2.5 - 1) | 2.5 (3 - 2) | < 0.001 (Kruskal-Wallis’ test/Dunn’s multiple comparison test) | 1.5 (2.5 - 1) | < 0.001 (Kruskal-Wallis’ test/Dunn’s multiple comparison test) | 1 (1 - 0.5) | < 0.001 (Kruskal-Wallis’ test/Dunn’s multiple comparison test) |
a Categorial variables are depicted as the frequencies with percentages in parenthesis.
b Continuous and ordinal not linear variables are depicted as medians with Q3 - Q1 in parentheses.
c All results were considered significant if the P-value was less than 0.05 at a 95 confidence interval
d Concerning NC cohort.
e The total score was 100. The higher the score higher is quality of life.
f 0 - 7: No anxiety/ depression, 7 - 10: Mild anxiety/ depression, 11 - 21: Definite anxiety/ depression.
g Total score was 4. The higher the score higher the personal satisfaction of patients.
4.7. Clinical Benefits for Treatment of Thyroid Cancer with 12 Months of After Care
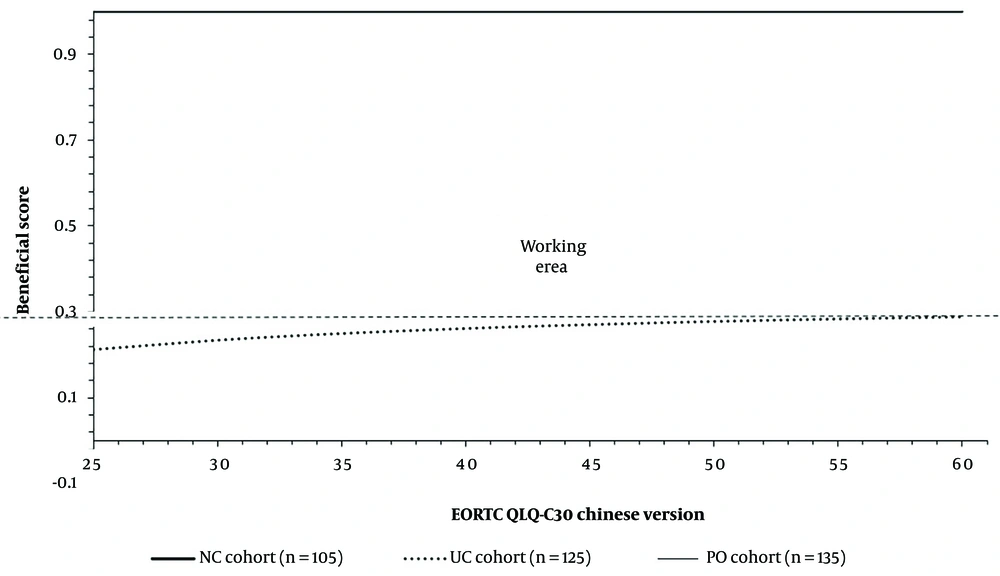
The clinical benefits for treatment of thyroid cancer with 12 months of aftercare with or without healthcare professional-led care. The working area is the area under the curve of that adopted aftercare method. For all adopted aftercare methods, more than 10 score differences in the quality of life scores after 12 months of follow-up with healthcare professional-led care for patients with thyroid cancer were used as the reference standard.
| EORTC QLQ-C30 Chinese Version | Beneficial Score | ||
|---|---|---|---|
| NC Cohort (n = 105) | UC Cohort (n = 125) | PO Cohort (n = 135) | |
| Nurse | Consultant | None | |
| Health Professional for Cancer Supportive Care | |||
| Numbers of patients with ≥ 10% difference of EORTC QLQ-C30 Chinese version scale (primary objective) | 105 | 84 | 15 |
| Numbers of patients with < 10% difference of EORTC QLQ-C30 Chinese version scale | 0 | 41 | 120 |
| 25 | 1 | 0.21 | -1.13 |
| 30 | 1 | 0.23 | -1.07 |
| 33 | 1 | 0.24 | -1.05 |
| 35 | 1 | 0.25 | -1.03 |
| 37 | 1 | 0.26 | -1.02 |
| 40 | 1 | 0.26 | -1 |
| 43 | 1 | 0.27 | -0.98 |
| 48 | 1 | 0.28 | -0.96 |
| 50 | 1 | 0.28 | -0.96 |
| 55 | 1 | 0.28 | -0.94 |
| 60 | 1 | 0.29 | -0.93 |
| Working area for patients | 0 - 1 beneficial score for > 0 EORTC QLQ-C30 Chinese version scale | 0 - 0.29 beneficial score for patients with > 25 EORTC QLQ-C30 Chinese version scale | None for all patients |
| Risk of under aftercare for patients with QoL score | None for any scale | < 25 EORTC QLQ-C30 Chinese version scale | < 65 EORTC QLQ-C30 Chinese version scale |
a Difference of EORTC QLQ-C30 Chinese version scale calculated with regards to quality of life scores of patients of PO cohort before the treatment of thyroid cancer and the 12-month follow-up period.


