
1. Background
Over the past decades, electrochemical therapy (EChT) has been considerably used to treat superficial tumors of the human body by applying direct electrical current (DC) (1-4). It is a valuable alternative for patients who are not supposed to be surgically treated or cannot take chemo/radiotherapies (5, 6).
Electrochemical therapy can be a reliable treatment method for superficial/visceral tumors in both malignant and benign cases (7). Moreover, it can be a proper alternative in nonresectable tumor treatment, potentially saving peripheral vital tissues (8-10). In developing countries that do not have advanced medical infrastructure and technological treatment methods, it is considered an effective method with low cost, non-toxic, and non-invasive (11).
During the EChT process, tissue electrolysis is performed by applying an electrical voltage through two or more metallic electrodes into the tumor, resulting in negligible pH changes in the tumor environment (6). Some reactions, such as cell edema, cell lysis, denaturation (7), loss of tissue water due to electro-osmosis (8), and coagulation of cytoplasmic proteins, ultimately lead to tumor necrosis in EChT (3). Moreover, the combined electrochemical reactions result in toxic products that depend on the involvement of reactive oxygen species (ROS) (10).
Obstruction of local arteries and veins in EChT is an advantage over other treatments in treating malignant tumors and can be done on an outpatient basis. while the locally applied electric current may increase tissue temperature, these thermal effects are insignificant (4).
Online monitoring of treatment effectiveness by common clinical methods is challenging due to the high rate of tissue distortions and liquid or gaseous byproducts made through the process. Sonographic evaluations are applicable only after tissue reconstructions, which may take several days or weeks. Hence, the existence of a real-time detection method for possibly remaining tissue involved is of serious concern in EChT. Using the Electrical Impedance Spectroscopy (EIS) technique for online tumor treatment monitoring had previously been reported in the literature (1). The EIS technique has attracted much attention as a low-invasive and real-time cancer diagnosis method through the differentiation of the dielectric properties of biological tissues related to the pathophysiological status of the biological sample (12, 13).
Electrical impedance spectroscopy is a highly promising tool for characterizing biomaterials by analyzing their intrinsic properties' behavior while applying voltage to them. In this method, electrical stimulation is applied to the biological material, and parameters are calculated as frequency functions such as electrical impedance (Z), impedance modulus (|Z|), and impedance phase (ρ) (14).
Another important concern is investigating the side effects of the EChT on patients' blood composition. By lysing the organs and cells, the intracellular content is released. Since these biological components are incompatible with the extracellular media, it can lead to an inflammatory reaction that causes edema. Eventually, these wastes enter the interstitial fluid and are subsequently dumped into the lymphatic and blood vessels. Since lymph or blood fluid changes may raise concerns about patients' health, real-time detection of blood changes during and after EChT may be a valuable outcome (15, 16).
Based on the limited research available, EChT appears to have little impact on blood. von Euler et al. claimed that EChT causes no differences in venous blood gas parameters (17). In addition, the hematological parameters under the test experienced no changes after EChT. Yet, differential count variables in the blood, such as lymphocytes and polymorphonuclear neutrophils, changed to some extent after EChT (16).
2. Objectives
This study investigated the role of EIS as the technique for real-time monitoring of peripheral blood after EChT for the first time.
3. Methods
3.1. Patients and Setting
The Ethics Committee of Shahid Beheshti University of Medical Sciences approved this study. The study evaluated the role of EIS in monitoring the mineral blood levels during EChT (Electrochemotherapy) in 26 women with stage III/IV breast cancer. These patients underwent EChT routinely between 2022 and 2023 at Shohadaye Tajrish Hospital, affiliated with Shahid Beheshti University of Medical Sciences. The procedures were conducted sequentially among the referred patients, and informed consent was obtained from all participants. Ultimately, 19 patients were included in the study (Figure 1). The treatment was done routinely for the patients. The researcher used the EIS technique to evaluate the peripheral blood balance during the treatment and did not interfere with the patient's treatment process or choice of treatment.
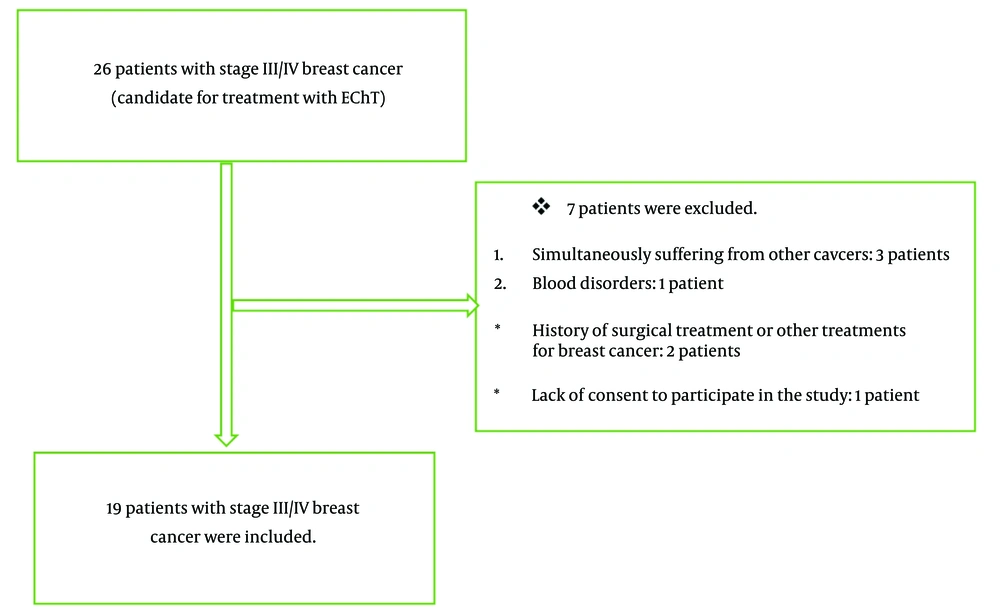
Figure 1.
Study flowchart
3.2. Inclusion and Exclusion Criteria
The inclusion criteria included women with unilateral breast cancer candidates for EChT, age range of 20 - 75 years, cancer stage III/IV, and informed consent to participate in the study. Previous suffering from breast cancer or other malignancies, blood disorders, immunodeficiency disorders, hemophilia, patients requiring blood transfusion, history of surgical treatment or other treatments for breast cancer, stages I/II of cancer, and lack of informed consent to participate in the study were defined as exclusion criteria.
3.3. Outcomes
The outcomes included the levels of hematological factors, serum iron concentrations, apoptosis of peripheral blood mononuclear cells (both early and late), and the balance of peripheral blood properties. Cells that can return to a live and viable phase after treatment are defined as early apoptosis, while cells that cannot return to a live and viable phase are defined as late apoptosis. Early and late apoptosis were measured using flow cytometry. To assess apoptosis, a fluorescent dye was injected into the cells, and laser light was directed from the front. Two detectors were used: One positioned at the front and the other at the bottom of the cell nucleus. By evaluating the relative position of the cytoplasm to the cell nucleus, the type of apoptosis can be determined.
The level of hematological factors (monocyte%, Eosinophil%, Lymphocyte%, Neutrophil%, PLT(×103/µL), MCHC (g/dL), MCH (pg), MCV (fL), HCT %, HGB (g/dL), RBC (×106/µL), WBC (×103/µL)), Serum iron test) (Ca (mg/dL), Na (mEq/L), K (mEq/L) (were measured using EIS in the frequency range of 1 Hz to 500 kHz before and after EChT. Apoptosis of peripheral blood mononuclear cells and the balance of peripheral blood properties were measured and recorded with EIS before and 30 minutes after EChT. The concentrations of serum iron (potassium, sodium, and calcium) in the blood were measured to validate the electrical response. sodium and potassium were measured to evaluate the body's main electrolytes and calcium to investigate the behavior of cells before and after EChT.
The researcher gathered baseline characteristics, including patients' age and tumor details (tumor stage, pathology before and after treatment, tumor size, and chemotherapy), using a checklist.
3.4. Measuring Tools
3.4.1. Electrical Impedance Spectroscopy (Sensor and System Configuration)
As depicted in Figure 2A, EIS analysis utilizes two medical-grade stainless steel needles (G21 disposable spinal cannula and G16 I.V. cannula) connected with two electrical banana connectors. Also, the magnified view of the needle tip is demonstrated in Figure 2A. The internal spinal needle's tip is about 2 mm outside the plastic shield, acting as the electrical insulator between the two needles. The two needles' tips are 3.5 mm apart longitudinally.) Figure 2B (the phase diagrams of the impedance were retrieved from an applied voltage of 0.4 V in the 1 Hz to 500 kHz frequency range.
3.4.2. Validity and Reliability of Electrical Impedance Spectroscopy
The validity and reliability of EIS were first evaluated in an animal model with five young adult female Fischer 344 rats aged 6 - 8 weeks. These rats were purchased from the Pasteur Institute and kept in separate cages for one week to acclimatize to the environment.
Rats were anesthetized using a combination of ketamine (75 mg/kg) and acepromazine (10 mg/kg body weight) (21). To reduce the pain of the mice during the treatment, a combination of midazolam and ketamine was injected. Then, 10 - 12 volts were applied to two metal electrodes for 15 - 20 minutes, and a current of 7 - 9 milliamps was measured. One ml of blood was taken from the hearts of mice, and an EIS measurement was performed. Then, blood samples were taken from them and analyzed using EIS. Afterward, rats underwent EChT, and blood samples were taken from the rats again. Finally, the blood impedance was measured after the treatment. Figure 2C1 - C3 demonstrates rat blood's impedance and phase diagrams, which match the blood before and after EChT. The validity and reliability of the EIS were confirmed.
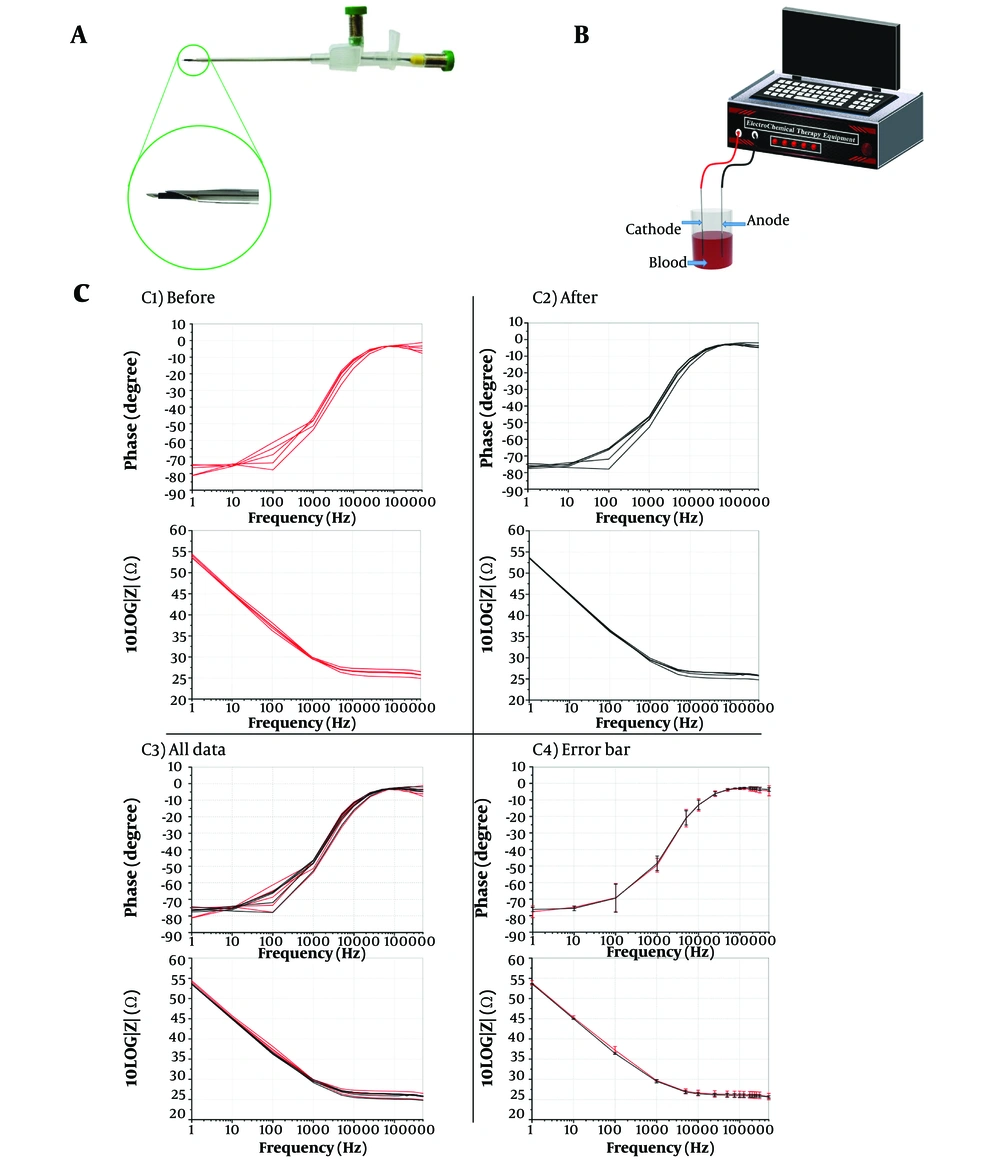
Figure 2.
A, two-electrode probe includes a medical-grade standard G16 I.V. cannula and a disposable G21 spinal cannula with two electrical banana connectors. These steel electrodes were used in the electrical impedance spectroscopy of the patient's blood and the magnification of the needle tip of two electrodes; B, schematic of electrochemical therapy (EChT) blood process setup with two platinum needle electrodes: By applying a voltage of 5 volts for 3 to 4 minutes, a current of 4 to 9 mA flows; C, impedance phase and magnitude of five rats, C1, before EChT; C2, after EChT; C3, all data; and C4, error bars of before and after treatment in the frequency range of 1 Hz–500 kHz (before with red color and after with black color).
3.4.3. Sample Collection from the Patients
In total, 2 mL of blood was taken from the patient before EChT and 30 minutes after EChT, then poured into the K3-EDTA anticoagulant tube. The test tube was shaken five times to prevent blood clotting and then refrigerated. About 30 minutes after sampling, EIS analysis was performed on blood samples before and after EChT. All patients received systemic treatments after EChT.
To smear the blood samples, 100 µL of blood was poured onto a clean slide and then, another slide was used to spread the blood drop on the whole surface of the slide. The second slide must be clean and placed on the surface of the first slide. When the drop flows across the width of the second slide, the spreader slide (second slide) needs to be pushed across the whole surface. Methanol is the fixator for the sample. Next, methanol should be sprayed on the sample between wet and dry. After completely drying the sample, it will be soaked in the Giemsa solution for 20 minutes. To make the Giemsa solution, the Giemsa stain will be diluted with DI water at a ratio of 1: 10. Finally, the sample should be dried at room temperature.
Additionally, 100 μL of RBC lysis solution was added to a 100 μL blood sample. The resultant smear contained only white blood cells. The smear analysis results were obtained using a microscope equipped with a 40x lens.
3.4.4. Electrochemical Therapy Protocol
A 10-volt electrical voltage with a 70 to 90 mA constant current was applied to the tumor during EChT. Using EIS online monitoring, the extent of tumor destruction was measured before, during, and after EChT. After about 15 minutes, lysis of cancer cells in the tissue head changes the tumor impedance to reach the impedance of necrotic tissue (the impedance calibration value was obtained for healthy and cancerous tissues) (1).
Two mL of Two blood samples were collected from the patients. Of which, 1 mL was transferred to a small container as the control. An EIS test was performed on the control sample. Then, the other 1 mL of the sample was used for EChT. Two platinum needle electrodes, placed 10 mm apart, were inserted into the blood sample to apply EChT. The EChT device and the test setup are illustrated in Figure 2B.
To apply the EChT protocol to the blood, a constant DC voltage would be applied to the blood sample and gradually increased to approximately 5 volts by the EChT device. This constant DC voltage would be applied to the sample in three to four minutes. Every minute, the current between these two electrodes would be extracted. The electrical current between two platinum electrodes ranges from 4 - 9 mA.
Eight patients required general anesthesia before EChT and received it. Chest wall involvement, the need for multiple wire insertions, and multiple needle insertions were defined as indications for anesthesia administration.
3.4.5. Statistical Analyses
Data analysis was conducted using SPSS 22 statistical software. Descriptive statistics, including frequency and percentage, were utilized to report qualitative variables, while mean and standard deviation were used for reporting quantitative variables. Because of the low sample size, both a paired t-test and a non-parametric Wilcoxon test were utilized to compare the results before and after the intervention. A P-value of less than 0.05 is considered to indicate statistical significance.
4. Results
4.1. Basic Characteristics
The mean age of the patients was 51.1 ± 5.6 (range 31 to 74) years. The majority of patients had also received chemotherapy. Regarding tumor stage, 8 (42%) patients were in stage III and 58% in stage IV. Baseline characteristics, tumor, and treatment results for 19 patients are reported in Table 1.
Table 1.
Patient's Medical Information, Including age, Pathology Before and After Treatment, Tumor Stage, and Size
| Scan ID | Age | Stage | Pathology (Before EChT) | Chemo (Yes or No) | Size of Tumor (mm) | Pathology (After EChT) |
|---|---|---|---|---|---|---|
| 1 | 74 | IV | IDC | Yes | 64 × 70 × 40 | 10% necrosis of tumor |
| 2 | 43 | III | IDC | Yes | 50 × 30 × 15 | 85 - 90% necrosis of tumor |
| 3 | 45 | IV | DCIS-DIN2 | Yes | 93 × 84 × 40 | Fat necrosis |
| 4 | 47 | III | IDC | Yes | 40 × 56 × 80 | Fat necrosis |
| 5 | 31 | IV | IDC | Yes | 35 × 56 × 18 | 25% necrosis of tumor |
| 6 | 49 | IV | IDC | Yes | 100 × 75 × 25 | 70% necrosis of tumor |
| 7 | 63 | III | IDC | Yes | 28 × 26 × 25 | All margins free of tumor |
| 8 | 63 | III | IDC | No | 18 × 16 × 11 | All margins free of tumor |
| 9 | 56 | IV | Invasive carcinoma of no special type | Yes | 60 × 22 × 18 | All margins free of tumor |
| 10 | 40 | III | IDC | Yes | 24 × 15 × 23 | 30% necrosis of tumor |
| 11 | 44 | IV | IDC | Yes | 15 × 14 × 21 | Fat necrosis |
| 12 | 52 | IV | IDC | Yes | 101 × 44 × 19 | 70% necrosis of tumor |
| 13 | 71 | IV | IDC | Yes | 40 × 75 × 60 | 20% necrosis of tumor |
| 14 | 44 | III | IDC | Yes | 31 × 38 × 18 | 80%necrosis of tumor |
| 15 | 42 | IV | IDC | Yes | 90 × 40 × 80 | Fat necrosis |
| 16 | 48 | III | IDC | Yes | 38 × 52 × 78 | Fat necrosis |
| 17 | 33 | IV | IDC | Yes | 40 × 52 × 20 | 30% necrosis of tumor |
| 18 | 46 | IV | IDC | Yes | 95 × 70 × 28 | 85% necrosis of tumor |
| 19 | 61 | III | ILC | Yes | 30 × 24 × 26 | All margins free of tumor |
Abbreviation: EChT, electrochemical therapy.
4.2. Impedance Phase and Magnitude of Patients
phase and magnitude diagrams of 19 patients' blood at 1 - 500 kHz frequencies showed that blood impedance before and after EChT was consistent. (Figure 3A1 - A4.)
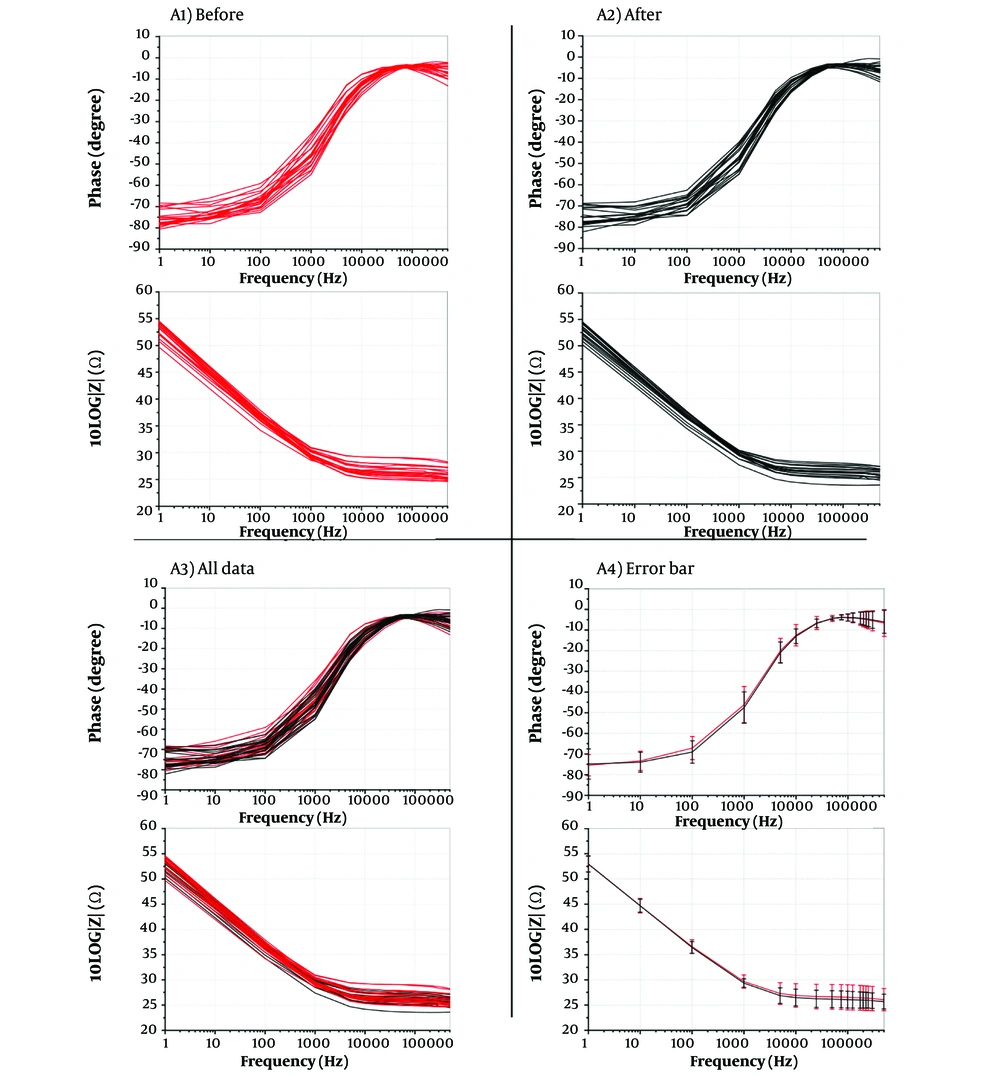
Figure 3.
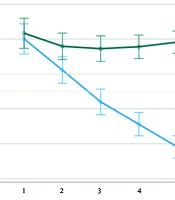
Impedance phase and magnitude of 19 patients A1, before electrochemical therapy (EChT); and A2, after EChT; A3, all data; and A4, error bars of before and after treatment in the frequency range of 1 Hz–500 kHz (before with red color and after with black color). As can be seen in the error bar plot above, it has an acceptable value that proves the appropriate balance of the peripheral blood of the patients after the electrochemical treatment.
4.3. Hematological Factors and Peripheral Blood Balance
Although the mean level of white blood cells (WBC) 10 days after EChT decreased by about 15% compared to before EChT, this difference was not statistically significant (P = 0.25). Additionally, no significant difference was observed in the mean level of red blood cells (RBC), platelets, and hemoglobin (HGB) before or ten days after EChT (Table 2).
Table 2.
Comparison of the CBC Values Before and After the Intervention
| CBC | Time | P-Value | |
|---|---|---|---|
| Before | After | ||
| WBC × (103/µL) | 9.18 | 7.52 | 0.25 |
| RBC× (103/µL) | 4.58 | 4.53 | 0.86 |
| HGB (g/dL) | 13.2 | 13.5 | 0.71 |
| HCT (%) | 41 | 42.5 | 0.78 |
| MCV (fL) | 83.4 | 81.5 | 0.58 |
| MCH (pg) | 27.4 | 26.9 | 0.44 |
| MCHC (g/dL) | 33.2 | 32.3 | 0.54 |
| PLT × (103/µL) | 331 | 323 | 0.61 |
| Neutrophil (%) | 60 | 58 | 0.66 |
| Lymphocyte (%) | 36 | 34 | 0.45 |
| Eosinophil (%) | 1 | 1 | 0.99 |
| Monocyte (%) | 1 | 3 | 0.19 |
Abbreviations: WBC, white blood cells; RBC, red blood cells; HGB, hemoglobin.
Blood potassium, sodium, and calcium ions were subjected to biochemical analysis to check blood ion balance. No significant difference was observed in the mean changes in blood potassium, sodium, and calcium ions before and after EChT (Table 3).
Table 3.
Comparison of the Average Blood ion Values Before and After the Intervention
| Ion | K (mEq/L) | Na (mEq/L) | Ca (mg/dL) |
|---|---|---|---|
| Time | |||
| Before | 3.7 | 138 | 10.1 |
| After | 3.6 | 140 | 10.3 |
| P-value | 0.75 | 0.57 | 0.81 |
4.4. Necrosis, Late Apoptosis, Early Apoptosis, and Viable Peripheral Blood Mononuclear Cells
Necrosis, late apoptosis, early apoptosis, and viable peripheral blood mononuclear cells (PBMCs) were evaluated 30 minutes after blood sampling. Initially, 81.6% of the cells were viable; however, this percentage decreased to 65.2% after EChT treatment. Necrosis and late apoptosis cells were approximately 13.7% and 2.75%, respectively, which increased to 16.9% and 16.4%, respectively, after treatment. In addition, the early apoptosis before treatment was 1.95%, which decreased to 1.49% after treatment. (Figure 4A and B).
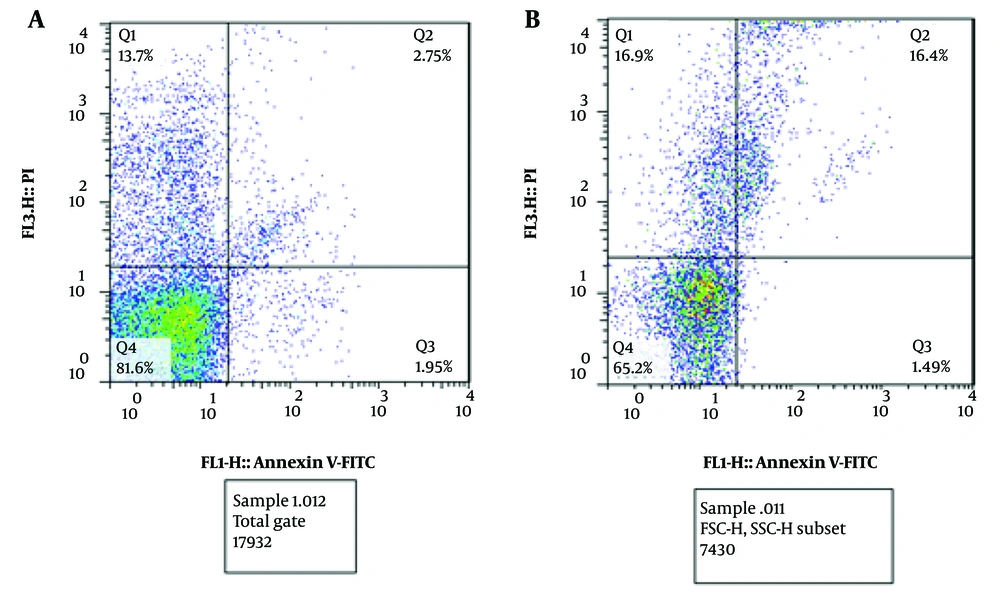
Figure 4.
A and B, necrosis (Q1 - Q3), and live blood cells (Q4) before and after the treatment process, respectively. It can be deduced that necrosis and late apoptosis of blood cells increase after electrochemical therapy (EChT). Also, live blood cells will decrease after the treatment. Moreover, early apoptosis of blood cells does not undergo any remarkable changes (it decreases slightly). Although live blood cells are decreased after EChT, post-treatment monitoring of the patients after ten days reveals that the patient’s blood will become normal after that time.
4.5. Response to Treatment
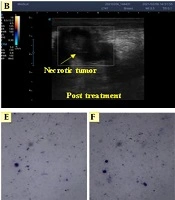
By applying EChT to the tumor, the blood flow in the vicinity of the tumor was gradually reduced as the mass progresses towards necrosis. The Doppler ultrasonography images of the tumor before and after EChT are shown in Figure 5A and B. For blood smearing, 1 mL of blood was voluntarily taken from a patient (Figure 5C. A part of the blood was undergone EChT with two platinum electrodes by applying a voltage of 5 volts. In the EChT process, a DC of approximately ten mA passes through the ionic liquid, chemically reacting with the electrodes and separating the ions. Afterward, similar to the previous method, a drop of blood undergoing EChT was smeared on the slide, as shown in Figure 5D - F illustrates white blood cells before and after EChT, showing that their morphology remained unchanged following the treatment. No significant change was observed in the smear samples before and after the treatment (P > 0.05).
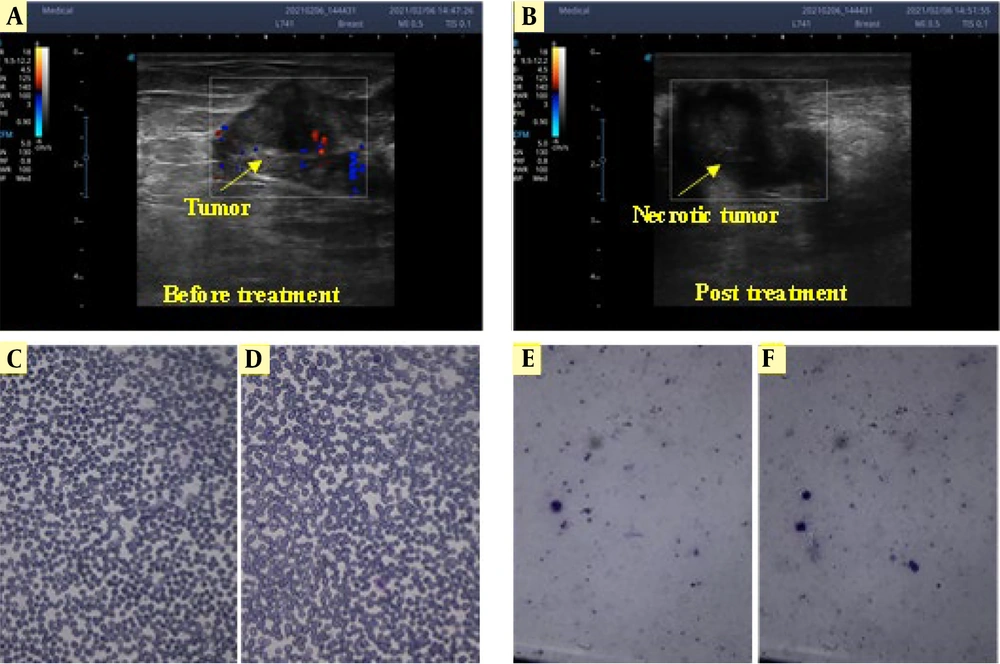
Figure 5.
Doppler ultrasonography enables live monitoring during the treatment process. Due to Doppler ultrasonography, before electrochemical therapy (EChT), blood flow to the tumor (that feeds the tumor) can be seen (A); but after EChT, it is almost stopped; and there is no blood flow to the tumor so the tumor is not being fed by blood (B); Smearing of whole blood cells (C and D); and white blood cells (E and F) before and after the treatment, respectively, with two platinum needle electrodes. No significant change was observed in the smear samples before and after the treatment.
5. Discussion
In recent years, many efforts have been devoted to treating superficial tumors with the EChT method. Peripheral blood balance is crucial for monitoring the patient's condition after treatment. In this study, for the first time, we investigated a role in identifying peripheral blood changes during EChT in 19 patients with breast cancer. Our study showed that the balance of blood ions was maintained after treatment, and their values were similar before and after treatment.
The EIS analysis showed that the electrical impedance of the blood samples before and after EChT was consistent, which indicates that the patient's peripheral blood balance was maintained under EChT.
Before EChT, blood flow was observed in the vicinity of the mass, but when the mass was treated and completely necrosed, the blood flow near the mass was almost zero. No changes in the appearance of white or red blood cells were observed with the application of EChT. Red blood cells were removed to identify white blood cells better. The results showed that the appearance of white blood cells remained unchanged after EChT.
The levels of potassium, sodium, and calcium ions in the blood remained unchanged before and after treatment.Ion balance are biological factors that explain the invariance of magnitude and phase impedance diagrams after EChT. Although viable PBMCs and WBCs decreased by about 15%, this difference was not statistically significant. The patients were followed up three months after EChT, and their general condition was normal. Therefore, the decrease in WBC did not have a long-term effect on the patient's condition and is compensated by the bone marrow.
Nabila et al. (24) showed that measuring the impedance value of biological substances in the form of blood samples has been widely used to determine the health status of people. They reported that EIS can help determine the severity of damage in ischemic stroke patients without changing peripheral blood hematological factors, which was in line with the results of our study. Desai et al. (25), developed a microfluidic device with integrated electrodes capable of interrogating and identifying cellular components in a patient-derived sample of isolated tumor cells using microelectrical impedance spectroscopy (μEIS). They reported that μEIS can detect isolated tumor cells in a sample of RBC and peripheral blood mononuclear cells (PBMCs) for five common cancer types: Lung, thyroid, breast, ovarian, and kidney.
Arya et al. (18), showed that EIS can be used as a simple and powerful tool for detecting and estimating human epidermal growth factor receptor 2 (HER2) in patients with breast cancer in undiluted serum. Pacheco (20) showed that the electrochemical sensor (with voltammetry and EIS techniques) could be used to monitor and diagnose breast cancer as a simple, efficient, and accessible tool. In another study, Sezgintürk. (21), developed a new biosensor that can help with cyclic voltammetry (CV) and EIS techniques to determine vascular endothelial growth factor (VEGF), characterize the immobilization process and detect VEGF. In 2023, Aggas (26) showed that multi-electrode bioelectrical impedance spectroscopy can be used for real-time monitoring of stratification of vascular composite allografts.
Overall, the review of the literature and our study's findings using EIS can contribute to real-time monitoring, diagnosis, and treatment of diseases, particularly cancer. However, there have been limited studies conducted in this area. Additionally, since our study is the only one of its kind, we were unable to compare our results with those from other studies that both align and disagree with our findings. The small sample size of the examined patients may increase the potential for random error in the comparison and interpretation of the results. However, the findings confirm that a new, inexpensive, simple, and efficient technique for real-time monitoring of peripheral blood changes—without the influence of hematological factors—after EChT can be beneficial for treatment.
Our study had strengths and weaknesses that should be addressed. According to the study's objectives, the small sample size of the examined patients in this study was the most important weakness. Also, due to the lack of another suitable method to monitor peripheral blood changes during treatment in patients treated with EChT, we could not compare our results with those of a control group, which could negatively affect the study results. A prospective study design with a larger sample size can help estimate the results more accurately. Designing and developing a new, cheap, simple, and efficient technique for real-time monitoring of peripheral blood changes without the effect of hematological factors in patients with cancer treated with EChT for the first time was the most important strength of this study.
5.1. Conclusions
Our study demonstrated that blood ion balance was maintained, and there were no significant changes in RBC, hemoglobin, or platelets. Both magnitude and phase diagrams remained consistent before and after treatment. Electrochemical impedance spectroscopy can be employed as a real-time method to monitor the peripheral blood status of patients without disrupting hematological factors and peripheral blood balance during EChT in breast cancer patients.