


1. Background
2. Objectives
3. Methods
3.1. Preparation of Research Treatments
3.2. MCF-10A Cell Line Culture and Counting
3.3. Cell Treatment and Toxicity Assessment Using the MTT Assay Technique
3.4. Statistical Analysis
4. Results
4.1. Examination of Treatment Growth Changes Compared to the Control Group
| Dose Cis Platin (µg/mL) | 24 h (% Viability) | 48 h (% Viability) | 72 h (% Viability) | |||
|---|---|---|---|---|---|---|
| Mean ± SD | P-Value | Mean ± SD | P-Value | Mean ± SD | P-Value | |
| 0 | 100.000 ± 3.171 | - | 100 ± 2.942 | - | 100.000 ± 2.207 | - |
| 5 | 95.086 ± 3.416 | NS | 76.029 ± 7.813 | < 0.0001 | 69.699 ± 1.830 | < 0.0001 |
| 10 | 94.885 ± 1.189 | NS | 69.662 ± 0.699 | < 0.0001 | 52.082 ± 0.844 | < 0.0001 |
| 20 | 89.093 ± 1.624 | NS | 39.6463.574 ± | < 0.0001 | 20.877 ± 2.890 | < 0.0001 |
| 30 | 80.548 ± 1.346 | 0.0008 | 19.529 ± 0.403 | < 0.0001 | 13.753 ± 0.502 | < 0.0001 |
| 40 | 50.040 ± 4.908 | < 0.0001 | 18.138 ± 0.834 | < 0.0001 | 13.534 ± 1.245 | < 0.0001 |
| 50 | 19.268 ± 2.444 | < 0.0001 | 19.047 ± 0.723 | < 0.0001 | 13.260 ± 0.905 | < 0.0001 |
| 75 | 14.722 ± 1.583 | < 0.0001 | 17.1210.668 ± | < 0.0001 | 12.438 ± 0.741 | < 0.0001 |
| 100 | 20.233 ± 2.672 | < 0.0001 | 17.495 ± 0.642 | < 0.0001 | 12.2740.528 ± | < 0.0001 |
| 250 | 17.578 ± 2.053 | < 0.0001 | 15.141 ± 0.668 | < 0.0001 | 12.110 ± 0.577 | < 0.0001 |
| 500 | 15.447 ± 2.760 | < 0.0001 | 13.590 ± 0.0926 | < 0.0001 | 11.945 ± 0.528 | < 0.0001 |
Abbreviation: NS, not significant.
| Dose RJ (µg/mL) | 24 h (% Viability) | 48 h (% Viability) | 72 h (% Viability) | |||
|---|---|---|---|---|---|---|
| Mean ± SD | P-Value | Mean ± SD | P-Value | Mean ± SD | P-Value | |
| 0 | 100 ± 0.426 | - | 100 ± 7.803 | - | 100 ± 5.507 | - |
| 5 | 99.261 ± 3.995 | NS | 100.534 ± 8.609 | NS | 103.926 ± 9.645 | NS |
| 10 | 98.211 ± 4.416 | NS | 99.889 ± 2.290 | NS | 111.295 ± 8.424 | NS |
| 20 | 98.797 ± 7.046 | NS | 102.572 ± 2.223 | NS | 121.763 ± 3.067 | 0.0002 |
| 30 | 97.722 ± 5.837 | NS | 104.914 ± 2.978 | NS | 126.854 ± 8.281 | < 0.0001 |
| 40 | 98.336 ± 5.551 | NS | 108.066 ± 5.664 | NS | 129.309 ± 8.854 | < 0.0001 |
| 50 | 97.637 ± 3.498 | NS | 111.858 ± 1.251 | NS | 135.675 ± 6.389 | < 0.0001 |
| 75 | 98.437 ± 3.269 | NS | 111.538 ± 9.182 | NS | 136.433 ± 9.935 | < 0.0001 |
| 100 | 99.548 ± 5.014 | NS | 111.538 ± 8.235 | NS | 144.835 ± 7.148 | < 0.0001 |
| 250 | 101.110 ± 4.721 | NS | 121.475 ± 4.735 | 0.0002 | 156.405 ± 3.247 | < 0.0001 |
| 500 | 97.273 ± 4.978 | NS | 130.769 ± 4.975 | < 0.0001 | 162.603 ± 1.992 | < 0.0001 |
Abbreviations: RJ, royal jell; NS, not significant.
| Dose MIX (µg/mL) | 24 h (% Viability) | 48 h (% Viability) | 72 h (% Viability) | |||
|---|---|---|---|---|---|---|
| Mean ± SD | P-Value | Mean ± SD | P-Value | Mean ± SD | P-Value | |
| 0 | 99.99 ± 7.656 | - | 100 ± 8.030 | - | 100 ± 13.479 | - |
| 5 | 97.794 ± 16.154 | NS | 90.1290 ± 8.278 | NS | 102.099 ± 20.991 | NS |
| 10 | 98.516 ± 9.120 | NS | 84.322 ± 11.844 | NS | 104.963 ± 20.565 | NS |
| 20 | 90.107 ± 15.201 | NS | 75.225 ± 9.1467 | NS | 102.671 ± 20.179 | NS |
| 30 | 75.359 ± 8.139 | NS | 60.258 ± 11.340 | 0.0003 | 83.778 ± 10.310 | NS |
| 40 | 69.258 ± 3.741 | 0.0199 | 43.225 ± 3.292 | < 0.0001 | 73.854 ± 2.064 | NS |
| 50 | 63.248 ± 10.181 | 0.0012 | 37.806 ± 6.293 | < 0.0001 | 69.656 ± 2.0106 | 0.0236 |
| 75 | 40.827 ± 1.485 | < 0.0001 | 37.677 ± 1.244 | < 0.0001 | 69.839 ± 2.623 | 0.0256 |
| 100 | 33.219 ± 5.451 | < 0.0001 | 37.161 ± 3.0233 | < 0.0001 | 70.289 ± 2.882 | 0.0301 |
| 250 | 30.935 ± 1.796 | < 0.0001 | 36.645 ± 3.658 | < 0.0001 | 69.274 ± 2.064 | 0.0201 |
| 500 | 30.305 ± 3.150 | < 0.0001 | 38.193 ± 0.805 | < 0.0001 | 70.658 ± 5.461 | 0.0411 |
Abbreviation: NS, not significant.
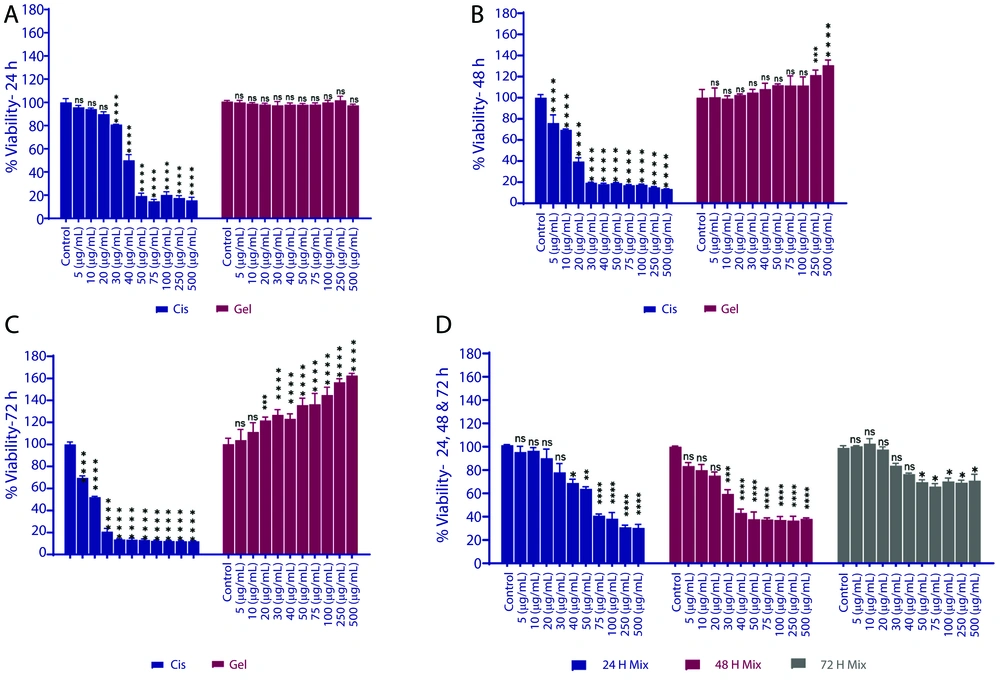
Cell viability of MCF-10A cells treated with cisplatin, royal jelly (RJ), and their combination over time. A, Cell viability after 24 hours of treatment with cisplatin, RJ, or their combination; B, cell viability after 48 hours of treatment at various concentrations; C, cell viability after 72 hours of exposure to the treatments; D, cell viability for the 1:1 combination of cisplatin and RJ at different time points. X-axis: Concentration (μg/mL). Y-axis: Percentage of cell viability (%). Significance is indicated by asterisks: * P < 0.05, ** P < 0.01, *** P < 0.001, **** P < 0.0001 compared to the control group.
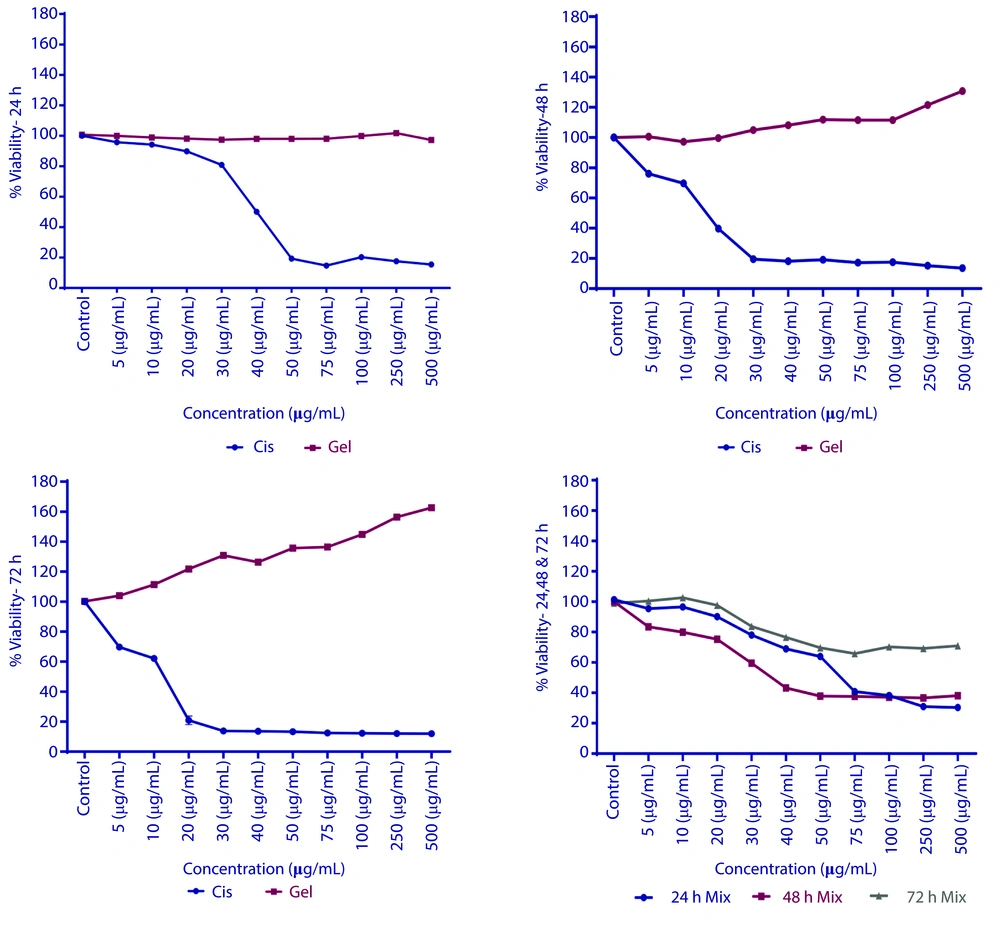
The effects of cisplatin (decreased viability), royal jelly (RJ) (increased viability at higher concentrations), and their combination (initial decrease followed by stabilization). Additionally, ensured the figure includes distinct data points for each treatment (cisplatin, RJ, combination) across time points (24, 48, 72 hours), with error bars for standard deviation.




