
1. Background
Acute lymphoblastic leukemia (ALL) is a heterogeneous hematopoietic malignancy characterized by the uncontrolled proliferation of immature lymphoid precursors, leading to the suppression of normal hematopoiesis (1). The disease encompasses biologically and clinically distinct subtypes defined by underlying genetic and molecular abnormalities. These alterations are reflected in diverse immunophenotypic, cytogenetic, and metabolomic profiles (2, 3). Accurate identification of recurrent chromosomal translocations is essential for the diagnosis, risk stratification, and therapeutic management of ALL (4). Consequently, current diagnostic guidelines integrate molecular testing alongside cytomorphology, immunophenotyping, and cytogenetics (5, 6). Specific recurrent chromosomal translocations are of paramount importance for both diagnostic and prognostic significance. Key among these are several recurrent abnormalities with significant prognostic implications (7). The ETV6-RUNX1 fusion, resulting from the t(12;21)(p13;q22) translocation, is identified in approximately 20 - 25% of childhood B-cell ALL cases and is associated with a favorable prognosis (8). In contrast, the BCR-ABL1 fusion, produced by the t(9;22)(q34;q11.2) Philadelphia chromosome, is found in 2 - 5% of pediatric and up to 25% of adult ALL cases, representing a high-risk subtype (9). Furthermore, the KMT2A-AFF1 rearrangement caused by t(4;11)(q21;q23) is a frequent finding in infant ALL, present in over 50% of cases, and is linked to an aggressive disease course (10), while the TCF3-PBX1 translocation caused by t(1;19)(q23;p13) is also a clinically significant entity (11).
The evolving diagnostic landscape of ALL is shaped by the balance between increasingly sophisticated technologies and the practical demands of routine clinical practice (12). While next-generation sequencing and single-cell assays offer unprecedented resolution for profiling subpopulations and tracking clonal evolution, their high cost, complex data analysis, and technical demands limit widespread adoption (13). Similarly, foundational techniques like karyotyping and Fluorescence in situ hybridization (FISH), though pioneering, are often hampered by prolonged turnaround times and resource-intensive protocols (14). In this context, real-time PCR maintains a pivotal role in the molecular diagnosis of ALL. It strikes a vital balance, offering rapid, sensitive, and quantitative detection of clinically imperative genetic alterations, such as the key translocations that dictate prognosis and therapy (15). The evolution of this workhorse technology, particularly through multiplexing, represents a powerful strategy for enhancing diagnostic efficiency. Multiplex real-time PCR consolidates the detection of multiple fusion transcripts into a single reaction, dramatically conserving time, reagents, and precious patient samples (16). When combined with SYBR Green chemistry, this approach offers a cost-effective, probe-free platform that relies on melting curve analysis for discrimination of specific amplification products (17). Accordingly, optimization of accessible and robust molecular diagnostic tools remains essential, particularly for laboratories operating in resource-limited settings. In this study, we described the development and analytical validation of a SYBR Green–based multiplex real-time PCR assay for the concurrent detection of four major prognostically significant ALL fusion transcripts: ETV6–RUNX1, TCF3–PBX1, KMT2A–AFF1, and BCR–ABL1. These translocations were selected because they represent the most common and clinically decisive genetic lesions in ALL, covering both favorable-risk and high-risk groups, and thus provide the greatest diagnostic yield while maintaining technical feasibility in a multiplex assay.
2. Objectives
The assay was designed to operate under a single, standardized set of reaction conditions and to provide a reliable, economical alternative for routine molecular screening in ALL.
3. Methods
3.1. Primers
In the present study, we utilized a combination of primer sets recommended by the Europe Against Cancer (EAC) program and those described in the study by Tong et al. (table 1 in Supplementary File) (18, 19). The schematic locations of the primer binding sites within their respective gene exons are illustrated in Figure 1. Primer sequences were designed to span the major breakpoint regions and exons involved in each fusion, accommodating known variant transcripts. For the BCR-ABL1 fusion, a single common ABL primer was employed to amplify both the p190 and p210 isoforms (Figure 1).
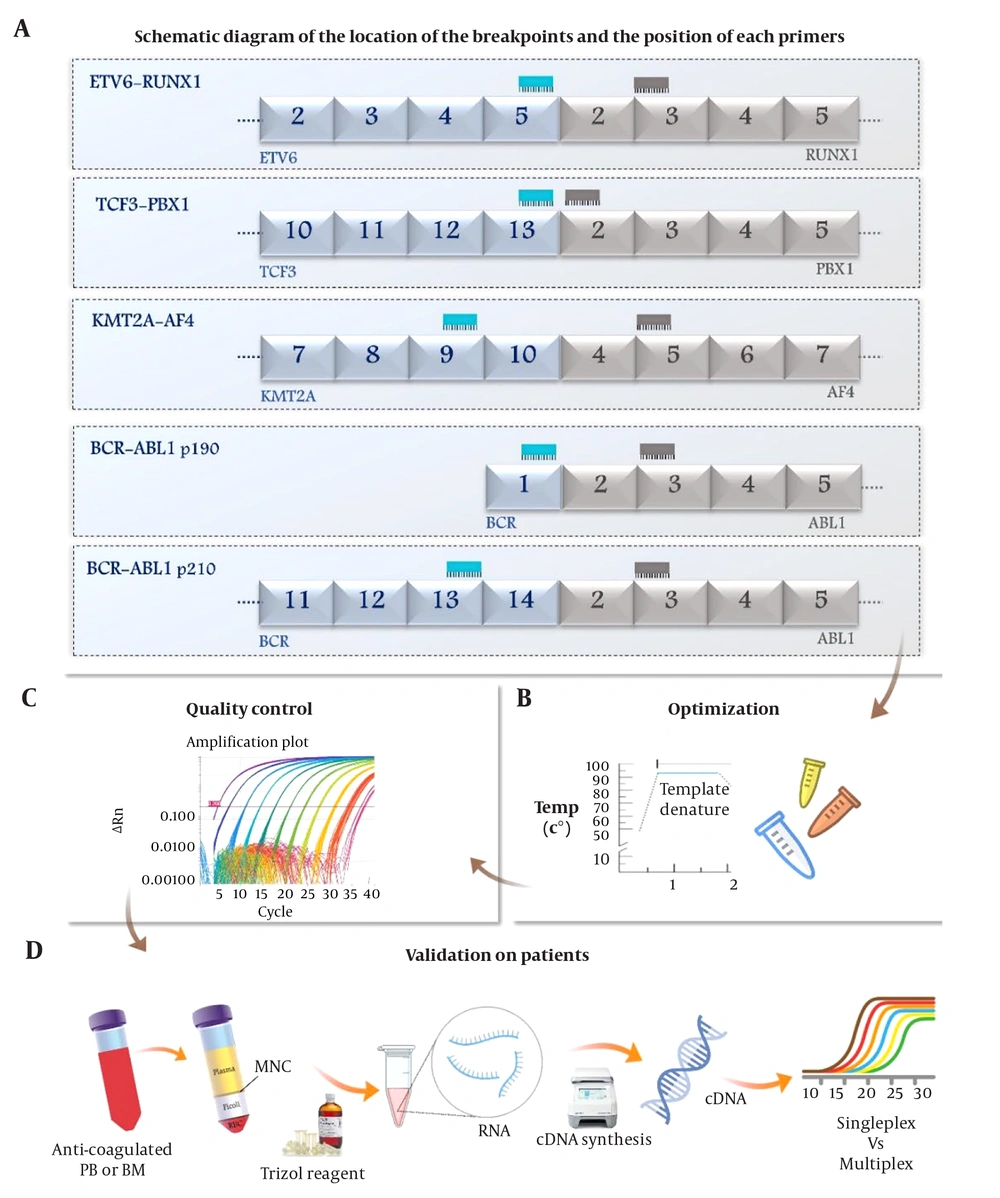
Figure 1.
Overview of the multiplex RT-qPCR design, optimization, and validation workflow for detecting recurrent ALL fusion transcripts; A, schematic representation of the exon structures of ETV6–RUNX1, TCF3–PBX1, KMT2A–AF4, BCR–ABL1 p190, and BCR–ABL1 p210, illustrating the typical breakpoint regions and the exact positions of the designed primers on each gene partner; B, optimization and quality control steps, including assessment of amplification and melting curves and evaluation of cycling parameters to ensure specificity, efficiency, and reproducibility of the multiplex assay; C, validation workflow on patient samples, beginning with anticoagulated peripheral blood or bone marrow, mononuclear cell isolation, RNA extraction, and cDNA synthesis, followed by comparison of singleplex and multiplex amplification performance on clinical specimens.
In silico, analyses were performed using NCBI Gene database resources. The resulting amplicon sizes and their theoretical melting temperatures (Tm) were calculated computationally. Using specialized multiplexing tools (Primer3Plus, NCBI Primer-BLAST, uMELT), the primer design was evaluated for dimerization potential and secondary structures, and the final concentrations were optimized accordingly. The HPRT reference gene was amplified in separate reactions to verify cDNA synthesis integrity and monitor for contamination. Its distinct melting temperature (Tm ≈ 78°C) enabled unambiguous discrimination from target amplicons during melt-curve analysis, thereby minimizing non-specific amplification and ensuring consistent normalization.
3.2. Singleplex and Multiplex Real-time PCR
Amplification reactions were performed on an ABI StepOnePlus™ Real-Time PCR system (Applied Biosystems, USA) using 96-well plates with a standardized reaction volume of 25 µL. All reactions were prepared using UltraPure nuclease-free water to mitigate exogenous contamination. Each run incorporated a comprehensive set of controls: A negative cDNA control (NC), positive plasmid DNA controls (PC) for each target translocation, and the non-template control (NTC) to ensure assay specificity and reliability.
The singleplex real-time PCR conditions were established through a systematic optimization process. Initially, the optimal annealing temperature for each primer set was determined using a thermal gradient protocol (58.0 - 64.0°C) on a Mastercycler Nexus GSX1 thermocycler (Eppendorf, Hamburg, Germany). The optimization reactions were performed in a 25 µL total volume, comprising 12.5 µL of master mix (Ampliqon, Denmark), 0.5 µL each of forward and reverse primer (10 µM), 5 µL of positive plasmid DNA control, and 6.5 µL of nuclease-free water (Pishgam Biotech Co., Tehran, Iran).
Following the establishment of individual singleplex reactions, primers were systematically combined to construct the multiplex assay. The strategy involved a stepwise approach, beginning with the development of all possible two-plex assays before progressing to three-plex, four-plex, and ultimately a comprehensive five-plex format. In each stage, singleplex reactions were run in parallel to enable direct comparison of cycle threshold (Ct) values and melting curve profiles.
Multiplex optimization was an iterative process. Primer concentrations were meticulously adjusted at each stage, with a focus on mitigating primer-dimer interactions predicted by in silico analysis and confirmed empirically. Similarly, the thermal protocol (temperature and duration of denaturation, annealing, and extension steps) was refined through comparative analysis of multiple experiments, evaluating Ct values and amplicon melting temperatures (Tm) against the singleplex.
3.3. Sample Collection
This study enrolled a cohort of 30 consecutively admitted patients with newly diagnosed ALL. As this study aimed to develop and preliminarily validate the assay, a pilot sample size of 30 patients was considered adequate according to diagnostic validation recommendations (20). Bone marrow aspirates or peripheral blood samples were collected in EDTA tubes from all participants. The cohort demographic (21 males, 9 females) reflected the characteristic age distribution of ALL, encompassing both pediatric and adult populations. To robustly validate the assay, the cohort was intentionally stratified to include patients with both previously confirmed translocation-positive ALL, encompassing key molecular subtypes, and translocation-negative status, as determined by established diagnostic methodologies. A definitive diagnosis for all subjects was rendered through an integrated diagnostic approach using cytomorphologic examination, multiparameter immunophenotyping, and standard molecular genetics. For comparative analysis, samples from ten healthy donors were included to serve as negative controls. The study protocol was reviewed and granted an ethical waiver by the Ethics Committee of Shahid Beheshti University of Medical Sciences (IR.SBMU.RETECH.REC.1403.404).
3.4. RNA Extraction and cDNA Synthesis
High-quality total RNA was isolated from patient samples using Trizol reagent (GeneAll Biotechnology, Seoul, South Korea). The extracted RNA underwent rigorous quality control; purity was verified spectrophotometrically via A260/A280 ratios (Eppendorf, Town, Country), and structural integrity was confirmed by gel electrophoresis. Subsequently, first-strand complementary DNA (cDNA) was synthesized from the positive patients from an optimized quantity of qualified total RNA in a 20 µL reaction volume, utilizing the AddBio cDNA Synthesis Kit (AddBio, Seoul, South Korea). The reaction mixture consisted of 1× Reaction Buffer, 500 μmol/L of each dNTP, 5 μmol/L each of Oligo(dT) and random hexamer primers, and 10 U/μL of reverse transcriptase, prepared in accordance with the manufacturer's specifications. The thermal cycling protocol for reverse transcription was initiated with a priming step at 25°C for 10 minutes, followed by a 60-minute elongation phase at 50°C, and concluded with enzyme inactivation at 80°C for 5 minutes.
3.5. Analytical Validation and Interpretation Criteria
The analytical performance of the multiplex assay was rigorously validated, and stringent criteria were established for the definitive identification of positive samples. A sample was confirmed as positive only upon satisfying a multi-faceted checklist: (I) a characteristic sigmoidal amplification curve crossing the fluorescence threshold; (II) a single, sharp peak in the melting curve analysis with a melting temperature (Tm) congruent with the positive controls (allowable deviation: ±1.0°C); (III) visualization of a single band of the expected amplicon size on agarose gel electrophoresis; (IV) the concurrent absence of amplification in non-template controls (NTCs); and (V) successful amplification of the HPRT internal control to confirm cDNA quality and reaction integrity.
Assay specificity was comprehensively evaluated through a multi-tiered strategy. This included in silico specificity confirmation via primer-BLAST analysis, empirical testing against a panel of 10 healthy donor samples to rule out false positives, and post-amplification verification through both melt-curve profile inspection and gel electrophoresis. Furthermore, the assay's precision was quantitatively assessed through its reproducibility, determined by calculating the coefficient of variation (CV) from five replicates within a single run (intra-assay) and across three independent experimental runs (inter-assay). Finally, amplification efficiency was validated by generating standard curves for each target, all of which fell within the acceptable 90–110% range indicative of robust assay performance.
3.6. Statistical Analysis
All statistical analyses were performed using R software (version 4.3.1). The analytical framework was designed to account for the study's sample size and the comparative nature of the data. Continuous variables are summarized as mean ± standard deviation (SD) with 95% confidence intervals (CIs). Due to the limited sample size, which precluded formal normality testing, the agreement between singleplex and multiplex Cycle threshold (Ct) values was evaluated using non-parametric Wilcoxon signed-rank tests. The level of agreement was further quantified using Bland-Altman analysis, from which the mean difference and limits of agreement (± 1.96 SD) were derived.
The analytical rigor was strengthened through several complementary measures. Effect sizes were calculated as Cohen's d, and post-hoc power analyses were conducted based on a two-sided non-central t-distribution (α = 0.05). Diagnostic sensitivity and specificity, along with their corresponding 95% confidence intervals, were estimated using the Clopper-Pearson exact method. Assay precision was expressed via the coefficient of variation (CV), calculated as (SD/mean) × 100%. The overall analytical approach was benchmarked against established methodologies in the field, such as the work of Dolz et al. (21). A Schematic overview of the method is illustrated in Figure 1.
4. Results
4.1. Development and Optimization of a Multiplex Real-time PCR Assay
During assay development, non-specific amplification was observed in negative controls, characterized by late-cycle amplification (Ct > 35) and confirmed as primer-dimer artifacts through low melting temperatures (61 - 74°C) and the presence of non-specific bands on agarose gels. To maximize specificity without compromising sensitivity, the cycle number was optimized and set at 35 to preclude the detection of these late-forming artifacts (figure 1 in Supplementary File).
Systematic optimization of primer concentrations was undertaken to minimize dimerization potential while maintaining robust amplification efficiency. This process yielded the following final concentrations for each target: ETV6 (160 nM), RUNX1 (160 nM), TCF3 (200 nM), PBX1 (200 nM), KMT2A Exon 9 (200 nM), AFF1 (200 nM), BCR p190 (160 nM), BCR p210 (160 nM), and ABL1 (120 nM).
Thermal cycling parameters were rigorously evaluated. A three-step cycling protocol incorporating a brief extension step was found to produce superior melt curve profiles compared to a two-step protocol. Furthermore, an annealing temperature of 62°C consistently produced the lowest Ct values for specific targets while effectively suppressing nonspecific amplification and primer-dimer formation observed at lower temperatures. At higher temperatures (>63°C), a reduction in amplification efficiency was noted for some targets. The extension step itself was optimized by testing durations from 10 to 30 seconds at 72°C. Given that all amplicons were designed to be short (74 - 149 bp), which is well within the extension capacity of modern polymerases, a 10-second extension was deemed sufficient and most efficient, as longer durations provided no measurable improvement in amplification.
The final optimized multiplex reaction was performed in a 25 µL volume containing 12.5 µL of 2× SYBR Green master mix, 5 µL of cDNA template, nuclease-free water, and the following primer concentrations: ETV6 (0.4 µL), RUNX1 (0.4 µL), TCF3 (0.5 µL), PBX1 (0.5 µL), KMT2A Exon 9 (0.5 µL), AFF1 (0.5 µL), BCR p190 (0.4 µL), BCR p210 (0.4 µL), and ABL1 (0.3 µL). The selected thermal cycling protocol consisted of an initial polymerase activation at 95 °C for 15 minutes, followed by 35 cycles of denaturation at 95 °C for 15 seconds, annealing at 62 °C for 10 seconds, and extension at 72 °C for 10 seconds, concluding with a melting curve analysis.
The developed multiplex SYBR Green real-time PCR assay showed exceptional diagnostic performance, satisfying all pre-defined specificity criteria. The assay successfully co-amplified all five target fusion transcripts — ETV6-RUNX1, TCF3-PBX1, KMT2A-AFF1, and both BCR-ABL1 isoforms (p190 and p210) — with high fidelity. Crucially, the distinct, non-overlapping melting temperatures of each amplicon (differing by ≥ 1°C) enabled clear discrimination in the multiplex format, with melt curve profiles identical to those generated in singleplex reactions (Figure 2).
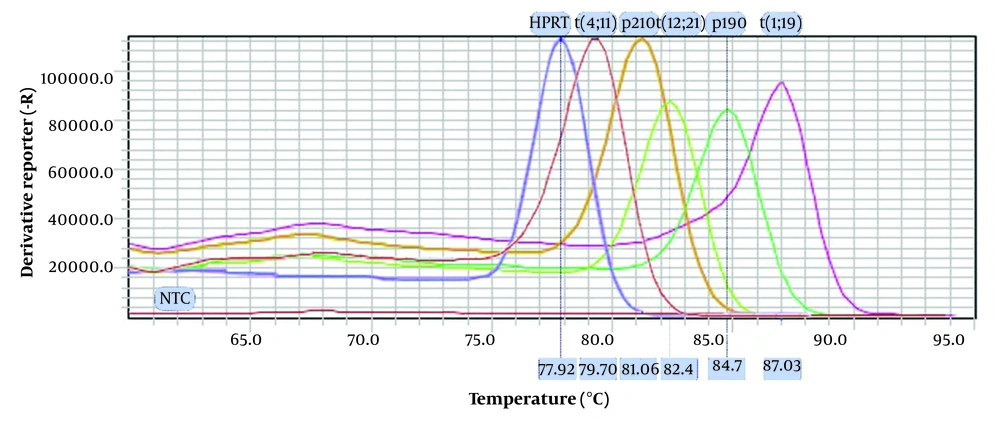
Figure 2.
Melt curve plots showing characteristic melting peaks for multiple genetic targets. Each colored curve represents the derivative reporter signal (–dR) across increasing temperature, corresponding to a specific fusion gene or control. Distinct melting temperatures (Tm) are labeled for HPRT, t(4;11): KMT2A–AF4; p210: BCR–ABL1 p210; t(12;21): ETV6–RUNX1; p190: BCR–ABL1 p190, and t(1;19): TCF3–PBX1, demonstrating clear separation of amplicon profiles. The NTC (no-template control) displays no amplification or melt peak, confirming assay specificity. Temperature (°C) is plotted on the x-axis and derivative fluorescence on the y-axis.
4.2. Evaluation of Amplification Efficiency in Multiplex Real-time PCR
Five-point calibration curves were generated for all fusion-gene assays using a 1:10 serial dilution of a high-quality positive sample, covering a dynamic range. All targets — BCR-ABL1 p190, BCR-ABL1 p210, TCF3-PBX1, KMT2A-AF4, and ETV6-RUNX1 — demonstrated highly linear performance across the dilution series, with R² values ranging from 0.996 to 0.999, indicating excellent proportionality between measured Ct values and dilution factor (Table 1). Amplification efficiencies remained within the acceptable range for qPCR assays (94.27 - 110.9%), reflecting consistent amplification kinetics across targets. The observed slopes (-3.467 to -3.084) and y-intercepts (40.02 - 42.54) were characteristic of efficient reverse transcription and PCR amplification using clinical material rather than purified standards.
Table 1.
Amplification Efficiency and Linear Regression Parameters for Multiplex qPCR Targets
| Translocation | R² | Slope | Y-Intercept | Efficiency (%) |
|---|---|---|---|---|
| ETV6-RUNX1 | 0.998 | -3.084 | 40.02 | 110.99 |
| TCF3-PBX1 | 0.999 | -3.323 | 42.47 | 99.94 |
| KMT2A-AF4 | 0.999 | -3.257 | 41.56 | 102.78 |
| BCRp190-ABL1 | 0.996 | -3.467 | 41.97 | 94.27 |
| BCRp210-ABL1 | 0.999 | -3.458 | 42.53 | 94.61 |
Abbreviations: R², coefficient of determination; Y-intercept, y-axis intercept of the linear regression from the dilution curve.
4.3. Comparison of Reproducibility Between Singleplex and Multiplex Real-time PCR
The reproducibility of the assay was assessed by calculating intra- and inter-assay coefficients of variation (CVs) for both cycle threshold (Ct) and melting temperature (Tm) values (Table 2). The assay showed high precision, with intra-assay CVs for Ct and Tm ranging from 0.15% to 0.68% and 0.05% to 0.25%, respectively. Inter-assay reproducibility was also robust, with CVs of 0.34 - 1.86% for Ct and 0.01 - 0.21% for Tm. For instance, the KMT2A-AF4 translocation exhibited minimal variability, with intra-assay Ct and Tm values of 25.2 ± 0.05 and 79.33 ± 0.09, and inter-assay values of 25.29 ± 0.22 and 79.32 ± 0.42.
Table 2.
Reproducibility of Cycle of Threshold and Melting Temperature Values Across Genes
| Variables | Ct | Tm | ||||||
|---|---|---|---|---|---|---|---|---|
| Intera-assay | Inter-assay | Intera-assay | Inter-assay | |||||
| Mean (95% CI) | CV a | Mean (95% CI) | CV a | Mean (95% CI) | CV a | Mean (95% CI) | CV a | |
| ETV6-RUNX1 | 24.10 (23.90 - 24.30) | 0.68 | 24.45 (23.67 - 25.24) | 1.29 | 82.51 (82.25 - 82.77) | 0.25 | 82.54 (82.29 - 82.79) | 0.12 |
| TCF3-PBX1 | 26.44 (26.34 - 26.55) | 0.32 | 26.34 (25.12 - 27.56) | 1.86 | 87.20 (87.13 - 87.28) | 0.06 | 87.18 (87.06 - 87.31) | 0.05 |
| KMT2A-AF4 | 25.2 (25.14 - 25.25) | 0.18 | 25.29 (25.07 - 25.50) | 0.34 | 79.33 (79.24 - 79.41) | 0.08 | 79.32 (78.90 - 79.74) | 0.21 |
| BCRp190-ABL1 | 23.70 (23.65 - 23.75) | 0.15 | 23.45 (22.88 - 24.03) | 0.98 | 84.76 (84.70 - 84.82) | 0.05 | 84.77 (84.73 - 84.80) | 0.01 |
| BCRp210-ABL1 | 22.58 (22.50 - 22.65) | 0.26 | 22.83 (22.25 - 23.42) | 1.03 | 81.21 (81.14 - 81.28) | 0.07 | 81.18 (81.13 - 81.24) | 0.02 |
Abbreviations: Ct, cycle of threshold; Tm, melting temperature; CI, confidence interval; CV, coefficient of variation.
a Values are express as %.
4.4. Assay Validation
The assay achieved 100% (95% CI: 83.16% - 100.0%), diagnostic sensitivity correctly identifying all 20 translocation-positive cases within the 30-patient cohort, which included 7 ETV6-RUNX1, 3 TCF3-PBX1, 3 KMT2A-AFF1, 3 BCR-ABL1 p190, and 4 BCR-ABL1 p210 positives. Specificity was also 100% (95% CI: 83.16% - 100.0%), with no false positives detected in either negative controls or the 10 translocation-negative patients (Table 3).
Table 3.
The Results of Singleplex and Multiplex Real-time PCR Modalities in ALL Patients and Healthy Donors
| Variables | Gender | Singleplex | Multiplex | CT | Tm | ||||||||
|---|---|---|---|---|---|---|---|---|---|---|---|---|---|
| Ct a | Tm a | Ct a | Tm a | Mean | ΔCt | SD | CV (%) | Mean | ΔTm | SD | CV (%) | ||
| Primary result | |||||||||||||
| ETV6-RUNX1 | Male | 26.84 | 84.21 | 27.17 | 84.31 | 27.005 | 0.33 | 0.165 | 0.61 | 84.26 | 0.1 | 0.05 | 0.05 |
| ETV6-RUNX1 | Male | 26.12 | 83.23 | 26.43 | 83.03 | 26.275 | 0.31 | 0.155 | 0.58 | 83.13 | 0.2 | 0.1 | 0.12 |
| ETV6-RUNX1 | Male | 28.72 | 84.34 | 29.12 | 84.21 | 28.92 | 0.4 | 0.2 | 0.69 | 84.275 | 0.13 | 0.065 | 0.07 |
| ETV6-RUNX1 | Male | 27.26 | 81.12 | 27.41 | 81.05 | 27.335 | 0.15 | 0.075 | 0.27 | 81.085 | 0.07 | 0.035 | 0.04 |
| ETV6-RUNX1 | Female | 24.27 | 83.06 | 24.62 | 83.14 | 24.445 | 0.35 | 0.175 | 0.71 | 83.1 | 0.08 | 0.04 | 0.04 |
| ETV6-RUNX1 | Female | 22.19 | 83.15 | 22.13 | 83.46 | 22.16 | 0.06 | 0.03 | 0.13 | 83.305 | 0.31 | 0.155 | 0.18 |
| ETV6-RUNX1 | Female | 27.61 | 82.97 | 27.99 | 82.41 | 27.8 | 0.38 | 0.19 | 0.68 | 82.69 | 0.56 | 0.28 | 0.33 |
| TCF3-PBX1 | Male | 21.73 | 86.6 | 21.23 | 86.81 | 21.48 | -0.5 | 0.25 | 1.16 | 86.705 | 0.21 | 0.105 | 0.12 |
| TCF3-PBX1 | Male | 25.17 | 87.14 | 25.67 | 87.08 | 25.42 | 0.5 | 0.25 | 0.98 | 87.11 | 0.06 | 0.03 | 0.03 |
| TCF3-PBX1 | Male | 27.45 | 87.34 | 27.89 | 87.21 | 27.67 | 0.44 | 0.22 | 0.79 | 87.275 | 0.13 | 0.065 | 0.07 |
| KMT2A-AFF1 | Male | 24.97 | 78.78 | 25.56 | 78.98 | 25.265 | 0.59 | 0.295 | 1.16 | 78.88 | 0.2 | 0.1 | 0.12 |
| KMT2A-AFF1 | Male | 25.67 | 79.33 | 25.75 | 79.53 | 25.71 | 0.08 | 0.04 | 0.15 | 79.43 | 0.2 | 0.1 | 0.12 |
| KMT2A-AFF1 | Female | 24.94 | 78.89 | 24.56 | 79.04 | 24.75 | 0.38 | 0.19 | 0.76 | 78.965 | 0.15 | 0.075 | 0.09 |
| BCR-ABL1 p190 | Male | 28.23 | 84.91 | 28.91 | 84.67 | 28.57 | 0.68 | 0.34 | 1.19 | 84.79 | 0.24 | 0.12 | 0.14 |
| BCR-ABL1 p190 | Male | 29.97 | 84.66 | 30.21 | 84.45 | 30.09 | 0.24 | 0.12 | 0.39 | 84.555 | 0.21 | 0.105 | 0.12 |
| BCR-ABL1 p190 | Female | 23.03 | 84.85 | 23.43 | 84.56 | 23.23 | 0.4 | 0.2 | 0.86 | 84.705 | 0.29 | 0.145 | 0.17 |
| BCR-ABL1 p210 | Male | 27.19 | 82.29 | 27.89 | 82.34 | 27.54 | 0.7 | 0.35 | 1.27 | 82.315 | 0.05 | 0.025 | 0.03 |
| BCR-ABL1 p210 | Male | 26.23 | 81.16 | 25.87 | 81.29 | 26.05 | 0.36 | 0.18 | 0.69 | 81.225 | 0.13 | 0.065 | 0.08 |
| BCR-ABL1 p210 | Male | 25.41 | 82.54 | 24.89 | 81.51 | 25.15 | 0.52 | 0.26 | 1.03 | 82.025 | 1.03 | 0.515 | 0.62 |
| BCR-ABL1 p210 | Female | 28.33 | 81.34 | 28.93 | 81.39 | 28.63 | 0.6 | 0.3 | 1.04 | 81.365 | 0.05 | 0.025 | 0.03 |
| Translocation negative- ALL | Male | Neg | NA | Neg | NA | ||||||||
| Translocation negative- ALL | Male | Neg | NA | Neg | NA | ||||||||
| Translocation negative- ALL | Male | Neg | NA | Neg | NA | ||||||||
| Translocation negative-ALL | Male | Neg | NA | Neg | NA | ||||||||
| Translocation negative- ALL | Male | Neg | NA | Neg | NA | ||||||||
| Translocation negative- ALL | Male | Neg | NA | Neg | NA | ||||||||
| Translocation negative- ALL | Male | Neg | NA | Neg | NA | ||||||||
| Translocation negative- ALL | Female | Neg | NA | Neg | NA | ||||||||
| Translocation negative-ALL | Female | Neg | NA | Neg | NA | ||||||||
| Translocation negative-ALL | Female | Neg | NA | Neg | NA | ||||||||
| Normal healthy | Male | Neg | NA | Neg | NA | ||||||||
| Normal healthy | Male | Neg | NA | Neg | NA | ||||||||
| Normal healthy | Male | Neg | NA | Neg | NA | ||||||||
| Normal healthy | Male | Neg | NA | Neg | NA | ||||||||
| Normal healthy | Male | Neg | NA | Neg | NA | ||||||||
| Normal healthy | Male | Neg | NA | Neg | NA | ||||||||
| Normal healthy | Female | Neg | NA | Neg | NA | ||||||||
| Normal healthy | Female | Neg | NA | Neg | NA | ||||||||
| Normal healthy | Female | Neg | NA | Neg | NA | ||||||||
| Normal healthy | Female | Neg | NA | Neg | NA | ||||||||
Abbreviations: Ct, cycle of threshold; Tm, melting temperature; CI, confidence interval; SD, standard deviation; CV, coefficient of variation; NA, not applicable.
a Values are express as mean.
4.5. Comparison Between Multiplex Real-time PCR and Singleplex Real-time PCR
In 30 ALL patients, 7 ETV6-RUNX1, 3 cases of TCF3-PBX1, 3 case of KMT2A-AFF1, 3 cases of BCR-ABL1 p190, and 4 case of BCR-ABL1 p210 were detected. When assessed individually by translocation, a statistically significant difference between singleplex and multiplex assays was observed only for the ETV6-RUNX1 fusion, both in Ct (P=0.001) and Tm (P=0.001) values that should be re-evaluated in a larger cohort. For all other translocations (TCF3-PBX1, KMT2A-AFF1, BCR-ABL1 p190, and BCR-ABL1 p210), the differences in both Ct and Tm values were not statistically significant (all P > 0.05), indicating strong method concordance for these targets (Table 4).
Table 4.
Statistical Comparison Between Singleplex and Multiplex Assays
| Variables | n | Singlepex | Multiplex | Ct a | Tm a | |||||||||
|---|---|---|---|---|---|---|---|---|---|---|---|---|---|---|
| Ct a | Tm a | Ct a | Tm a | Mean | d | SD | CV (%) | P-Value Paired t-Test | Mean | d | SD | CV (%) | ||
| Translocation | ||||||||||||||
| ETV6-RUNX1 | 7 | 26.14 | 83.15 | 26.41 | 83.08 | 26.27 | 0.26 | 0.13 | 0.50 | 0.001 | 83.12 | -0.06 | 0.03 | 0.04 |
| TCF3-PBX1 | 3 | 24.78 | 87.02 | 24.93 | 87.03 | 24.85 | 0.14 | 0.07 | 0.29 | 0.161 | 87.03 | 0.006 | 0.003 | 0.003 |
| KMT2A-AFF1 | 3 | 25.19 | 79 | 25.29 | 79.18 | 25.24 | 0.09 | 0.04 | 0.19 | 0.175 | 79.09 | 0.18 | 0.09 | 0.11 |
| BCR-ABL1 p190 | 3 | 27.07 | 84.80 | 27.51 | 84.56 | 27.29 | 0.44 | 0.22 | 0.80 | 0.102 | 84.68 | -0.24 | 0.12 | 0.14 |
| BCR-ABL1 p210 | 4 | 26.79 | 81.83 | 26.89 | 81.63 | 26.84 | 0.10 | 0.05 | 0.19 | 0.077 | 81.73 | -0.2 | 0.1 | 0.12 |
Abbreviations: Ct, quantification cycle; Tm, melting temperature; n, number of samples; SD, standard deviation; CV, coefficient of variation.
a Values are express as mean.
4.6. Evaluation of the Concordance Between Singleplex and Multiplex Real-time PCR via Bland–Altman Analysis
The comparison between singleplex and multiplex assays revealed a high degree of concordance for both Ct and Tm values. Bland–Altman analysis for Ct showed a mean difference of 0.21 ± 0.14, with limits of agreement ranging from -0.07 to 0.49, indicating that multiplex results were slightly higher but remained within acceptable analytical variation. Similarly, for Tm, the mean difference was –0.06 ± 0.17, with limits of agreement between -0.40 and 0.27, suggesting minimal temperature variation between the two assay formats. The Wilcoxon signed-rank test revealed no statistically significant difference between singleplex and multiplex assays for either Ct (P = 0.063) or Tm (P = 0.438). Overall, these findings confirm that the multiplex assay provides results highly consistent with the singleplex format, supporting its reliability and analytical interchangeability for detecting target translocations (Figure 3).
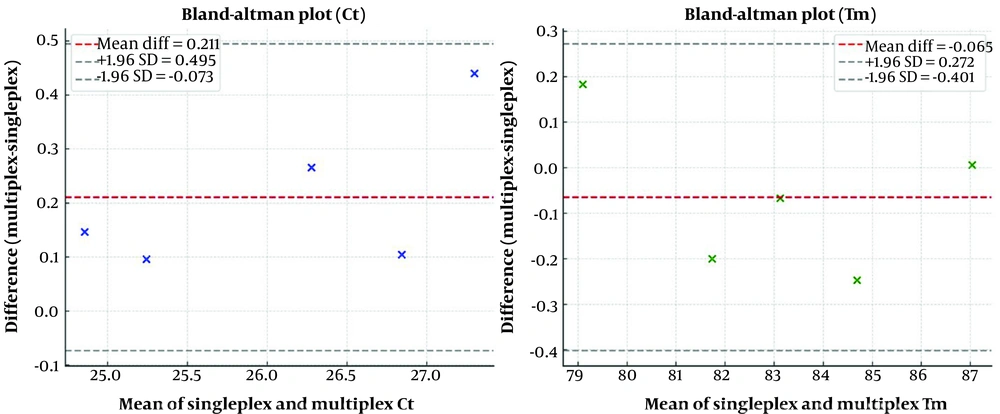
Figure 3.
In the Ct plot (left panel), the x-axis shows the mean Ct values from both methods, and the y-axis represents their differences. Most points lie close to the mean difference line and within the 95% limits of agreement, indicating strong concordance. The small positive bias (~0.21 cycles) shows that multiplex assays yield slightly higher Ct values than singleplex, but this difference is minimal and not significant (P = 0.063). In the Tm plot (right panel), the mean difference (-0.06°C) indicates nearly identical melting temperatures between assays, with all data points within the limits of agreement and no systematic bias (P = 0.438).
5. Discussion
Conventional ALL diagnostics rely on a multi-step combination of cytogenetic and molecular techniques, which, although accurate, are often resource-intensive and time-consuming. Multiplex molecular approaches offer an opportunity to streamline the detection of clinically relevant fusion transcripts (22). The strategic shift towards multiplexing in molecular diagnostics is driven by the imperative for comprehensive genetic profiling that conserves precious biomaterial, reduces reagent costs, and simplifies laboratory workflow (23). Schouten et al. highlighted that multiplex PCR can reduce costs and hands-on time by up to 80% compared to multiple singleplex reactions, a crucial advantage for resource-conscious laboratories (24). Although TaqMan probe-based multiplex assays are often considered the benchmark for specificity, their development is encumbered by high costs and the technical complexity of fluorophore and quencher system optimization. In this landscape, SYBR Green-based assays emerge as a compelling and cost-efficient alternative (25). It is important to acknowledge that the transition to multiplex formats requires meticulous validation, as the consolidation of multiple reactions can present analytical challenges (26). The broader literature indicates that while multiplexing offers significant operational advantages, it can, in some instances, lead to modest reductions in sensitivity or quantitative discrepancies (27, 28). However, numerous studies have also demonstrated that with careful development, multiplex assays can achieve excellent concordance. In a finding that resonates with our own, Dolz et al. demonstrated that a meticulously optimized multiplex assay for leukemia fusions could achieve 100% concordance with singleplex methods (21). Our optimized SYBR Green-based multiplex assay directly addresses these points, consolidating the detection of five key genetic markers into a single, rapid reaction. This integration has the potential to significantly shorten the diagnostic turnaround time, expediting critical therapeutic decisions. For example, the prompt identification of a BCR-ABL1 fusion can immediately triage a patient for tyrosine kinase inhibitor therapy, while detection of KMT2A-AFF1 flags a high-risk subgroup (29).
We successfully developed and validated a SYBR Green-based multiplex real-time PCR assay for the simultaneous detection of four major prognostically significant fusion transcripts in ALL. By employing a rigorous in silico design phase and empirical optimization of primer concentrations and thermal cycling conditions, we achieved a clear resolution of all five targets. This approach is supported by the work of Untergasser et al., whose Primer3 software has become a cornerstone for avoiding primer-dimer artifacts, a challenge we successfully overcame (30). The distinct, non-overlapping melting temperatures for each fusion transcript enabled clear discrimination in the multiplex format. The reproducibility of our assay, as evidenced by low intra- and inter-assay coefficients of variation for both Ct and Tm values, is critical for its potential clinical application. The CV for Ct values was consistently below 2%, which meets the stringent performance criteria recommended for quantitative real-time PCR assays. This level of precision aligns with the findings of Bustin et al. in their MIQE guidelines, which emphasize low CVs as a hallmark of a robust qPCR assay (31). The 100% diagnostic sensitivity and specificity observed in our cohort are particularly promising. Our assay revealed perfect concordance with the reference singleplex method. The Bland-Altman analysis revealed minimal bias for both Ct and Tm values, with all data points lying within the 95% limits of agreement. Furthermore, the Wilcoxon signed-rank test confirmed no statistically significant systematic differences between the two methods overall. It is noteworthy, however, that a significant difference was observed specifically for the ETV6-RUNX1 translocation. This could be attributed to slight competition for polymerase or nucleotides in the multiplex milieu. A similar phenomenon was documented by Wittwer et al., who observed that amplicon length and secondary structure can differentially influence amplification efficiency in a multiplex setting, potentially explaining target-specific variations like the one we observed for ETV6-RUNX1 (32).
Despite its robust performance, our study has certain limitations. The sample size, while sufficient for an initial validation, is modest. As noted by Bujang and Adnan in the context of diagnostic test validation, larger sample sizes are required to precisely estimate sensitivity and specificity, particularly for less common subtypes (20). Second, a formal assessment of the limit of detection (LoD) for each target in the multiplex format was not the primary focus. In a cautionary note that future work should address, Kralik and Ricchi emphasized that the LoD of a multiplex assay may not be equivalent to its singleplex components due to the increased complexity of the reaction mix (33). Although our multiplex assay performed excellently, real-world clinical samples with degraded RNA or PCR inhibitors may present additional challenges. Therefore, future research should evaluate the assay's performance across a wider spectrum of sample qualities. Furthermore, the current assay is designed as a qualitative screen. Future iterations could be developed to include a quantitative component for Minimal residual disease (MRD) monitoring, an application where the work of Gabert et al. with the Europe Against Cancer program has set a clear standard (18). As another limitation of our study, although the designation of primers ensures robust detection of the dominant fusion forms encountered in routine diagnostics, very rare or atypical transcript variants with breakpoints outside the targeted regions may escape detection. Importantly, such rare variants represent a small minority of ALL cases, and samples with discordant clinical or cytogenetic findings would warrant supplementary testing using broader molecular approaches.
In conclusion, we have developed a SYBR Green-based multiplex real-time PCR assay that is accurate, reproducible, and cost-effective for the simultaneous detection of major ALL-associated translocations. Its performance is on par with the standard singleplex method, while offering significant advantages in terms of efficiency and resource utilization. This assay represents a significant step towards democratizing access to sophisticated molecular diagnostics for ALL. Future studies focusing on larger, prospective validations and the development of a quantitative format are warranted to fully establish its role in routine clinical practice.