1. Context
Lung cancer has been the most common type of cancer worldwide in recent decades (1). In 2012, 1.8 million new cases of lung cancer were estimated (12.9% of total), 58% of whom were in less developed countries. The incidence of lung cancer is mostly observed in central and eastern Europe (53.5 in 100 000), eastern Asia (50.4 in 100 000), and considerably less in the central and western Africa (2.0 and 1.7 in 100 000). The prevalence of this disease is usually lower in women, reflecting differences in smoking between men and women. Therefore, the highest estimated rates (per 100,000) was observed in northern America (33.8) and northern Europe (23.7), relatively high rate in eastern Asia (19.2), and the lowest rate in the central and western Africa (1.1, 0.8). Moreover, lung cancer is the most common cause of death from cancer in the world. Mortality rates (per 100,000) from lung cancer in 2012 was 47.6 and 44.8 in central and eastern Europe and eastern Asia in men, respectively, and it was 23.5 and 19.1 in northern America and northern Europe in women, respectively. The lowest ratio was in men and women (2.4) and women (2.2) in sub-Saharan Africa (2, 3).
Selenium is a fundamental trace element for a few important metabolic pathways, including anti-oxidant defense system and the immune system (4). Selenium is an essential structural component of the anti-oxidant enzyme of glutathione peroxidase that takes part in a system to convert aggressive oxidation products and intracellular free radicals into less reactive or neutral components (5, 6). Other vital effects of selenium can be observed in reproduction, toxicity, anti-oxidants, and anti-aging and plays a very important role in degenerative conditions such as inflammatory, cardiovascular, and neurodegenerative diseases (7).
A growing number of epidemiological studies have focused on the relationship between diet and lung cancer, suggesting the association between serum level of selenium and some types of cancer. However, the results are contradictory; since some studies reported that increased serum level of selenium could reduce the risk of lung cancer, the results were negative in some studies and rejected such an association (8-11).
One of the most important goals of meta-analysis, which results from the combination of studies, reduces the difference between the parameters, and reduces the confidence interval (CI) due to the increasing number of studies involved and samples size in the analysis, and finally, results are solving a problem, especially in the field of medicine (12, 13).
Therefore, we have carried out the present systematic review and meta-analysis to determine the relationship between selenium and lung cancer and to evaluate the risks and benefits associated with selenium intake in the treatment and prevention of lung cancer.
2. Methods
2.1. Study Protocol
The present study was conducted based on the preferred reporting items for systematic reviews and meta-analyses (PRISMA) (14). Therefore, two researchers performed the searches, selection of studies, quality assessment, and data extraction independently to avoid error and bias, and the third researcher examined the agreement among the search results.
2.2. Search Strategy
Databases including PubMed, Science Direct, Cochrane, Embase, Web of Science (ISI), CINAHL, Scopus as well as Google Scholar were used to collect the data required among the articles in English, and the time range of the study was determined without any time limit until May 2017. MeSH keywords including " Lung Cancer", "Lung Neoplasm", "Chemoprevention", "Anti-oxidant", "Minerals", "Selenium" "Toenail selenium", and "Serum/Plasma Selenium" with all possible combinations, using Boolean operators (AND&OR) were evaluated in order to maximize the comprehensiveness of search strategy. References of all relevant articles were manually reviewed.
2.3. Inclusion and Exclusion Criteria
The inclusion criteria were: 1. The subject of selenium and cancer; 2. Observational epidemiological studies; 3. Articles published in English. The exclusion criteria were as follow: 1. Lung cancer not event as outcome; 2. Selenium supplementation for cancer prevention; 3. Cytological studies, animal studies, review articles, and comments; 4. Low quality studies.
2.4. Qualitative Evaluation
After reviewing the full text of the articles and applying inclusion and exclusion criteria for the study, the remaining articles were assessed for the Newcastle-Ottawa Scale (NOS) for assessing the quality of nonrandomised studies (15). This scale ranges from 0 to 9 point. Finally, the two researchers compared the points given to the articles. The minimum acceptable score was considered 6 (6-7 was moderate quality and 8-9 was high quality). The articles that received threshold score of qualitative evaluation were enrolled in the meta-analysis process.
2.5. Data Extraction
A pre-prepared checklist extracted all final articles entered into the study process. The checklist included the author's name, year of study, place of study, study design, sample size, number of cases, number of controls, age, gender, duration of follow-up, odd ratio (OR) for the highest versus the lowest selenium exposure, serum selenium concentration in case/control, and toenail selenium concentration in case/control.
2.6. Statistical Analysis
Cochran's Q test and I2 index evaluated the heterogeneity of the studies. Three categories for heterogeneity were considered (I2 index less than 25%: low heterogeneity, between 25% and 75%: moderate heterogeneity, and over 75%: high heterogeneity) (16, 17). To compare the mean selenium concentration in the lung cancer group with the control group, OR for the highest versus the lowest selenium exposure and the standardized mean difference (SMD) between serum selenium in lung cancer and healthy groups were used. Due to the high heterogeneity of studies, the random effects model was used in combination with the results of the studies. Sensitivity analysis was used to determine the stability of the data and subgroup analysis based on gender, type of studies, and samples were used to find the cause of high heterogeneity. Egger and Begg's test was estimated for publication bias (18). Data were analyzed, using the Comprehensive Meta-Analysis Software Version 2. The tests were considered significant at P < 0.05.
3. Results
3.1. Search Results and Study Characteristics
A total of 324 possible relevant studies were found in a systematic primary search, and after screening the studies title, 150 duplicate studies were omitted and 174 studies remained. After applying inclusion and exclusion criteria for the study, 15 high-quality studies were included in the meta-analysis, containing 13 case-control and 2 cohort studies, 12 on serum selenium and 3 on toenail selenium (Figure 1). The sample size was 84 199 subjects (2 434 cases and 81 765 controls). Table 1 shows the general specifications and data for each of the studies.
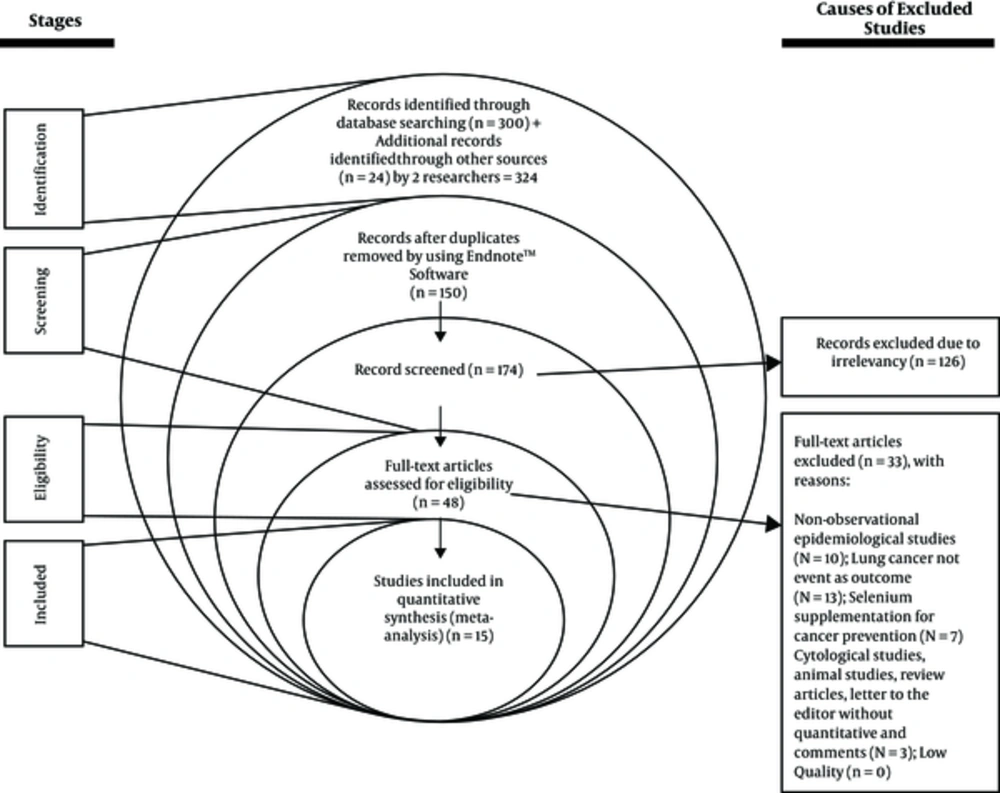
Figure 1.
PRISMA flow diagram for the studies
Table 1.
Details of the Studies Included in the Meta-Analysis
| First Author (Ref) | Year | Country | Design | Case | Control | Age | Gender | Follow-Up | Matrix | Selenium Concentrationa | OR (95%CI)b | |
|---|---|---|---|---|---|---|---|---|---|---|---|---|
| Case | Control | |||||||||||
| Jaworska K (8) | 2013 | Poland | Case-control | 86 | 86 | Mean 61.1 | M and F | N/A | Serum | 63.2 | 74.6 | 0.1 (0.03 - 0.034) |
| Jablonska E (9) | 2008 | Poland | Case-control | 325 | 287 | 30 - 78 | M and F | N/A | Serum | 49.4 ± 17.4 | 53.3 ± 14 | 1.21 (0.67 - 2.20) |
| Zhou L (10) | 2011 | China | Case-control | 60 | 60 | F | N/A | Serum | 55.22 ± 13.34 | 60.33 ± 13.82 | ||
| Gromadzinska J (11) | 2003 | Poland | Case-control | 152 | 210 | 43 - 78 | M and F | N/A | Serum | 48.4 ± 16.5 | 53.7 ± 14.3 | 0.33 (0.18 - 0.60) |
| Hartman TJ (19) | 2002 | Finland | Case-control | 250 | 250 | 50 - 69 | M | N/A | Toenail | 0.537 ± 0.129 | 0.55 ± 0.134 | 0.2 (0.09 - 0.44) |
| Ratnasinghe (20) | 2000 | China | Case-Control | 108 | 216 | 35 - 74 | M | N/A | Serum | 46.5 ± 24.75 | 45.0 ± 22.75 | 1.2 (0.60 - 2.4) |
| van den Brandt (21) | 1993 | Netherlands | Cohort | 335 | 1211 | 55 - 69 | M | 3.3 y | Toenail | 0.529 ± 0.206 | 0.547 ± 0.126 | - |
| van den Brandt (21) | 1993 | Netherlands | Cohort | 35 | 1248 | 55 - 69 | F | 3.3 y | Toenail | 0.537 ± 0.08 | 0.575 ± 0.109 | - |
| van den Brandt (21) | 1993 | Netherlands | Cohort | 384 | 2961 | 55 - 69 | M and F | 3.3 y | Toenail | - | - | 0.4 (0.27 - 0.97) |
| Knekt P (22) | 1998 | Finland | Nested case-control | 91 | 177 | Mean 57 | M and F | 19 y | Serum | 53.2 ± 24.3 | 57.8 ± 16.9 | 0.41 (0.17 - 0.94) |
| Goodman GE (23) | 2001 | USA | case-control | 356 | 356 | 45 - 74 | M and F | N/A | Serum | 11.91 ± 1.96 | 11.77 ± 18.5 | 1.2 (0.77 - 1.88) |
| Garland M (24) | 1995 | USA | Nested case-control | 47 | 47 | 30 - 55 | F | 41 mon | Toenail | - | - | 1.95 (0.41 - 9.28) |
| Elassal G, 2014 (25) | 2006 | USA | Case-control | 902 | 829 | Mean 61 | M | N/A | Serum | 48.5 ± 9.2 | 72 ± 14 | - |
| Miyamoto H (26) | 1987 | Japan | Case-control | 37 | 56 | N/A | M and F | N/A | Serum | 99 ± 16 | 122 ± 14 | - |
| Kabuto M (27) | 1994 | Japan | Case-control | 77 | 120 | 30-70 | M and F | N/A | Serum | - | - | 0.56 (0.21 - 1.48) |
| Menkes MS (28) | 1986 | USA | Case-control | 99 | 196 | N/A | M and F | N/A | Serum | 113 ± 18 | 110 ± 16 | - |
| Knekt P (29) | 1990 | Finland | Cohort | 153 | 38172 | 15 – 99 | M | 5 y | Serum | - | - | 0.66 (0.37 - 1.19) |
| Knekt P (29) | 1990 | Finland | Cohort | 189 | 38172 | 15 – 99 | M | 5 y | Serum | 57 ± 16.7 | 61 ± 13.5 | - |
| Knekt P (29) | 1990 | Finland | Cohort | 9 | 38172 | 15 - 99 | F | 5 y | Serum | 62.8 ± 17.9 | 63.4 ± 13.8 | - |
Abbreviations: F, female; M, male; mon, month; N/A, not available; y, year.
aμg/L for Serum and μg/g for Toenail.
bOdd Ratio for highest versus lowest selenium exposure.
3.2. The Highest Versus the Lowest Selenium Exposure and Lung Cancer Risk
In 11 studies (2 029 cases and 42 882 controls), the OR of lung cancer in the highest quintile of selenium exposure compared to the lowest quintile was 0.55 (95% CI: 0.35 to 0.86, P < 0.01) with the high heterogeneity (P < 0.001; I2 % = 77.86), and the relationship was significant (Figure 2).
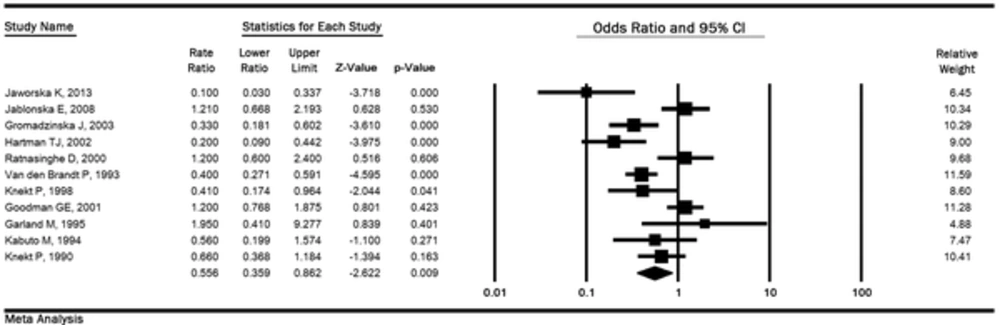
Figure 2.
Meta-analysis for the highest versus the lowest selenium exposure and lung cancer risk based on a random effects model
3.3. The Highest Versus the Lowest Selenium Exposure and Lung Cancer Risk Based on Gender, Type of Study, and Measurement Samples
The OR and their 95% CI for each subgroup of gender, type of study, and measurement samples is shown in Table 2. In subgroup analysis, it was determined that gender (P = 0.28), type of studies (P = 0.70), and measurement of selenium samples (P = 0.46) were not influencing factors (Table 2).
Table 2.
The Odds Ratio for the Highest Versus the Lowest Selenium Exposure and Lung Cancer Risk According to Gender, Type of Study, and Measurement Samples of Selenium and Standardized Mean Difference for Serum Selenium Exposure and Lung Cancer Risk According to Gender and Type of Study
| Variable | Study (N) | Case | Control | Heterogeneity | 95% CI | OR | P-Value | |
|---|---|---|---|---|---|---|---|---|
| I2 (%) | P-Value | |||||||
| Gender | ||||||||
| Male and female | 7 | 1471 | 4197 | 81.07 | < 0.001 | 0.28 - 0.88 | 0.5 | 0.016 |
| Male | 3 | 511 | 38638 | 82.31 | 0.004 | 0.21 - 1.41 | 0.55 | 0.21 |
| Female | 1 | 47 | 47 | 0 | - | 0.41 - 9.27 | 1.95 | 0.401 |
| Test for difference | Q-value: 2.49, df (Q): 2, P = 0.287 | |||||||
| Type of study | ||||||||
| Case-control | 9 | 1492 | 1749 | 79.94 | < 0.0001 | 0.32 - 0.99 | 0.56 | 0.049 |
| Cohort | 2 | 537 | 41133 | 48.72 | 0.163 | 0.30 - 0.79 | 0.48 | 0.004 |
| Test for difference | Q-value: 0.14, df (Q): 1, P = 0.704 | |||||||
| Measurement sample of selenium | ||||||||
| Serum | 8 | 1348 | 39424 | 75.53 | 0 | 0.37 - 1.00 | 0.61 | 0.052 |
| Toenail | 3 | 681 | 3258 | 70.6 | 0.033 | 0.17 - 1.00 | 0.42 | 0.052 |
| Test for difference | Q-value: 0.52, df (Q): 1, P = 0.467 | |||||||
| Variable | Study (N) | Case | Control | Heterogeneity | 95% CI | SMD | P-Value | |
| I 2 (%) | P-Value | |||||||
| Gender | ||||||||
| Male and female | 7 | 1080 | 1279 | 92.03 | < 0.001 | -0.77 to -0.128 | -0.44 | 0.006 |
| Male | 2 | 297 | 38388 | 85.16 | 0.009 | -0.48 to 0.22 | -0.12 | 0.479 |
| Female | 2 | 69 | 38232 | 0 | 0.382 | -0.61 to 0.018 | -0.29 | 0.064 |
| Test for difference | Q-value: 1.74, df (Q): 2, P = 0.419 | |||||||
| Type of study | ||||||||
| Case-control | 9 | 1248 | 1573 | 90.04 | < 0.001 | -0.62 to -0.10 | -0.36 | 0.006 |
| Cohort | 2 | 198 | 76344 | 0 | 0.459 | -0.42 to -0.14 | -0.28 | < 0.001 |
| Test for difference | Q-value: 0.29, df (Q): 1, P = 0.589 | |||||||
Abbreviations: CI, confidence interval; N, number; OR, odds ratio; SMD, standardized mean difference.
3.4. SMD for Selenium Exposure and Lung Cancer
The result of the SMD between serum selenium concentrations in lung cancer and healthy groups in 11 studies (1446 cases and 77917 controls) was - 0.32 μg/L (95% CI: -0.53 to -0.11, P = 0.003), with the high heterogeneity (P < 0.001; I2 % = 88.02). This value for toenails selenium in 3 studies (620 cases and 2 709 controls) was - 0.13 μg/g (95% CI: -0.22 to -0.03, P = 0.006) indicating a significant relationship (Figure 3).
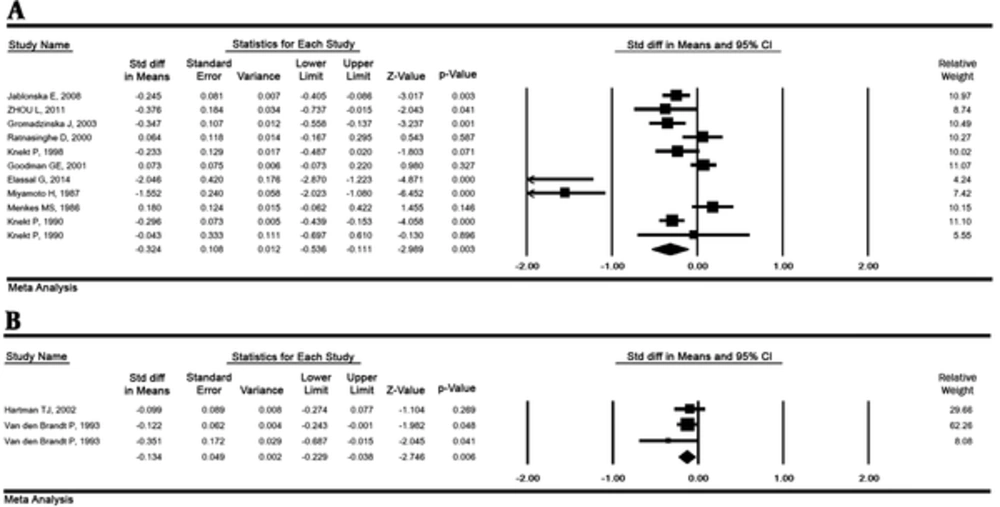
Figure 3.
Standardized mean differences for selenium exposure and lung cancer risk in serum (A) and toenail (B) samples. Random effects model
3.5. SMD for Selenium Exposure and Lung Cancer Based on Gender and Type of the Study
This value in males, females, and both was -0.12 (95% CI: - -0.48 to 0.22, P = 0.479), -0.29 (95% CI: -0.61 to 0.018, P = 0.064), and -0.44 (95% CI: -0.77 to -0.128, P = 0.002), respectively. This value was estimated to be -0.36 (95% CI: -0.62 to -0.10, P = 0.006) in case-control studies and -0.28 (95% CI: -0.42 to -0.14, P < 0.001) in cohort studies (Table 2).
3.6. Sensitivity Analysis
The OR and the SMD with their 95% CI were estimated by omitting 1 study simultaneously and the results demonstrated that the overall result is robust. The results of the sensitivity analysis are illustrated in Figure 4.
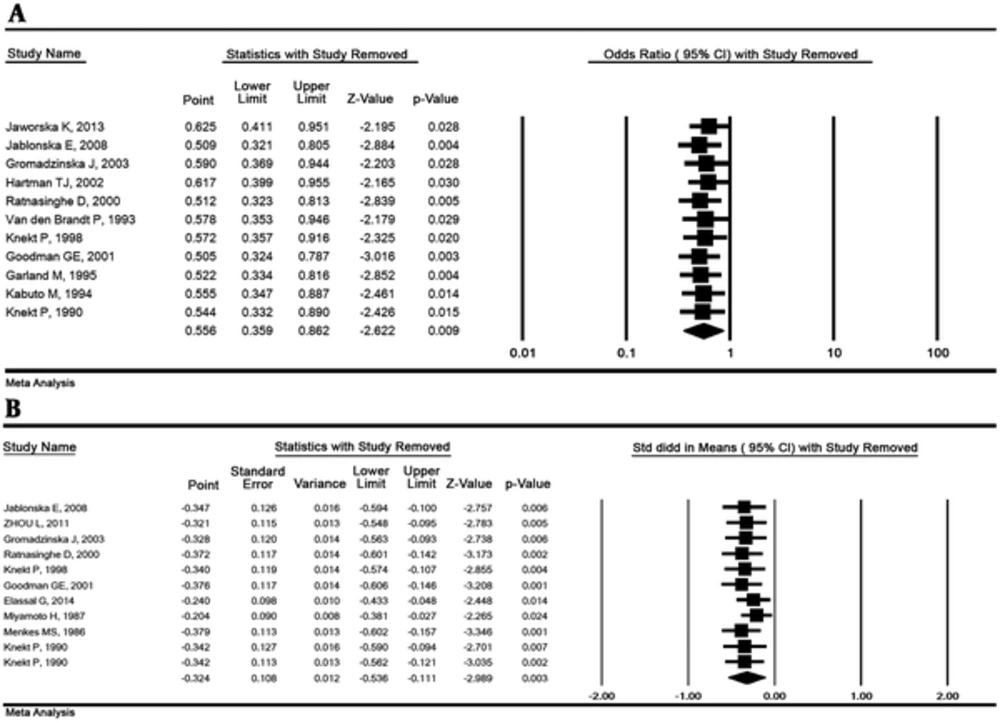
Figure 4.
Sensivity analysis for lung cancer risk and selenium. The highest versus the lowest selenium exposure (A) and standardized mean differences (B) (Random effects model)
3.7. Publication Bias
The significance level of publication bias tests was estimated for the OR of lung cancer in the highest quintile of selenium exposure compared to the lowest quintile (Egger = 0.63 and Begg's = 0.43) and for the SMD between serum selenium concentrations in lung cancer and healthy groups (Egger = 0.32 and Begg's = 0.53), indicating the publication bias not played a role in the results (Figure 5).
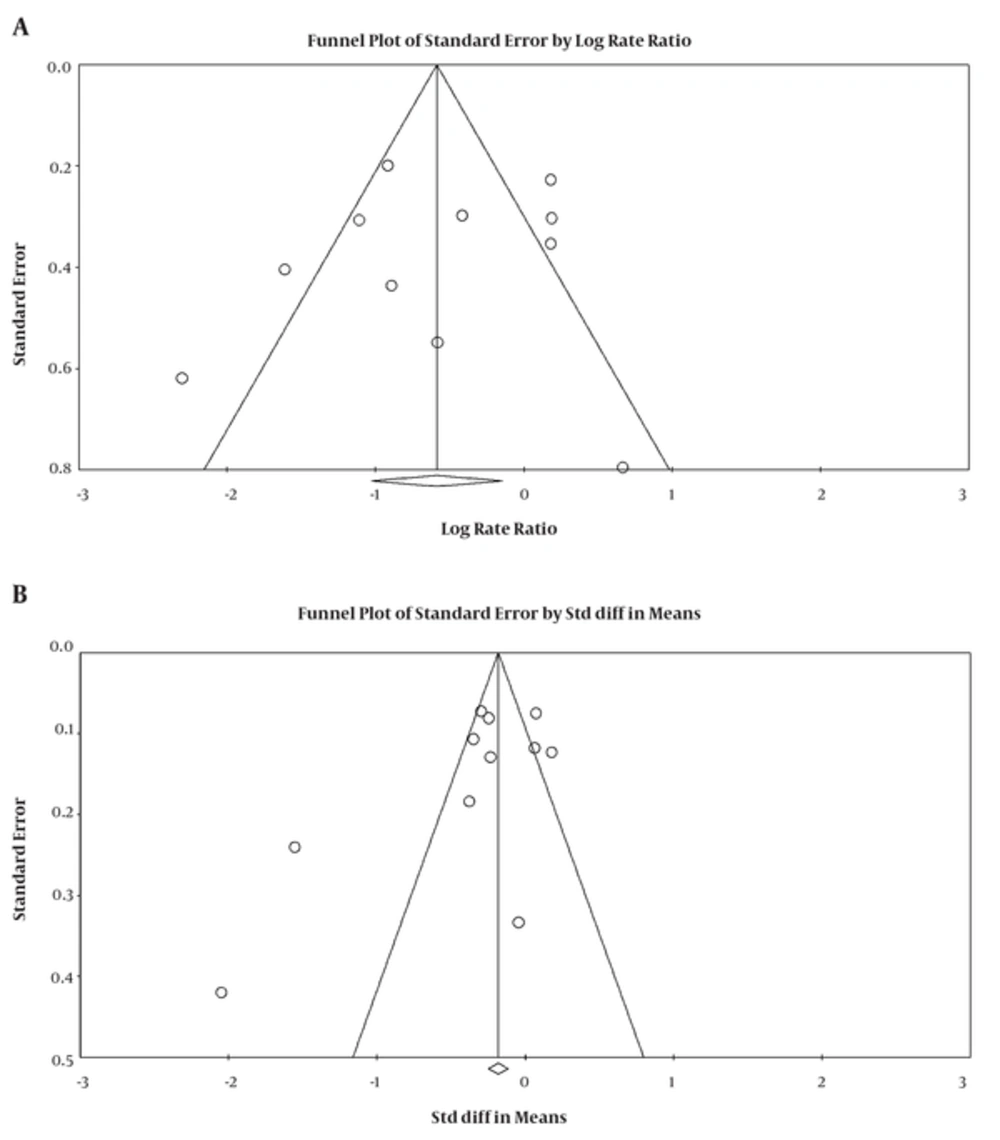
Figure 5.
Funnel plot for the odds ratio (A) and standardized mean difference (B) in relationship between selenium and lung cancer risk
4. Discussion
The results of meta-analysis indicate that the low levels of selenium are highly related with lung cancer; the high levels of selenium can be a proactive factor for lung cancer. The cellular prooxidative disorders and the anti-oxidant processes such as selenium effect are hypotheses proposed in the carcinogenesis related to the development of cancer. The results presented in various studies are diverse. For example, Jaworska et al. (8), Gromadzinska et al. (11), van den Brandt et al. (21), Knekt et al. (22), and Hartman et al. (19) showed that the high serum levels of selenium lead to reduction in the risk of lung cancer. Nevertheless, Knekt et al. (29), Kabuto et al. (27), Goodman et al. (23), Jablonska et al. (9), and Ratnasinghe et al. (20) have not reported such an outcome. In this meta-analysis, combining the results of 15 epidemiologic studies, which applied individual selenium levels measured in serum or toenails, indicated that there is a significant decrease in the risk of lung cancer associated with the low levels of selenium. Thus, the results of this meta-analysis indicate the protective role of elevated selenium in the incidence of lung cancer. High heterogeneity was observed in the study results (I2 = 77.86% for OR and I2 = 92.64% for SMD); subgroup analysis was considered with regard to gender, type of study, and measurement sample of selenium.
Meta-analysis study by Cai et al. in 2014 showed an inverse correlation between cancer and selenium levels, and the relative risk of the highest versus the lowest selenium exposure and cancer risk was 0.76 (95% CI: 0.70 - 0.83) and this value in the present meta-analysis for lung cancer was 0.55 (95% CI: 0.35 - 0.86, P < 0.01) (30). The difference of this study with them is that the two clinical trials, Lippman et al. (31) and Clark et al. (32), used selenium supplementation in comparison to the placebo group. Other difference can be found in this study; SMD between serum selenium concentrations in lung cancer and healthy groups was estimated.
In a systematic review and meta-analysis on the relationship between selenium levels and cancer incidence in general and lung cancer in particular, Vinceti et al. indicated that there was no association between selenium and risk of lung cancer (33). However, one important limitation of their study compared to this study was the limited number of studies and smaller sample size, which can affect the results of the analysis. A randomized placebo-controlled trial with an average duration of 5.46 years of follow-up showed that there is no significant relation between placebo and selenium supplementation in the prevention of lung cancer (33). Some people may have a certain genetic background for tumorigenesis; hence, it is very important to identify the beneficial effect of selenium before starting the selenium supplements (34), and Jablonska et al. (9) have strongly supported this hypothesis.
In vitro studies indicated the pro-oxidant activity of mineral selenium compounds that are able to induce apoptosis in cancer cells. On the other hand, some of these compounds in high concentrations can generate oxidative DNA damages in normal cells and some of them have the ability to disable DNA repair processes. Given these observations, it can be suggested that selenium, depending on the dose and metabolic activity, may also be carcinogenic (34). According to some of the clinical trials, reducing the risk of lung cancer depends on the dose; for example, Jaworska et al. suggest that selenium reduced to below 60 mg/L is associated with an increased risk of lung cancer (8).
In the present study, assessing the association between serum or toenails levels of selenium with lung cancer risk in terms of gender revealed that the relative risk of the highest versus the lowest selenium exposure was not significant in females, unlike males, which may be due to the insufficient number of studies involved in the meta-analysis process for the females. However, the mean difference in selenium concentrations was significant in both males and females. This relationship between the two genders was not significant in Vinceti's review in males or females. A significant correlation has been reported in a meta-analysis on both genders (33).
4.1. Limitations of the Study
1. Failure to investigate the relationship between serum selenium level and various types of lung cancer.
2. Heterogeneity in standard unit reported for measuring the concentration of selenium in different articles
3. Absence of a uniform procedure for measuring variance
4. Lack of information on nutrition and lifestyle of the participants.
5. Conclusions
The results of this meta-analysis support the preventive role of increased selenium levels in the incidence of lung cancer, and selenium can be used as a predictive variable. The results of this study can be used as a basis in randomized clinical trials on selenium supplements for the prevention of lung cancer.