


1. Background
2. Objectives
3. Methods
3.1. Research Design and Sample
3.2. Clinical and Laboratory Evaluation
3.3. Statistical Analysis
4. Results
4.1. Characteristics of the Study Group
| Variables and Groups | Mean ± SD (Median) | Minimum - Maximum | Mean Difference | St. Error Difference | 95% CI of the Difference | Cohen’s Effect Size | P-Value | |
|---|---|---|---|---|---|---|---|---|
| Lower | Upper | |||||||
| Age (y) | -0.055 | 0.386 | -0.822 | 0.711 | -0.026 | 0.923 | ||
| MetS- | 12.57 ± 1.88 (12.00) | 10.00 - 16.00 | ||||||
| MetS+ | 12.52 ± 1.91 (12.00) | 10.00 - 16.00 | ||||||
| BMI (kg/m2) | 1.825 | 0.854 | 0.131 | 3.522 | 0.42 | 0.128 | ||
| MetS- | 30.01 ± 3.53 (29.38) | 24.00 - 39.26 | ||||||
| MetS+ | 31.83 ± 4.96 (30.17) | 23.73 - 43.28 | ||||||
| WC (cm) | 0.234 | |||||||
| MetS- | 94.38 ± 9.43 (93.00) | 77.00 - 120.00 | ||||||
| MetS+ | 97.92 ± 12.47 (96.00) | 80.00 - 128.00 | ||||||
| SBP(mmHg) | 16.271 | 2.023 | 12.255 | 20.288 | 1.68 | < 0.001 | ||
| MetS- | 120.21 ± 10.77 (120.00) | 100.00 - 152.00 | ||||||
| MetS+ | 136.50 ± 8.69 (135.00) | 116.00 - 168.00 | ||||||
| DBP (mmHg) | 8.338 | 1.793 | 4.779 | 11.897 | 0.94 | < 0.001 | ||
| MetS- | 67.94 ± 8.17 (70.00) | 44.00 - 90.00 | ||||||
| MetS+ | 76.28 ± 9.62 (80.00) | 53.00 - 98.00 | ||||||
| Cholesterol (mg/dL) | 3.015 | 5.229 | -7.363 | 13.393 | 0.117 | 0.576 | ||
| MetS- | 163.41 ± 27.78 (164.80) | 112.90 - 241.00 | ||||||
| MetS+ | 166.43 ± 22.58 (165.70) | 120.00 - 221.00 | ||||||
| LDL-C (mg/dL) | 5.027 | 4.646 | -4.193 | 14.249 | 0.220 | 0.462 | ||
| MetS- | 92.64 ± 23.05 (95.36) | 38.12 - 152.00 | ||||||
| MetS+ | 97.67 ± 22.56 (95.50) | 52.24 - 181.50 | ||||||
| HDL-C (mg/dL) | -5.808 | 3.263 | -12.286 | 0.669 | -0.362 | 0.003 | ||
| MetS- | 52.35 ± 13.91 (50.20) | 31.20 - 117.16 | ||||||
| MetS+ | 46.54 ± 18.57 (41.00) | 24.10 - 114.78 | ||||||
| TG (mg/dL) | 36.538 | 10.175 | 16.343 | 56.733 | 0.73 | < 0.001 | ||
| MetS- | 106.00 ± 42.72 (95.40) | 37.90 - 226.40 | ||||||
| MetS+ | 142.54 ± 58.57 (140.00) | 39.40 - 318.00 | ||||||
| FPG (mg/dL) | 6.388 | 1.633 | 3.146 | 9.631 | 0.795 | < 0.001 | ||
| MetS- | 88.24 ± 5.97 (88.00) | 74.00 - 99.70 | ||||||
| MetS+ | 94.63 ± 10.19 (96.90) | 73.70 - 116.00 | ||||||
| Insulin (µIU/mL) | 7.827 | 3.237 | 1.400 | 14.253 | 0.492 | 0.002 | ||
| MetS- | 22.56 ± 15.52 (17.65) | 2.99 - 101.20 | ||||||
| MetS+ | 30.39 ± 16.44 (28.55) | 11.11 - 74.10 | ||||||
| HOMA-IR | 2.286 | 0.801 | 0.694 | 3.877 | 0.580 | < 0.001 | ||
| MetS- | 4.99 ± 3.55 (3.73) | 0.60 - 21.64 | ||||||
| MetS+ | 7.27 ± 4.41 (6.21) | 2.25 - 20.53 | ||||||
Abbreviations: HOMA-IR, homeostasis model assessment of insulin resistance; HDL-C, high-density lipoprotein cholesterol; SD, standard deviation; DBP, diastolic blood pressure; BMI, Body Mass Index; FPG, fasting plasma glucose; MetS, metabolic syndrome; SBP, systolic blood pressure; WC, waist circumference; TG, triglyceride; LDL-C, low-density lipoprotein cholesterol.
a Mann-Whitney U test.
4.2. Hematologic and Inflammatory Parameters of the Study Group
| Variables and Groups | Mean ± SD (Median) | Minimum-Maximum | Mean Difference | St. Error Difference | 95% CI of the Difference | Cohen’s Effect Size | P-Valuea | |
| Lower | Upper | |||||||
| WBCs (× 10³/mm³) | 1.503 | 0.506 | 0.498 | 2.509 | 0.603 | 0.003 | ||
| MetS- | 8.20 ± 2.06 (7.84) | 4.91 - 14.50 | ||||||
| MetS+ | 9.70 ± 2.97 (9.23) | 4.19 - 19.09 | ||||||
| Platelets (× 10³/mm³) | 36.511 | 12.925 | 10.857 | 62.165 | 0.574 | 0.022 | ||
| MetS- | 305.63 ± 65.24 (310.00) | 165.00 - 424.00 | ||||||
| MetS+ | 342.14 ± 61.19 (339.50) | 230.00 - 488.00 | ||||||
| Neutrophils(× 10³/mm³) | 1.304 | 0.392 | 0.525 | 2.083 | 0.676 | < 0.001 | ||
| MetS- | 4.24 ± 1.55 (4.10) | 1.80 - 9.82 | ||||||
| MetS+ | 5.54 ± 2.34 (5.23) | 1.81 - 14.60 | ||||||
| Lymphocytes (× 10³/mm³) | 0.030 | 0.177 | -0.320 | 0.382 | 0.035 | 0.865 | ||
| MetS- | 3.09 ± 0.81 (3.07) | 1.51 - 6.31 | ||||||
| MetS+ | 3.12 ± 0.94 (2.90) | 1.53 - 6.87 | ||||||
| Monocytes (× 10³/mm³) | 0.122 | 0.183 | -0.143 | 0.288 | 0.298 | 0.488 | ||
| MetS- | 0.82 ± 0.31 (0.78) | 0.30 - 1.71 | ||||||
| MetS+ | 0.94 ± 0.51 (0.79) | 0.29 - 2.43 | ||||||
| NLR | 0.433 | 0.139 | 0.157 | 0.710 | 0.633 | 0.002 | ||
| MetS- | 1.42 ± 0.53 (1.34) | 0.52 - 2.87 | ||||||
| MetS+ | 1.85 ± 0.84 (1.74) | 0.68 - 5.07 | ||||||
| PLR | 13.365 | 6.338 | 0.785 | 25.945 | 0.429 | 0.024 | ||
| MetS- | 103.46 ± 29.69 (105.17) | 49.13 - 194.68 | ||||||
| MetS+ | 116.83 ± 33.08 (116.51) | 53.57 - 197.39 | ||||||
| SII | 213.207 | 52.499 | 109.009 | 317.405 | 0.826 | < 0.001 | ||
| MetS- | 430.25 ± 163.23 (423.09) | 142.21 - 817.28 | ||||||
| MetS+ | 643.46 ± 348.27 (562.73) | 222.37 - 2088.6 | ||||||
| SIRI | 0.616 | 0.211 | 0.196 | 1.036 | 0.592 | 0.012 | ||
| MetS- | 1.16 ± 0.70 (0.96) | 0.43 - 3.67 | ||||||
| MetS+ | 1.78 ± 1.37 (1.44) | 0.36 - 2.95 | ||||||
Abbreviations: SD, standard deviation; NLR, neutrophil/lymphocyte ratio; MetS, metabolic syndrome; SII, Systemic Immune-Inflammation Index; WBCs, white blood cells; PLR, platelet/lymphocyte ratio; SIRI, Systemic Inflammation Response Index.
a Mann-Whitney U test.
| Variables | B | Standard Error | Wald | df | P-Value | Odds Ratio | 95% CI for Odds Ratio | |
|---|---|---|---|---|---|---|---|---|
| Lower | Upper | |||||||
| Pubertal status | -0.650 | 0.582 | 1.245 | 1 | 0.264 | 0.522 | 0.167 | 1.635 |
| SII | 0.005 | 0.002 | 8.995 | 1 | 0.003 | 1.005 | 1.002 | 1.008 |
| SIRI | -0.192 | 0.346 | 0.309 | 1 | 0.578 | 0.825 | 0.419 | 1.625 |
| BMI | 0.117 | 0.066 | 3.141 | 1 | 0.076 | 1.124 | 0.988 | 1.280 |
| HOMA-IR | 0.157 | 0.062 | 6.345 | 1 | 0.012 | 1.170 | 1.036 | 1.323 |
| Constant | -6.764 | 2.144 | 9.954 | 1 | 0.002 | 0.001 | ||
Abbreviations: SIRI, Systemic Inflammation Response Index; SII, Systemic Immune-Inflammation Index; BMI, Body Mass Index; HOMA-IR, homeostasis model assessment of insulin resistance.
4.3. Associations of Systemic Immune–Inflammation Index and Systemic Inflammatory Response Index with Components of Metabolic Syndrome
| Variables | Spearman's rho | P-Value | 95% CI (2-Tailed) a, b | |
|---|---|---|---|---|
| Lower | Upper | |||
| SII-WC | -0.054 | 0.595 | -0.254 | 0.151 |
| SII-SBP | 0.143 | 0.158 | -0.062 | 0.336 |
| SII-DBP | 0.227 | 0.024 | 0.026 | 0.412 |
| SII-HDL-C | 0.235 | 0.019 | 0.033 | 0.418 |
| SII-TG | -0.133 | 0.188 | -0.328 | 0.072 |
| SII-FPG | 0.199 | 0.048 | -0.004 | 0.387 |
| SIRI-WC | 0.078 | 0.445 | -0.128 | 0.276 |
| SIRI-SBP | 0.182 | 0.072 | -0.022 | 0.371 |
| SIRI-DBP | -0.079 | 0.436 | -0.278 | 0.126 |
| SIRI-HDL-C | 0.203 | 0.044 | 0.000 | 0.390 |
| SIRI-TG | -0.138 | 0.173 | -0.332 | 0.067 |
| SIRI-FPG | 0.352 | < 0.001 | 0.160 | 0.518 |
Abbreviations: SBP, systolic blood pressure; SII, Systemic Immune-Inflammation Index; FPG, fasting plasma glucose; TG, triglyceride; WC, waist circumference; DBP, diastolic blood pressure; SIRI, Systemic Inflammation Response Index; HDL-C, high-density lipoprotein cholesterol.
a Estimation based on Fisher’s r-to-z transformation.
b Estimation of standard error based on the formula suggested by Fieller et al.
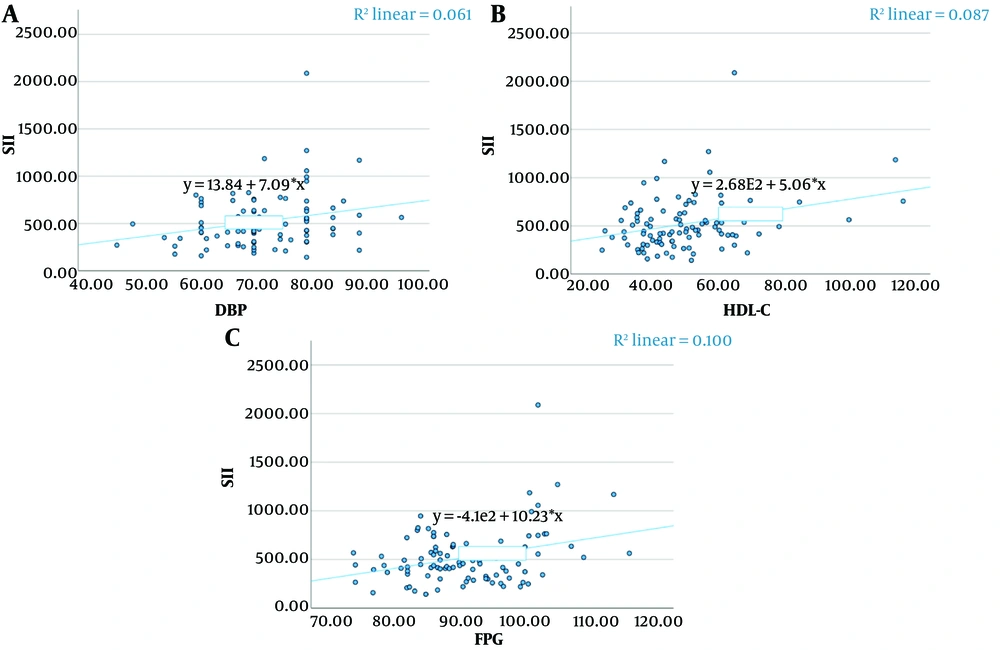
Scatter plot showing the relationship between Systemic Immune–Inflammation Index (SII) and high-density lipoprotein cholesterol (HDL-C) (A), SII and diastolic blood pressure (DBP) (B), SII and fasting plasma glucose (FPG) (C).
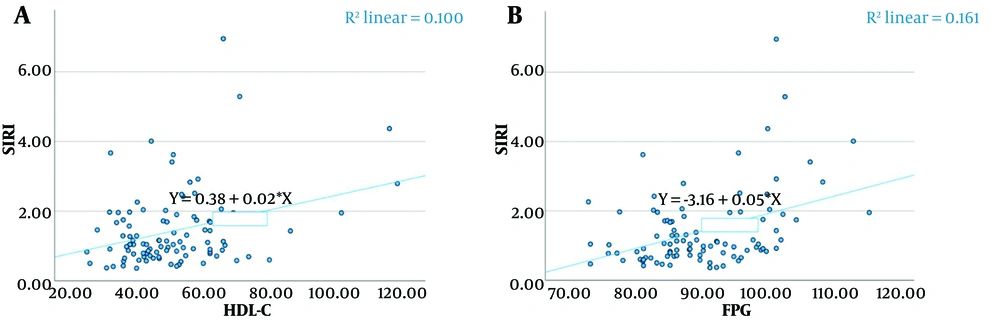
Scatter plot showing the relationship between Systemic Inflammatory Response Index (SIRI) and fasting plasma glucose (FPG) (A), SIRI and high-density lipoprotein cholesterol (HDL-C) (B).
4.4. Comparison of Systemic Immune–Inflammation Index and Systemic Inflammatory Response Index in Predicting Metabolic Syndrome
| Test Result Variables | AUC | Standard Error | P-Value | Asymptotic 95% CI | Sensitivity | Specificity | Cut-Off | |
|---|---|---|---|---|---|---|---|---|
| Lower Bound | Upper Bound | |||||||
| SII | 0.708 | 0.053 | 0.001 | 0.603 | 0.812 | 0.57 | 0.82 | 547.97 |
| SIRI | 0.649 | 0.059 | 0.012 | 0.534 | 0.763 | 0.61 | 0.68 | 1.14 |
Abbreviations: SIRI, Systemic Inflammation Response Index; SII, Systemic Immune-Inflammation Index; AUC, area under the curve.
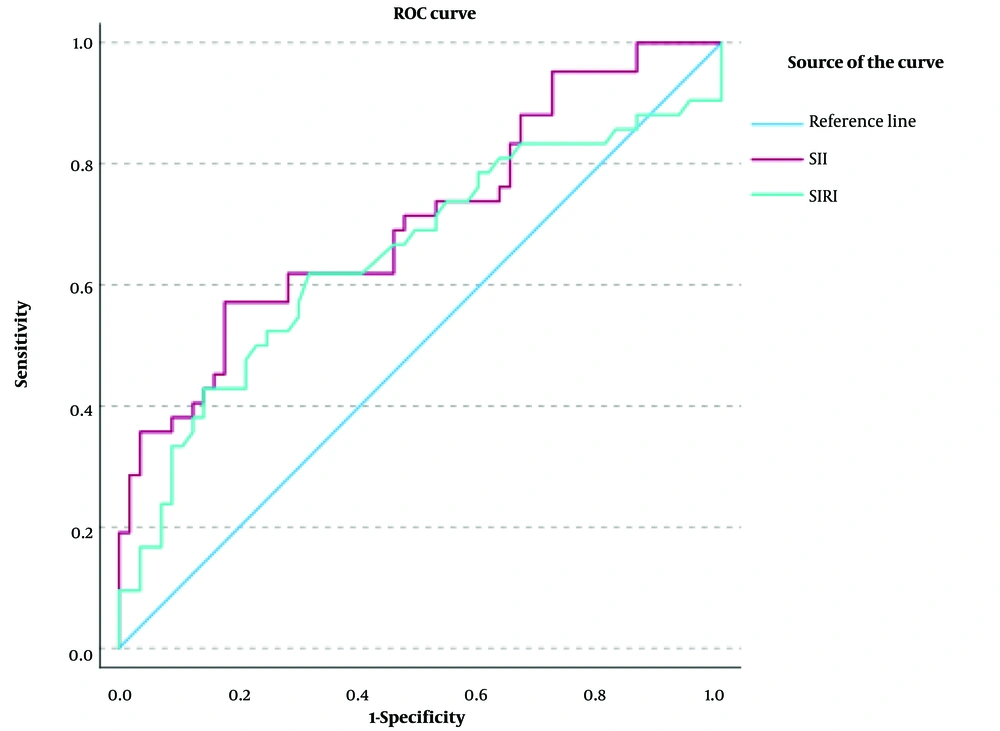
Receiver operating characteristic (ROC) curves for Systemic Immune-Inflammation Index (SII) and Systemic Inflammation Response Index (SIRI) to differentiate metabolic syndrome (MetS)


