


1. Background
Respiratory distress syndrome (RDS) is the most prevalent respiratory disease among preterm neonates and is primarily caused by quantitative and qualitative surfactant deficiency (1). This condition leads to increased surface tension, decreased lung compliance, and an elevated risk of alveolar collapse (2, 3). The severity of RDS increases until the third day of life, which may result in death due to severe hypoxemia and respiratory insufficiency (4). A delay in treatment increases the mortality rate up to 89% in developing countries (5). Exogenous surfactants have been widely used for the standard treatment and prevention of RDS in preterm neonates (6). In animal models, surfactant replacement therapy (SRT) improves pulmonary compliance and functional residual capacity and results in more homogeneous ventilation (7). The advent of SRT has reduced the rates of death and morbidity from RDS by approximately 50% (2). Prior meta-analyses reported that intratracheal administration of natural surfactants to neonates with RDS, compared with synthetic surfactants, could result in better outcomes, such as a lower mortality rate and less need for mechanical ventilation (8, 9).
Two natural surfactants, Curosurf and BLES, are available in Iran and are commonly used for the treatment of RDS. Curosurf (poractant alfa) is a suspension derived from porcine lungs that consists of phospholipids (mainly dipalmitoylphosphatidylcholine) and surfactant proteins that facilitate pulmonary gas exchange (10). BLES is obtained from bovine lung extract and was approved by the Canadian Pharmaceutical Organization (11). Differences in clinical effectiveness and complications between various animal-derived surfactants are most likely associated with different compositions (surfactant proteins, phospholipids, proportion of proteins to phospholipids), volumes, and viscosities (12).
In a study by Ramanathan et al. (13), the researchers reported a significantly lower mortality rate and fewer additional doses in the Curosurf group than in the group treated with beractant (bovine surfactant) in preterm neonates with RDS. Malloy et al. (14) indicated that patients with RDS treated with Curosurf had a lower need for a fraction of inspired oxygen (FiO2) during the first two days compared with the beractant group. However, in another study, Curosurf and bovactant had similar efficacy and adverse outcomes of prematurity among preterm infants with RDS (15).
2. Objectives
To the best of our knowledge, few studies have compared the use of Curosurf and BLES in the treatment of RDS. Animal-derived surfactants have different pharmacological and biochemical features, and these differences might influence their clinical efficacy and complications. Therefore, we hypothesize that these surfactants may exhibit superiority in the administration of one over the other. In the present trial, we plan to compare the clinical efficacy and safety of Curosurf and BLES in the management of RDS in preterm neonates.
3. Methods
The present study was registered on Iranian Registry of Clinical Trials website (IRCT20170513033941N54) following endorsement by the Ethics Committee of Kashan University of Medical Sciences (KAUMS). This clinical trial included all neonates with RDS and a gestational age of ≤ 32 weeks who were admitted to the neonatal intensive care unit (NICU) of Shahid Beheshti Hospital affiliated with KAUMS, Kashan, Iran, between April 21, 2018, and November 7, 2021. The RDS was diagnosed based on radiologic findings and classic manifestations (16). Neonates with meconium aspiration syndrome, serious congenital cardiac diseases, other congenital disorders, respiratory insufficiency due to diseases other than RDS, a 5-minute Apgar score < 4, rupture of membranes for more than 3 weeks, and neonates without parental informed consent were excluded.
The preterm neonates with RDS were assigned to two groups via the balanced blocked randomization method with a block size of four (two groups per block). The sequence of blocks was generated by a random number generator website (https://www.stattrek.com/statistics/random-number-generator). Treatment allocation was concealed using opaque, sealed, numbered envelopes, which were unveiled by a respiratory therapist uninvolved in the neonates’ clinical care, immediately after intubation. To ensure blinding, a respiratory therapist not engaged in the clinical management of patients was responsible for administering the surfactants. Surfactant doses were prepared away from the bedside and transferred into a syringe wrapped in opaque tape, except for the numbers showing the amount in the syringe. Consequently, only the respiratory therapist responsible for preparing and administering the surfactants was aware of the syringes’ contents.
Administration adhered to a standardized protocol to reinforce blinding, ensuring that the procedure duration remained consistent across all participants: Curosurf was administered in a single aliquot, followed by an additional air aliquot, whereas BLES was administered in two aliquots. Neonates in both intervention groups were managed identically. The clinicians overseeing patient care, the data assessor, the neonates’ parents, and the research team remained unaware of the allocated surfactant throughout the investigation. This protocol was extended to any additional doses administered to the participants. The purpose and protocol of the clinical trial were explained to all participants’ parents, who provided signed informed consent.
3.1. Sample Size Calculation
The type I and type II errors in the trial sample size formula were 0.01 and 0.15, respectively. The sample size was calculated based on a trial reported by Mussavi et al. (17) to compare the influence of the administration of Curosurf and Alveofact on the number of surfactant injections in neonates with RDS. Using the formula, we needed 74 neonates with RDS in each group; after allowing for six dropouts, the final sample size was 80 participants in each intervention group.
3.2. Intervention
In accordance with the guidelines for RDS treatment (18, 19), at the time of admission, all neonates were intubated and treated with one of two types of surfactants: One group received 200 mg/kg Curosurf (Chiesi Farmaceutici, Parma, Italy), and the other group received 135 mg/kg BLES (BLES Biochemicals Inc., Ontario, Canada) as soon as possible after randomized allocation. A second dose of the drug was prescribed 12 hours later if the neonates still required an FiO2 > 40%. All neonates received standard treatment for RDS.
3.3. Outcome Measures
The primary outcome was the number of surfactant injections. Length of oxygen dependency, duration of hospital stay (NICU stay), and complications of prematurity were defined as secondary outcomes. Necrotizing enterocolitis (NEC) was determined by the modified Bell’s classification (20). Cranial sonography for the diagnosis of intraventricular hemorrhage (IVH) was performed at 7 days after birth by an expert radiologist. Pneumothorax was diagnosed as an air leak that accumulated in the pleural cavity by chest X-ray. The diagnosis of sepsis was based on the coexistence of clinical signs of infection and positive blood or tracheal aspirate cultures. Data on other complications, such as retinopathy of prematurity (ROP) (21), pneumonia, pulmonary hemorrhage, and clinical outcomes, including the need for additional doses, total duration of oxygen dependency, and length of hospital stay, were also recorded.
3.4. Statistical Analysis
The Kolmogorov-Smirnov test was used to determine the normality of the data. To investigate significant changes in continuous parameters between intervention groups, we utilized the independent t-test. To compare categorical variables, the Pearson chi-square test and Fisher’s exact test were applied. The adjusted relative risk (with 95% CI) was calculated via regression analyses to control for confounding factors, including gestational age and birth weight. Statistical significance was defined as a P-value less than 0.05. SPSS version 16 (Chicago, Illinois, USA) was used for all analyses.
4. Results
As displayed in the participant flow diagram (Figure 1), 160 preterm neonates [Curosurf group (n = 80) and BLES group (n = 80)] were included in this trial, and no patients were lost to follow-up. The baseline demographic and clinical characteristics of the patients, including gestational age, birth weight, sex, Apgar score, baseline FiO2, baseline O2 saturation, rate of antenatal corticosteroid therapy, type of delivery, and rate of rupture of membranes, were not significantly different between the Curosurf and BLES groups (Table 1). The differences in the length of hospital stay (20.3 ± 14.4 vs. 27.3 ± 18.8 days, P = 0.01), number of surfactant injections (1.2 ± 0.4 vs. 1.4 ± 0.4, P = 0.006), and need for a second dose (21.2% vs. 41.2%, P = 0.005) between the Curosurf group and the BLES group were statistically significant; other outcomes did not differ substantially (Table 2). There was no significant difference in any adverse outcome, including mortality rate, pulmonary hemorrhage, pneumothorax, pneumonia, sepsis, IVH, NEC, or ROP, between the two intervention groups (Table 3).
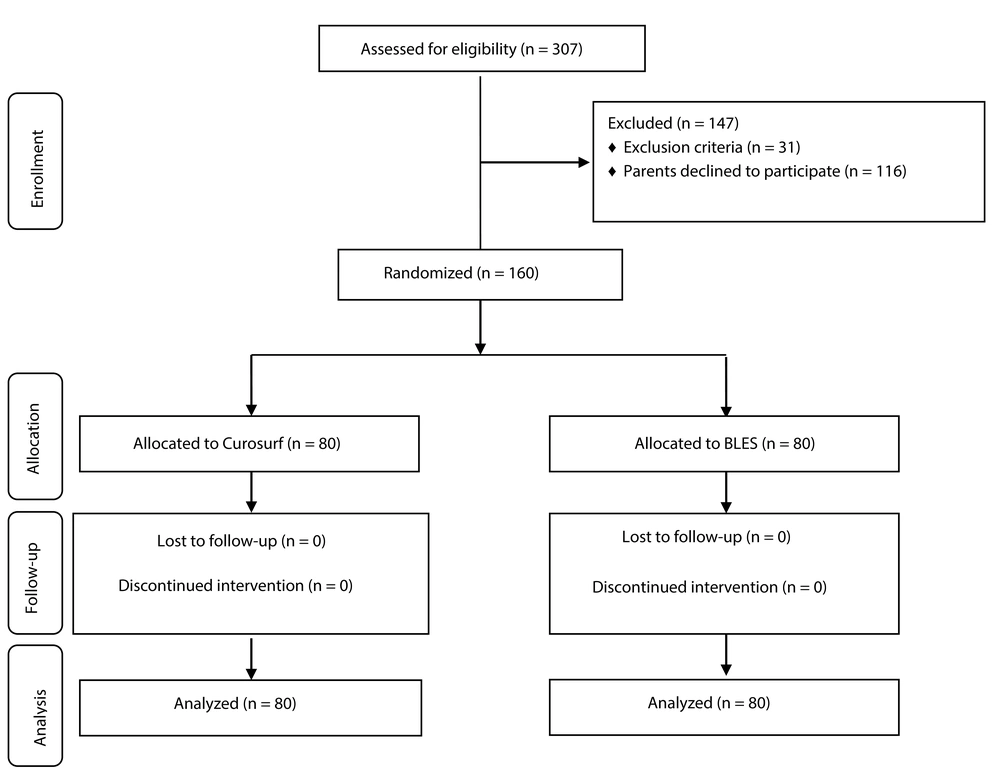
Figure 1.
Summary of patient flow diagram
Table 1.Baseline Demographic and Clinical Characteristics of the Participants a
| Variables | Curosurf (n = 80) | BLES (n = 80) | P-Value b |
|---|---|---|---|
| Gender | 0.63 c | ||
| Male | 43 (53.8) | 46 (57.5) | |
| Female | 37 (46.2) | 34 (42.5) | |
| Birth weight (g) | 1186.3 ± 387.2 | 1092.4 ± 368.8 | 0.11 |
| Gestational age (wk) | 28.9 ± 2.1 | 29.4 ± 2.3 | 0.16 |
| 1-min Apgar score | 6.5 ± 2.0 | 6.2 ± 1.8 | 0.29 |
| 5-min Apgar score | 8.2 ± 1.3 | 8.0 ± 1.1 | 0.16 |
| Baseline FiO2 (%) | 71.6 ± 13.5 | 74.5 ± 17.9 | 0.25 |
| Baseline O2 saturation (%) | 81.9 ± 10.2 | 78.9 ± 13.7 | 0.12 |
| Ante-natal corticosteroid therapy | 63 (78.8) | 58 (72.6) | 0.35 c |
| Delivery type, cesarean | 71 (88.8) | 68 (85.0) | 0.48 c |
| PPROM | 17 (21.2) | 13 (16.2) | 0.41 c |
Abbreviation: PPROM, preterm premature rupture of membranes.
a Values are expressed as No. (%) or mean ± SD.
b Obtained from independent t-test unless otherwise indicated.
c Obtained from Pearson chi-square test.
Table 2.Study Outcome Parameters a
| Variables | Curosurf (n = 80) | BLES (n = 80) | P-Value b |
|---|---|---|---|
| Oxygen dependency (d) | 10.5 ± 6.6 | 12.1 ± 7.4 | 0.13 |
| Duration of hospital stay (d) | 20.3 ± 14.4 | 27.3 ± 18.8 | 0.01 |
| Number of surfactant injections | 1.2 ± 0.4 | 1.4 ± 0.4 | 0.006 |
| Needing second dose; No. (%) | 17 (21.2) | 33 (41.2) | 0.005 c |
| FiO2 requirement one hour after SRT (%) | 62.7 ± 12.3 | 66.1 ± 15.7 | 0.12 |
| FiO2 requirement 6 hours after SRT (%) | 43.8 ± 13.1 | 46.6 ± 16.2 | 0.22 |
| O2 saturation one hour after SRT (%) | 85.4 ± 6.1 | 83.4 ± 8.9 | 0.11 |
| O2 saturation 6 hours after SRT (%) | 92.5 ± 5.4 | 90.6 ± 9.2 | 0.12 |
Abbreviation: SRT, surfactant replacement therapy.
a Values are expressed as mean ± SD unless otherwise indicated.
b Obtained from independent t-test unless otherwise indicated.
c Obtained from the Pearson chi-square test.
Table 3.Adverse Outcomes of Prematurity in the Studied Neonates a
| Complications | Curosurf (n = 80) | BLES (n = 80) | RR (95% CI) | Adjusted RR (95% CI) | P-Value b |
|---|---|---|---|---|---|
| Pneumothorax | 4 (5) | 5 (6.2) | 0.88 (0.41 - 1.86) | 0.93 (0.74 - 1.15) | 0.73 |
| Pulmonary hemorrhage | 6 (7.5) | 8 (10) | 0.84 (0.45 - 1.58) | 0.91 (0.76 - 1.10) | 0.57 |
| Pneumonia | 7 (8.8) | 10 (12.5) | 0.80 (0.44 - 1.45) | 0.99 (0.84 - 1.17) | 0.44 |
| Sepsis | 11 (13.8) | 13 (16.2) | 0.90 (0.56 - 1.43) | 1.01 (0.87 - 1.16) | 0.65 |
| IVH | 5 (6.2) | 7 (8.8) | 0.82 (0.41 - 1.63) | 0.91 (0.75 - 1.09) | 0.54 |
| NEC | 3 (3.8) | 2 (2.5) | 1.20 (0.58 - 2.51) | 1.02 (0.76 - 1.38) | 0.64 c |
| ROP | 9 (11.2) | 6 (7.5) | 1.22 (0.78 - 1.91) | 1.12 (0.93 - 1.34) | 0.49 c |
| Mortality | 7 (8.8) | 9 (11.2) | 0.86 (0.48 - 1.53) | 0.92 (0.78 - 1.09) | 0.59 |
Abbreviations: IVH, intraventricular hemorrhage; NEC, necrotizing enterocolitis; ROP, retinopathy of prematurity.
a Values are expressed as No. (%).
b Obtained from the Pearson chi-square test unless otherwise indicated.
c Obtained from Fisher’s exact test.
5. Discussion
Our trial demonstrated that the administration of Curosurf surfactant compared to BLES surfactant in neonates with RDS might reduce the duration of hospital stay and the number of surfactant injections. There were no considerable differences in other outcomes or the occurrence of complications of prematurity between the two intervention groups. The prescription of natural surfactants to preterm neonates with RDS decreases surface tension, improving lung compliance and gas exchange, thereby reducing the mortality rate due to pulmonary insufficiency (22).
Several studies have compared the efficacy and complications of porcine surfactants to bovine surfactants. Lemyre et al. (23) demonstrated that Curosurf can be more beneficial for RDS treatment in premature neonates and is associated with fewer complications than BLES. Moreover, the duration of oxygen support was reduced in patients who received Curosurf. They observed five episodes of severe airway obstruction in neonates who received BLES and none in subjects who received Curosurf. In another trial, Curosurf and BLES had similar therapeutic efficacy, with no significant differences in assisted ventilation, hospital stay duration, oxygenation index, or adverse effects (24).
In a study by Baroutis et al. (25) among neonates with RDS, the researchers revealed that the Curosurf group, compared with bovine surfactant groups (beractant and bovactant), had a significantly shorter duration of oxygen dependency and hospital stay, but no significant differences were observed among the intervention groups regarding the side effects of prematurity and mortality rate. Mussavi et al. (17) compared the same animal-derived surfactants and reported that the rate of pneumothorax and duration of hospitalization were significantly lower in the Curosurf group. Najafian et al. (26) reported a lower need for additional doses for RDS treatment in the Curosurf group than in the beractant group, while both groups had the same complications and mortality. In another study, neonates treated with Curosurf had fewer redosing surfactants and a shorter duration of oxygen dependency (27).
A previous meta-analysis documented that the prescription of Curosurf surfactant is correlated with better outcomes, including a lower mortality rate and fewer occurrences of pulmonary hemorrhage, air leaks, and the need for a second dose in preterm neonates suffering from RDS, compared to those who received bovine surfactants (28). However, in a study conducted by Saeedi et al. (29), the effectiveness and adverse outcomes of Curosurf and beractant were equal in the management of neonatal RDS. Furthermore, Curosurf and bovactant have similar efficacy and complications of prematurity among preterm neonates with RDS (15). Finally, in a cohort study, no preferential application of either Curosurf or beractant in SRT among preterm neonates was reported (30).
Natural surfactants have various biochemical and pharmacological properties, and these differences may affect their clinical efficacy and complications (31). The greater effectiveness of Curosurf may be associated with its resistance to catabolism and damage caused by hydrolysis enzymes such as secretory phospholipase A2, as well as the phospholipid profile and surfactant protein B content that are required to stabilize and protect the surfactant film (32, 33).
Both BLES and Curosurf are available in our country, and there is no preference for the administration of one surfactant over the other by Iranian doctors. Curosurf vials are more expensive than BLES vials, and these drugs are under proper insurance support. Our results showed that the administration of BLES is more correlated with the need for a second dose and an increased hospital stay. The daily cost of NICU hospitalization ranges from $200 to $3000, with significant global variations attributable to disparities in healthcare systems and national income levels (34, 35). The 7-day difference in hospital stay duration, which is statistically significant (P = 0.01), is clinically meaningful in terms of healthcare costs. Therefore, this observed benefit of Curosurf, combined with its reduced requirement for redosing (21.2% vs. 41.2%), may explain its potential higher cost compared to BLES.
However, a key limitation of this study is the absence of a cost-effectiveness analysis to guide clinical decision-making. Furthermore, the study does not discuss long-term outcomes such as neurodevelopmental status at one year, which would provide a more comprehensive understanding of the effectiveness of these surfactants. Additionally, this investigation does not address potential biases, such as the possibility that some neonates had unmeasured risk factors that affected the surfactant response. These limitations restrict the generalizability of our findings and should be considered in the interpretation of the results.
5.1. Conclusions
Our findings showed that Curosurf may be more effective than BLES in the treatment of preterm neonates with RDS. Further clinical trials with robust designs and long-term follow-up are needed to compare these surfactants and assess the developmental impact of surfactant choice.


