


1. Background
2. Objectives
3. Methods
3.1. Statistical Analysis
4. Results
| Variables | Groups | P-Value b | |
|---|---|---|---|
| Study (n = 68) | Control (n = 115) | ||
| Gender | 0.160 c | ||
| Female | 36 (52.9) | 73 (63.5) | |
| Male | 32 (47.1) | 42 (36.5) | |
| Delivery | 0.064 c | ||
| Normal | 50 (73.5) | 69 (60.0) | |
| C/S | 18 (26.5) | 46 (40.0) | |
| Mother age | 29 (24 - 34) | 29 (24 - 33.7) | 0.591 |
| Gestational week | 40 (39 - 40) | 39 (38 - 40) | 0.071 |
| Weight | 3360 (3152 - 3700) | 3245 (3092 - 3500) | 0.067 |
| Height | 51 (49 - 52) | 50 (49 - 52) | 0.188 |
| Head circumference | 35 (34 - 35) | 34.5 (34 - 35) | 0.091 |
| Apgar 1 | 9 (8 - 9) | 9 (8 - 9) | 0.473 |
| Apgar 5 | 10 (9 - 10) | 10 (9 - 10) | 0.368 |
| Perfusion Index | 2.54 (2.1 - 3.1) | 2.5 (2.0 - 3.0) | 0.171 |
a Values are presented as No. (%) or median (Q1 - Q3).
b Mann Whitney U test unless otherwise indicated.
c Chi-square test.
| Variables | Groups a | P-Value b | |
|---|---|---|---|
| Study (n = 68) | Control (n = 115) | ||
| cBase | -2.3 (-4.85 to -1.0) | -2.20 (-3.6 to -0.5) | 0.087 |
| Lactate | 2.81 (2.22 - 3.50) | 2.30 (1.94 - 3.20) | 0.003 |
| P50; mean ± SD | 24.65 ± 3.52 | 23.54 ± 3.37 | 0.036 c |
| ctO2 | 11.9 (8.4 - 14.0) | 13.1 (10.4 - 15.3) | 0.035 |
| pH | 7.32 (7.28 - 7.37) | 7.34 (7.31 - 7.37) | 0.164 |
| PCO2 | 43.7 (38.52 - 50.97) | 42.6 (38.7 - 47.0) | 0.204 |
| SO2 | 53.9 (37.27 - 71.32) | 61.3 (48.9 - 74.3) | 0.084 |
| HCO3(P)c; mean ± SD | 22.04 ± 2.40 | 22.69 ± 2.47 | 0.086 c |
a Values are presented as median (Q1 - Q3) unless otherwise indicated.
b Mann Whitney U test unless otherwise indicated.
c Independent samples t-test.
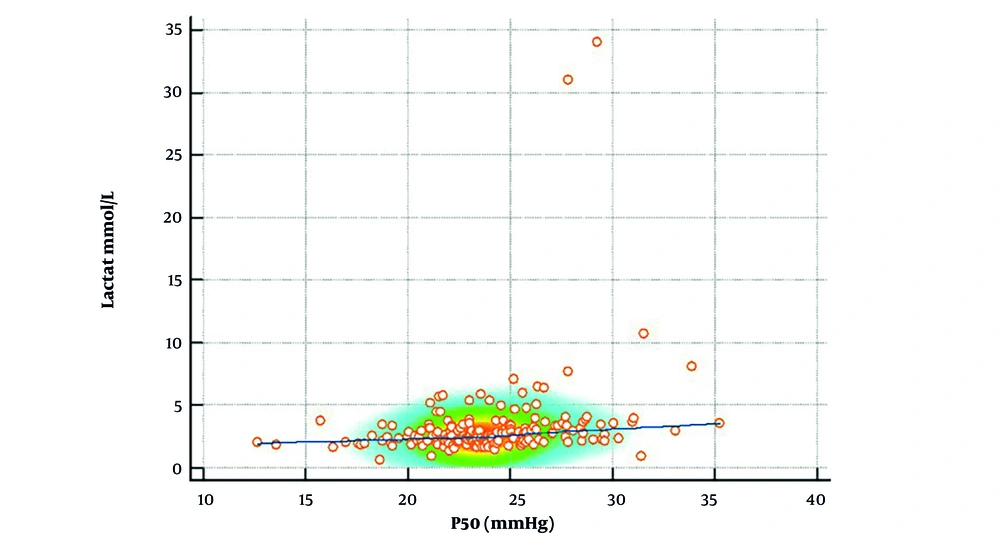
Correlation between P50 and lactate levels: This scatter plot illustrates the correlation between P50 and lactate levels in neonates. The positive correlation (r = 0.39, P = 0.001) observed in the meconium-stained amniotic fluid (MSAF) group suggests that increased oxygen dissociation is associated with elevated lactate levels, indicating impaired oxygen utilization. The color density represents data clustering.
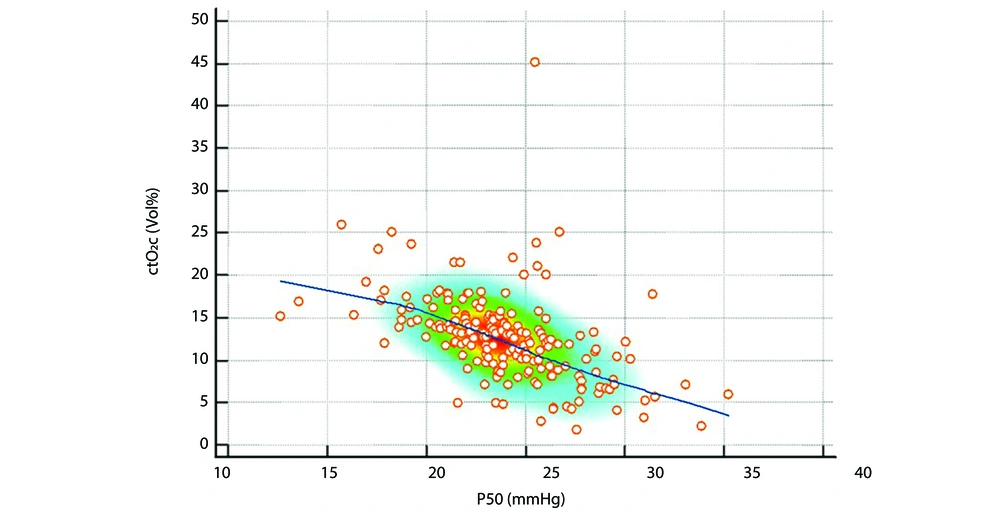
Correlation Between P50 and oxygen content (ctO2): This scatter plot depicts the relationship between P50 and ctO2 in neonates. A significant negative correlation (r = -0.54, P < 0.001) was observed, suggesting that higher P50 values are associated with reduced oxygen content, reflecting decreased systemic oxygen availability. The density distribution highlights areas with higher data concentration.
| Variables | Study Group | Control Group | ||
|---|---|---|---|---|
| r-Value (Correlation Coefficient) | P-Value a | r-Value (Correlation Coefficient) | P-Value a | |
| cBase | -0.001 | 0.991 | -0.98 | 0.298 |
| Lactate | 0.39 | 0.001 | 0.23 | 0.011 |
| ctO2 | -0.54 | < 0.001 | -0.62 | < 0.001 |
| pH | -0.53 | < 0.001 | -0.48 | < 0.001 |
| PCO2 | 0.50 | < 0.001 | 0.47 | < 0.001 |
| SO2 | -0.53 | < 0.001 | -0.53 | < 0.001 |
| HCO3(P)c | 0.010 | 0.936 b | -0.002 | 0.987 b |
a Spearman’s correlation test unless otherwise indicated.
b Pearson’s correlation test.
| Variables | β (Coefficient) | Std. Error | t-Value | P-Value |
|---|---|---|---|---|
| Constant | 23.60 | 0.41 | 58.12 | < 0.001 |
| Smoking | 5.19 | 3.14 | 1.65 | 0.103 |
| EMR | 1.30 | 1.61 | 0.81 | 0.423 |
| UTI | -0.15 | 1.18 | -0.13 | 0.896 |
Abbreviations: EMR, early membrane rupture; UTI, urinary tract infection.


