


1. Background
2. Objectives
3. Methods
3.1. Study Population
3.2. Data Collection and Cytomegalovirus DNA Tests
3.3. Antibodies to Cytomegalovirus Detection
3.4. Statistical Analyses
4. Results
| Variables | ≤ 3 Weeks | 4 Weeks - 3 Months | 3 Months - 1 Year | 1 - 6 Years | > 6 Years |
|---|---|---|---|---|---|
| Overall | 1.13 (0.99, 1.28) | 23.87 (23.04, 24.70) | 67.02 (65.53, 68.48) | 37.70 (35.95, 39.49) | 11.41 (9.91, 13.05) |
| Gender | |||||
| Male | 1.10 (0.92, 1.30) | 23.99 (22.89, 25.12) | 68.54 (66.63, 70.41) | 36.79 (34.46, 39.17) | 10.84 (8.95, 12.96) |
| Female | 1.17 (0.96, 1.41) | 23.71 (22.47, 24.98) | 64.80 (62.43, 67.13) | 38.88 (36.21, 41.61) | 12.24 (9.85, 14.96) |
| P-value | 0.67 | 0.76 | 0.03 | 0.26 | 0.42 |
| Year | |||||
| 2018 | 1.24 (0.96, 1.56) | 24.90 (23.17, 26.70) | 72.61 (69.47, 75.59) | 52.96 (48.72, 57.17) | 18.07 (14.08, 22.64) |
| 2019 | 0.99 (0.75, 1.28) | 24.63 (22.94, 26.37) | 68.10 (64.87, 71.21) | 41.47 (37.91, 45.09) | 8.56 (6.10, 11.61) |
| 2020 | 0.97 (0.67, 1.37) | 25.18 (23.00, 27.47) | 69.41 (65.58, 73.05) | 33.19 (28.97, 37.62) | 11.63 (7.98, 16.18) |
| 2021 | 1.17 (0.83, 1.59) | 24.79 (22.90, 26.75) | 66.79 (63.45, 70.00) | 29.61 (26.04, 33.38) | 10.16 (7.05, 14.04) |
| 2022 | 1.30 (0.93, 1.77) | 19.58 (17.81, 21.44) | 58.93 (55.55, 62.24) | 29.91 (26.05, 33.98) | 9.271 (6.25, 13.12) |
| P-value | 0.53 | < 0.001 | < 0.001 | < 0.001 | 0.0005 |
| Patient type | |||||
| Outpatient | 18.84 (13.75, 24.84) | 37.50 (35.64, 39.38) | 68.18 (66.38, 69.94) | 64.00 (60.18, 67.70) | 14.29 (63.75, 26.22) |
| Inpatient | 0.95 (0.82, 1.09) | 19.16 (18.28, 20.07) | 64.62 (61.95, 67.22) | 30.23 (28.35, 32.16) | 11.31 (9.79, 12.97) |
| P-value | < 0.001 | < 0.001 | 0.03 | < 0.001 | 0.63 |
| Season | |||||
| Winter | 1.14 (0.87, 1.47) | 21.34 (19.81, 22.94) | 65.31 (61.82, 68.69) | 32.21 (28.78, 35.78) | 8.74 (6.29, 11.76) |
| Spring | 0.97 (0.71, 1.29) | 24.10 (22.43, 25.84) | 64.58 (61.54, 67.54) | 40.50 (36.89, 44.18) | 11.06 (8.27, 14.40) |
| Summer | 1.35 (1.06, 1.69) | 24.59 (22.89, 26.35) | 68.96 (66.21, 71.61) | 38.36 (35.00, 41.79) | 11.66 (8.83, 15.01) |
| Autumn | 1.02 (0.77, 1.32) | 25.60 (23.92, 27.33) | 68.43 (65.53, 71.22) | 39.68 (36.00, 43.45) | 15.34 (11.53, 19.81) |
| P-value | 0.24 | 0.002 | 0.08 | 0.005 | 0.05 |
a Values are expressed as prevalence (%) (95% CI).
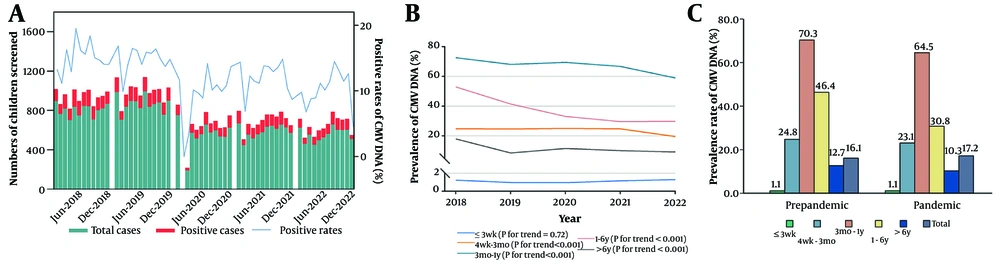
A, Cytomegalovirus (CMV) DNA monthly distributions; and B, temporal trend of positive rates; C, positive rates before and during the COVID-19 pandemic
| Variables | ≤ 3 Weeks | 4 Weeks - 3 Months | 3 Months - 1 Year | 1 - 6 Years | > 6 Years |
|---|---|---|---|---|---|
| Overall | 0.20 (0.14, 0.27) | 11.96 (11.39, 12.56) | 5.95 (5.53, 6.38) | 2.79 (2.55, 3.05) | 1.22 (1.01, 1.46) |
| Gender | |||||
| Male | 0.16 (0.10, 0.26) | 12.04 (11.28, 12.84) | 5.93 (5.39, 6.50) | 2.26 (1.98, 2.57) | 0.99 (0.74, 1.29) |
| Female | 0.25 (0.15, 0.38) | 11.86 (11.00, 12.77) | 5.97 (5.33, 6.67) | 3.55 (3.13, 4.00) | 1.51 (1.16, 1.93) |
| P-value | 0.26 | 0.78 | 0.95 | < 0.001 | 0.026 |
| Year b | |||||
| 2019 | 0.23 (0.13, 0.39) | 12.40 (11.31, 13.55) | 6.42 (5.58, 7.35) | 3.61 (3.05, 4.25) | 1.49 (1.01, 2.11) |
| 2020 | 0.16 (0.06, 0.34) | 14.20 (12.83, 15.65) | 6.29 (5.39, 7.29) | 0.80 (0.52, 1.16) | 0.39 (0.16, 0.80) |
| 2021 | 0.18 (0.06, 0.38) | 12.79 (11.42, 14.25) | 6.15 (5.21, 7,21) | 0.66 (0.43, 0.97) | 0.41 (0.18, 0.80) |
| 2022 | 0.18 (0.06, 0.41) | 10.39 (9.06, 11.84) | 5.25 (4.32, 6.31) | 1.15 (0.85, 1.53) | 0.84 (0.51, 1.29) |
| P-value | 0.83 | 0.002 | 0.34 | < 0.001 | < 0.001 |
| Patient type | |||||
| Outpatient | 1.36 (0.28, 3.92) | 16.00 (14.45, 17.65) | 5.12 (4.47, 5.83) | 1.84 (1.46, 2.29) | 1.37 (0.77, 2.25) |
| Inpatient | 0.19 (0.13, 0.26) | 11.12 (10.51, 11.75) | 6.38 (5.85, 6.94) | 3.10 (2.81, 3.41) | 1.19 (0.97, 1.45) |
| P-value | 0.01 | < 0.001 | 0.006 | < 0.001 | 0.72 |
a Values are expressed as prevalence (%) (95% CI).
b We did not present the prevalence data in the year 2018 because of the lack of data for the first four months.
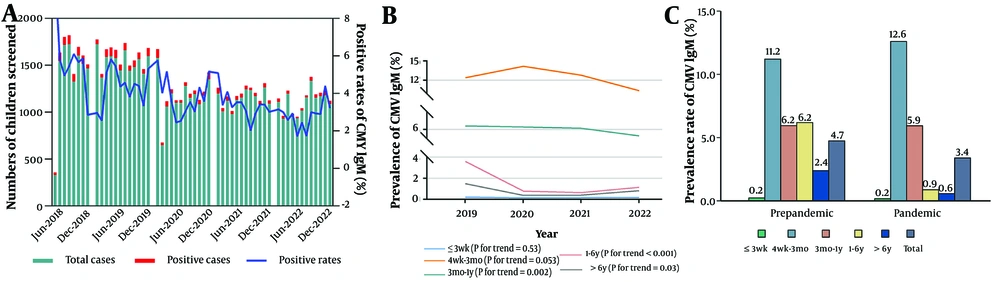
A, Cytomegalovirus (CMV)-specific antibodies IgM monthly distributions; B, temporal trend of positive rates; and C, positive rates before and during the COVID-19 pandemic
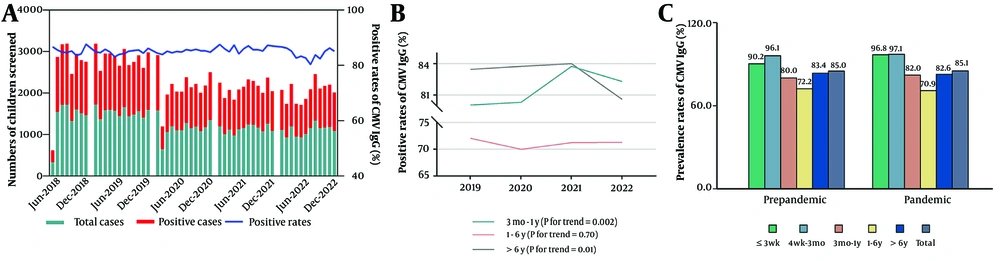
A, Cytomegalovirus (CMV) specific antibodies IgG monthly distributions; B, temporal trend of positive rates; and C, positive rates before and during the COVID-19 pandemic
| Variables | OR | 95% CI | P-Value |
|---|---|---|---|
| Multivariate analysis for urine CMV DNA prevalence | |||
| Prepandemic | 1.00 (Reference) | - | - |
| Pandemic | 0.71 | 0.67 ~ 0.76 | < 0.001 |
| Multivariate analysis for CMV IgM prevalence | |||
| Prepandemic | 1.00 (Reference) | - | - |
| Pandemic | 0.71 | 0.65 ~ 0.76 | < 0.001 |
| Multivariate analysis for CMV IgG prevalence | |||
| Prepandemic | 1.00 (Reference) | - | - |
| Pandemic | 1.19 | 1.14 ~ 1.25 | < 0.001 |
Abbreviations: OR, odds ratio; CI, confidence interval; CMV, cytomegalovirus.
a The model was adjusted for age, sex, patient type, and season.


