


1. Background
2. Objectives
3. Methods
3.1. Selection and Description of Participants
3.2. Study Design
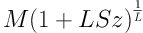
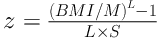
3.3. Statistics

4. Results
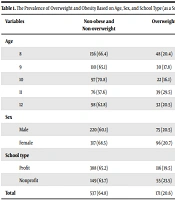
| Boys (n = 803) | Girls (n = 752) | Total | |
|---|---|---|---|
| Age (y) | 12.4 (3.7) | 12.6 (3.7) | 12.5 (3.7) |
| BMI (kg/m2) | 20.1 (4.7) | 20.4 (4.3) | 20.3 (4.5) |
| Obese, local IOTF (%) | 11.3c | 6.6 | 9 |
| Overweight, local IOTF (%) | 22.5c | 25.1 | 23.9 |
| Obese, international IOTF (%) | 9.5c | 6 | 7.8 |
| Overweight, international IOTF (%) | 20.6c | 23.9 | 22.2 |
| Obese, BMI ≥ CDC 95th percentile (%) | 3.7 | 4.6 | 4.2 |
| Overweight, CDC 85th ≤ BMI ≤ CDC 95th percentile (%) | 10.6 | 10.3 | 10.5 |
| FPG (mg/dL) | 93.4 (7.0)c | 91.1 (7.3) | 92.3 (7.3) |
| TC (mg/dL)b | 154 (136 - 172) | 157 (139 - 175) | 158 (137 - 154) |
| TG (mg/dL)b | 78 (60 - 108) | 79 (63 - 109) | 78 (61 - 108) |
| HDL-C (mg/dL) | 51.2 (11.4) | 51.2 (11.1) | 51.2 (11.2) |
| LDL-C (mg/dL) | 86.9 (25.8) | 88.8 (25.2) | 87.8 (25.5) |
| WC (cm) | 72.9 (14.7)c | 70.2 (12.4) | 71.6 (13.7) |
| SBP (mmHg) | 101.8 (13.2)c | 98.3 (11.4) | 100.1 (12.5) |
| DBP (mmHg) | 51.2 (11.4) | 51.2 (11.1) | 51.2 (11.2) |
Abbreviations: BMI, body mass index; CDC; center for disease control; DBP, diastolic blood pressure; FPG, fasting plasma glucose; HDL-C, high-density lipoprotein cholesterol; IOTF, international obesity task force; SBP, systolic blood pressure; TC, total cholesterol; TG, triglyceride; LDL-C, Low-density lipoprotein cholesterol; WC, waist circumference.
a Values are expressed as mean (SD), or percentage.
b Values are presented as median (IQ 25 - 75).
c Between sexes, P < 0.05 is considered significant.

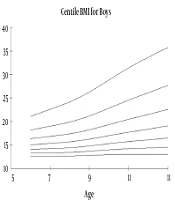
Local IOTF cut-offs derived from L, M, and S curves in 1555 children from Tehran
| Age (y) | Overweight | Obesity | ||||||
|---|---|---|---|---|---|---|---|---|
| IOTF | CDC | IOTF | CDC | |||||
| Boy | Girl | Boy | Girl | Boy | Girl | Boy | Girl | |
| 5 | 16.4 | 17.0 | 18.2 | 20.3 | 19.3 | 19.8 | 23.9 | 31.7 |
| 6 | 16.6 | 17.01 | 18.3 | 17.1 | 19.7 | 20.01 | 23.7 | 22.7 |
| 7 | 16.7 | 17.3 | 18.6 | 19.9 | 20.2 | 20.4 | 22.4 | 21.2 |
| 8 | 17.1 | 17.9 | 21.6 | 18.5 | 20.8 | 21.2 | 24.8 | 22.1 |
| 9 | 17.6 | 18.8 | 21.01 | 20.7 | 21.6 | 22.3 | 24.7 | 22.7 |
| 10 | 18.5 | 19.8 | 22.2 | 22.7 | 22.6 | 23.6 | 26.1 | 25.1 |
| 11 | 19.8 | 20.9 | 22.3 | 22.8 | 23.8 | 24.9 | 25.4 | 24.3 |
| 12 | 20.5 | 22.1 | 24.8 | 24.4 | 25.1 | 26.3 | 29.3 | 28.3 |
| 13 | 21.4 | 23.2 | 25.9 | 25.4 | 26.2 | 27.7 | 28.8 | 27.5 |
| 14 | 22.2 | 24.0 | 26.7 | 27.2 | 27.1 | 28.7 | 28.7 | 28.4 |
| 15 | 22.9 | 24.5 | 27.4 | 25.7 | 27.9 | 29.3 | 31.3 | 29.8 |
| 16 | 23.6 | 24.7 | 27.4 | 25.7 | 28.6 | 29.7 | 32.0 | 29.5 |
| 17 | 24.3 | 24.9 | 29.2 | 27.4 | 29.3 | 29.9 | 31.9 | 32.2 |
| 18 | 25.0 | 25.0 | 27.8 | 28.0 | 30.0 | 30.0 | 30.9 | 31.9 |
Abbreviations: CDC, Center for Disease Control; IOTF, International Obesity Task Force.
aIOTF criteria, defined to pass through body mass index 25 and 30 kg/m2 at age 18.
b CDC criteria, defined as BMI percentile ≥ 85th and 95th as overweight, and ≥ 95th as obesity.
| IOTF | CDC | REb | |||||
|---|---|---|---|---|---|---|---|
| Normal | Overweight | Obese | Normal | Overweight | Obese | ||
| FPG (mg/dL) | |||||||
| Mean (SD) | 92.8 (6.9) | 94.4 (7.4) | 94.9 (6.1) | 93.1 (7.1) | 94.6 (6.3) | 97.2 (6.6) | |
| β | 1 | 1.64a | 2.11a | 1 | 1.44 | 3.97a | |
| SE | 0.60 | 0.82 | 0.82 | 1.37 | 0.43 | ||
| AIC | 2935.02 | 2935.86 | |||||
| TC (mg/dL) | |||||||
| Mean (SD) | 152 (28.5) | 161.5 (30.8) | 167.2 (31.6) | 154.3 (28.7) | 164.01 (35.2) | 176.4 (30.8) | |
| β | 1 | 9.49a | 15.23a | 1 | 9.74a | 22.13a | |
| SE | 2.51 | 3.45 | 3.47 | 5.81 | 0.42 | ||
| AIC | 5103.46 | 5110.22 | |||||
| TG (mg/dL) | |||||||
| Mean (SD) | 78.8 (35.6) | 102.9 (56.3) | 123.6 (57.9) | 84.5 (42.2) | 119.2 (61.4) | 134.9 (58.5) | |
| β | 1 | 24.16a | 44.8a | 1 | 34.68a | 50.37a | |
| SE | 3.81 | 5.23 | 5.31 | 8.89 | 0.42 | ||
| AIC | 5729.73 | 5752.29 | |||||
| HDL-C (mg/dL) | |||||||
| Mean (SD) | 53.1 (11.6) | 48.8 (10.7) | 46.2 (9.6) | 52.1 (11.5) | 46.6 (10.0) | 44.5 (7.5) | |
| β | 1 | -4.22a | -6.84a | 1 | -5.47a | -7.60a | |
| SE | 0.95 | 1.31 | 1.32 | 2.21 | 0.42 | ||
| AIC | 3642.72 | 3653.94 | |||||
| LDL-C (mg/dL) | |||||||
| Mean (SD) | 83.1 (24.5) | 92.01 (27) | 96.2 (27.0) | 85.3 (24.6) | 93.6 (33.1) | 105 (23.5) | |
| β | 1 | 8.88a | 13.12a | 1 | 8.27a | 19.65a | |
| SE | 2.17 | 2.98 | 3 | 5.02 | 0.42 | ||
| AIC | 4883.01 | 4891.07 | |||||
| WC (cm) | |||||||
| Mean (SD) | 66.3 (10.0) | 82.02 (11.7) | 91.9 (14.2) | 70.2 (12.2) | 89.3 (13.2) | 97.5 (14.2) | |
| β | 1 | 16.05a | 26.1a | 1 | 19.14a | 27.32a | |
| SE | 0.93 | 1.28 | 1.47 | 2.40 | 0.34 | ||
| AIC | 3757.46 | 3956.13 | |||||
| SBP (mmHg) | |||||||
| Mean (SD) | 98.5 (11.9) | 104.6 (11.9) | 114.3 (13.8) | 99.9 (11.9) | 113.7 (15.2) | 113.3 (10.3) | |
| β | 1 | 6.41a | 16.19a | 1 | 13.78a | 14.17a | |
| SE | 1.02 | 1.40 | 1.43 | 2.34 | 0.42 | ||
| AIC | 3891.18 | 3914.06 | |||||
| DBP (mmHg) | |||||||
| Mean (SD) | 64.7 (11.2) | 66.8 (10.9) | 73.6 (12.04) | 65.3 (11.1) | 71 (12.5) | 75.3 (11.7) | |
| β | 1 | 2.40a | 9.16a | 1 | 5.79a | 9.97a | |
| SE | 0.95 | 1.31 | 1.33 | 2.16 | 0.42 | ||
| AIC | 3782.25 | 3794.01 | |||||
Abbreviations: AIC, Akaike’s information criterion; CDC, center for disease control; DBP, diastolic blood pressure; FPG, fasting plasma glucose; HDL-C, high-density-lipoprotein; IOTF, international obesity task force; LDL-C, low-density-lipoprotein; RE, relative efficiency; SBP, systolic blood pressure; SE, squared error; TC, total cholesterol; TG, triglycerides; WC, waist circumference.
a P-value < 0.05 demonstrate significancy.
b RE < 1 indicates better discrimination ability of IOTF compared to CDC for detecting dependent variable.
| IOTF | CDC | REb | |||||
|---|---|---|---|---|---|---|---|
| Normal | Overweight | Obese | Normal | Overweight | Obese | ||
| FPG (mg/dL) | |||||||
| Mean (SD) | 90.4 (7.1) | 93.2 (7.1) | 91.9 (8.5) | 90.9 (7.2) | 93.4 (7.1) | 91.03 (8.3) | |
| β | 1 | 2.81a | 1.49 | 1 | 2.51a | 0.168 | |
| SE | 0.65 | 1.09 | 0.897 | 1.28 | 0.67 | ||
| AIC | 2836.73 | 2845.62 | |||||
| TC (mg/dL) | |||||||
| Mean (SD) | 155.9 (26.8) | 162.3 (30.2) | 171 (24.3) | 157.1 (27.6) | 163.4 (27.8) | 168.6 (28.2) | |
| β | 1 | 6.94a | 15.19a | 1 | 6.26 | 11.49a | |
| SE | 2.51 | 4.16 | 3.42 | 4.87 | 0.68 | ||
| AIC | 4766.02 | 4776.22 | |||||
| TG (mg/dL) | |||||||
| Mean (SD) | 82.8 (34.9) | 104.3 (45.4) | 129.8 (57.9) | 85.8 (37.9) | 114.8 (50.2) | 125.4 (49.3) | |
| β | 1 | 23.99a | 46.95a | 1 | 28.3a | 38.9a | |
| SE | 3.82 | 6.33 | 7.03 | 4.94 | 0.67 | ||
| AIC | 5367.93 | 5397.01 | |||||
| HDL-C (mg/dL) | |||||||
| Mean (SD) | 53.1 (10.9) | 47.1 (9.8) | 44.6 (8.8) | 52.3 (10.9) | 45.4 (9.3) | 44.5 (8.6) | |
| β | 1 | -6.17a | -8.47a | 1 | -6.80a | -7.7a | |
| SE | 0.96 | 1.59 | 1.33 | 1.89 | 0.67 | ||
| AIC | 3391.82 | 3411.34 | |||||
| LDL-C (mg/dL) | |||||||
| Mean (SD) | 86 (24.1) | 94.3 (26.2) | 100.4 (23.6) | 87.5 (24.7) | 95 (24.6) | 99 (26.6) | |
| β | 1 | 8.46a | 14.52a | 1 | 7.58a | 11.58a | |
| SE | 2.24 | 3.71 | 3.07 | 4.37 | 0.67 | ||
| AIC | 4588.71 | 4602.08 | |||||
| WC (cm) | |||||||
| Mean (SD) | 66.3 (10.1) | 79.1 (9.6) | 88 (12.2) | 68.1 (10.8) | 82 (10.2) | 90.3 (10.5) | |
| β | 1 | 12.56a | 21.69a | 1 | 13.63a | 22.48a | |
| SE | 0.92 | 1.52 | 1.31 | 1.89 | 0.61 | ||
| AIC | 3421.18 | 3500.9 | |||||
| SBP (mmHg) | |||||||
| Mean (SD) | 96.4 (10.9) | 102.6 (9.9) | 104.4 (13.9) | 97.5 (10.9) | 103.5 (12.2) | 103.1 (11.6) | |
| β | 1 | 6.18a | 7.97a | 1 | 5.99a | 5.64a | |
| SE | 0.996 | 1.65 | 1.35 | 1.96 | 0.66 | ||
| AIC | 3527.63 | 3554.02 | |||||
| DBP (mmHg) | |||||||
| Mean (SD) | 64.1 (10.5) | 66.9 (11.1) | 71.7 (10.7) | 64.7 (10.7) | 66.5 (11.8) | 71.9 (8.9) | |
| β | 1 | 2.92a | 7.33a | 1 | 1.75 | 7.31a | |
| SE | 0.97 | 1.61 | 1.32 | 1.91 | 0.68 | ||
| AIC | 3506.5 | 3517.02 | |||||
Abbreviations: AIC, Akaike’s information criterion; CDC, center for disease control; DBP, diastolic blood pressure; FPG, fasting plasma glucose; HDL-C, high-density-lipoprotein; IOTF, international obesity task force; LDL-C, low-density-lipoprotein; RE, relative efficiency; SBP, systolic blood pressure; SE, squared error; TC, total cholesterol; TG, triglycerides; ; WC, waist circumference.
a P-value < 0.05 demonstrate significancy.
b RE < 1 indicates better discrimination ability of IOTF compared to CDC for detecting dependent variable.