
1. Background
2. Objectives
3. Methods
3.1. Statistical Analysis
4. Results
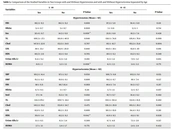
| Overweight (n = 10) | Obese (n = 84) | Morbidly Obese (n = 18) | Control (n = 35) | P | |
|---|---|---|---|---|---|
| Male/female, n | 5/5 | 36/48 | 8/10 | 21/14 | 0.387 |
| Age (y) | 10.79 ± 1.20 | 10.15 ± 1.55 | 10.98 ± 1.62 | 9.84 ± 2.88 | 0.499 |
| Puberty (pre/pub-post) | 3/7 | 19/65 | 4/14 | 23/12 | 0.866 |
| Height SDS | 145.14 ± 10.57 | 147.08 ± 10.33 | 140.48 ± 5.76 | 136.76 ± 16.08 | 0.036 |
| Weight (kg) | 49.83 ± 9.62 | 62.37 ± 14.53 | 69.96 ± 11.43 | 32.2 ± 9.65 | 0.000 |
| BMI (kg m-2) | 23.31 ± 1.77 | 28.95 ± 3.43 | 35.26 ± 3.99 | 17.06 ± 2.18 | 0.000 |
| BMI z-score | 1.51 ± 0.28 | 2.56 ± 0.36 | 3.62 ± 0.13 | –0.22 ± 0.99 | 0.000 |
| LBM (kg) | 37.59 ± 6.63 | 43.84 ± 8.63 | 45.64 ± 5.89 | 28.22 ± 8.3 | 0.000 |
| BSA (m2) | 1.43 ± 0.19 | 1.61 ± 0.24 | 1.69 ± 0.17 | 1.13 ± 0.25 | 0.000 |
| IBW (kg) | 25.04 ± 2.21 | 25.78 ± 3.47 | 24.04 ± 2.44 | 24.39 ± 5.74 | 0.546 |
| BSA IBW (m2) | 0.99 ± 0.06 | 1.01 ± 0.1 | 0.95 ± 0.06 | 0.95 ± 0.16 | 0.294 |
| SBP (mmHg) | 109.33 ± 9.83 | 117.09 ± 8.13 | 118.5 ± 4.2 | 89 ± 9.84 | 0.000 |
| DBP (mmHg) | 66.83 ± 3.82 | 74.3 ± 10.61 | 74.75 ± 5.74 | 55.71 ± 5.17 | 0.000 |
| Hypertension, n (%) | 2 (20) | 37 (44) | 12 (66) | 0 (0) | 0.000 |
| Fasting glycemia (mg dL-1) | 87 ± 6.3 | 87.82 ± 9.04 | 83.6 ± 5.5 | - | 0.580 |
| HbA1c (%) | 5.85 ± 0.78 | 5.63 ± 0.93 | 5.4 ± 0.36 | - | 0.940 |
| Fasting insulin (uIU mL-1) | 12.91 ± 9.3 | 15.55 ± 9.3 | 21.57 ± 12.87 | - | 0.461 |
| Total cholesterol (mg dL-1) | 157.1 ± 21.52 | 160.59 ± 32.16 | 190.25 ± 61.77 | - | 0.242 |
| HDL- cholesterol (mg dL-1) | 47.2 ± 7.83 | 44.08 ± 8.77 | 51.2 ± 13.54 | - | 0.231 |
| Triglycerides (mg dL-1) | 156.4 ± 90.11 | 138.54 ± 60.85 | 125.4 ± 70.96 | - | 0.845 |
| TSH (uIU mL-1) | 1.8 ± 1.14 | 3.02 ± 1.54 | 3.28 ± 1.02 | - | 0.155 |
| FT4 (ng dL-1) | 0.88 ± 0.1 | 0.94 ± 0.43 | 0.83 ± 0.1 | - | 0.809 |
| Metabolic syndrome, n (%) | 1 (10) | 16 (19) | 2 (11) | 0 (0) | 0.644 |
Abbreviations: BMI, body mass index; BMI z-score, standard deviation score of body mass index; BSA IBW, body surface area calculated using each participant’s ideal body weight; BSA, body surface area; DBP, diastolic blood pressure; FT4, free thyroxine; HbA1c, glycosylated hemoglobin; HDL, high-density lipoprotein; IBW, ideal body weight; LBM, lean body mass; SBP, systolic blood pressure; SDS, Standard deviation score; TSH, thyroid-stimulating hormone.
a Statistical significance: P < 0.05.
). Whiskers above and below the box indicate the location of the minimum and maximum.")
Creatinine and 24-hour protein values according to subgroups. A, creatinine values in all the obese patients and controls; B, 24-hour protein values in all the obese patients and controls; C, creatinine values in the obese patients with MS, obese patients without MS, and the control group; D, 24-hour protein values in the obese patients with MS, obese patients without MS, and the control group (the line inside the rectangle shows the median and the box limits correspond to the interquartile range (the first and the third quartile)). Whiskers above and below the box indicate the location of the minimum and maximum.
| GFR Estimating Formulas | All Obese Patients (n = 112) | Obese Patients with MS (n = 19) | Obese Patients Without MS (n = 93) | Controls (n = 35) | P |
|---|---|---|---|---|---|
| GFR based on creatinine | |||||
| Leger | 115.4 ± 19.98 | 132.56 ± 25.87 | 112.35 ± 17.38 | 89.33 ± 20.94 | 0.000, 0.000 |
| LBM-adjusted GFR via Leger | 97.17 ± 14.66 | 110.14 ± 18.57 | 94.86 ± 12.77 | 83.55 ± 18.92 | 0.000, 0.000 |
| IBW-adjusted GFR via Leger | 79.59 ± 10.55 | 88.45 ± 12.16 | 78.01 ± 9.55 | 79.55 ± 17 | 0.989, 0.126 |
| BSA- adjusted GFR via Leger | 72.55 ± 8.28 | 75.36 ± 6.31 | 72.06 ± 8.55 | 80.06 ± 13 | 0.001, 0.004 |
| BSA-IBW-adjusted GFR via Leger | 115.37 ± 15.17 | 124.09 ± 14.95 | 113.82 ± 14.83 | 93.89 ± 14.12 | 0.000, 0.000 |
| Schwartz | 94.8 ± 10.42 | 100.85 ± 9.56 | 93.73 ± 10.29 | 98.13 ± 15.22 | 0.226, 0.161 |
| GFR based on Cys-C | |||||
| Filler | 142.67 ± 25.8 | 158.83 ± 31.54 | 139.8 ± 23.92 | 145.94 ± 20.5 | 0.530, 0.091 |
| Zappitelli | 120.55 ± 22.71 | 134.82 ± 27.84 | 118.01 ± 21.04 | 123.39 ± 18.05 | 0.534, 0.090 |
| GFR based on creatinine and Cys-C | |||||
| CKID | 101.72 ± 9.97 | 110.69 ± 9.93 | 100.13 ± 9.19 | 104.02 ± 12.39 | 0.399, 0.025 |
| Zappitelli | 74.80 ± 9.93 | 80.23 ± 10.11 | 73.83 ± 9.69 | 79.78 ± 11.45 | 0.032, 0.029 |
| BMI-adjusted GFR via CKID | 3.6 ± 0.58 | 3.74 ± 0.55 | 3.58 ± 0.59 | 6.21 ± 1.21 | 0.000, 0.000 |
| BMI-adjusted GFR via Zappitelli | 2.65 ± 0.54 | 2.71 ± 0.48 | 2.64 ± 0.55 | 4.78 ± 1.1 | 0.000, 0.000 |
| BSA-adjusted GFR via CKID | 65.07 ± 10.91 | 64.24 ± 11.19 | 65.21 ± 10.99 | 96.22 ± 22.63 | 0.000, 0.000 |
| BSA-adjusted GFR via Zappitelli | 48.21 ± 11.16 | 46.6 ± 9.31 | 48.50 ± 11.53 | 75.03 ± 22.86 | 0.000, 0.000 |
| LBM-adjusted GFR via CKID | 2.44 ± 0.51 | 2.33 ± 0.49 | 2.46 ± 0.52 | 3.97 ± 1.17 | 0.000, 0.000 |
| LBM-adjusted GFR via Zappitelli | 1.81 ± 0.5 | 1.69 ± 0.39 | 1.83 ± 0.52 | 3.11 ± 1.13 | 0.000, 0.000 |
| IBW-adjusted GFR via CKID | 4.04 ± 0.61 | 4.04 ± 0.59 | 4.05 ± 0.62 | 4.46 ± 1.01 | 0.019, 0.065 |
| IBW-adjusted GFR via Zappitelli | 2.99 ± 0.62 | 2.93 ± 0.52 | 3.00 ± 0.64 | 3.49 ± 1.06 | 0.006, 0.026 |
| BSA-IBW-adjusted GFR via CKID | 102.66 ± 13.24 | 104.86 ± 13.49 | 102.26 ± 13.31 | 111.88 ± 20.51 | 0.012, 0.039 |
| BSA-IBW-adjusted GFR via Zappitelli | 75.8 ± 13.87 | 76.06 ± 12.28 | 75.75 ± 14.26 | 87.07 ± 22.67 | 0.004, 0.019 |
Abbreviations: CKID, chronic kidney disease in children; GFR, glomerular filtration rate.
a Adjusted GFR values for each size descriptor were measured by dividing the absolute GFR by the frequency of the size descriptor in each participant.
b Statistical significance P < 0.05.