
Introduction
Experimental
Results
Discussion
| Newly diagnosed AML patient (n = 7) | |
|---|---|
| Median Age (years) | 56 (Range, 33–74) |
| FAB classification | |
| M1 | 2 |
| Blast present (%) | 47 (Range, 29-63) |
| WBC count (µL) | 17300 × 103 (4600-31200) |
| Relapsed diagnosed AML patient (n = 4) | |
| Median Age (years) | 44 (Range, 9–74) |
| FAB classification | |
| M1 | 1 |
| Blast present (%) | 31 (Range, 14-58) |
| WBC count (µL) | 10700 × 103 (5100-18100) |
| Healthy subjects (n = 10) | |
| Median Age (years) | 49 (Range 17-69) |
| WBC count (µL) | 5100 × 103(3800-8600) |
| Gene | Primer sequence (5′ to 3′) | Primer length (bp) | Amplicon length (bp) |
|---|---|---|---|
| ABL | F: AGTCTCAGGATGCAGGTGCT | 20 | 124 |
| 20 | |||
| MRD1(ABCB1) | F:GAGGCCGCTGTTCGTTTCCT TTAGGTC | 26 | 102 |
| 25 | |||
| MRP1(ABCC1) | F: CGGATGTCATCTGAAATGGGA | 21 | 103 |
| 20 |
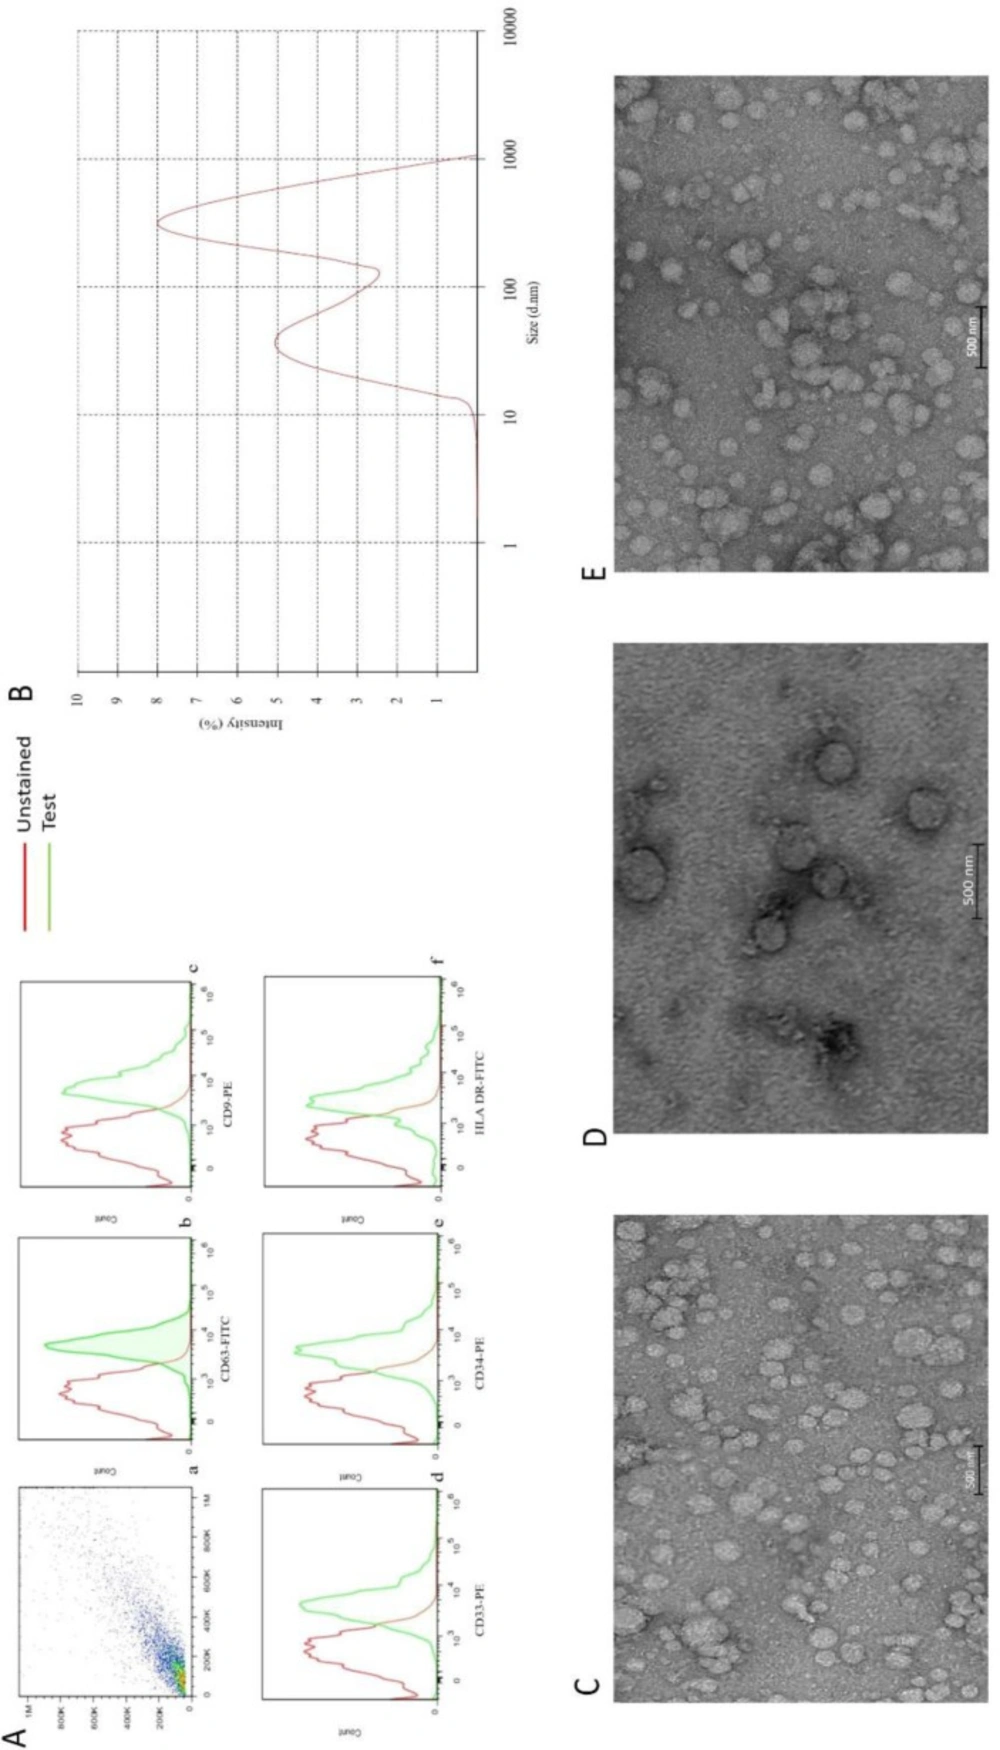
(A) a flow cytometry gate AML- EVs. Flow-cytometric analyses showed that the AML-EVs express CD63, CD9, CD33 CD34, and HLA DR (b, c, d, e, and f). (B) Measurement of the size range of EVs by DLS with the average size of 340 nm. (C, D, and E) TEM analyses of EVs, three groups of newly diagnosed patients, healthy subjects and relapsed patients, respectively
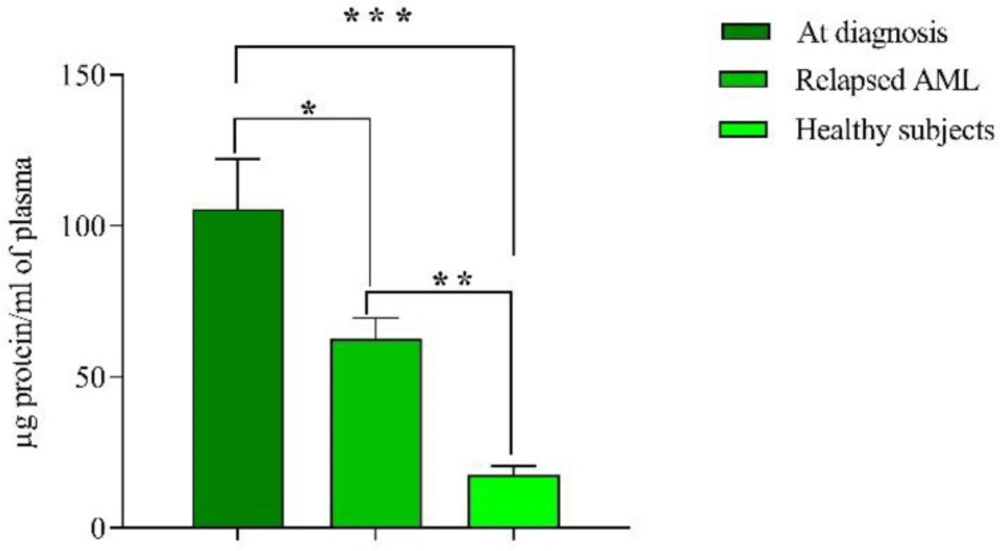
Mean protein content of EVs measured by Bradford method. Concentration of protein in new cases and relapsed groups were significantly higher than healthy subjects. Of note, the concentration of protein in new cases was also higher than relapsed cases. Data are mean ± SE of three independent experiments. Statistical significance was defined at *P < 0.05, **P < 0.01 and ***P < 0.001 compared to corresponding control
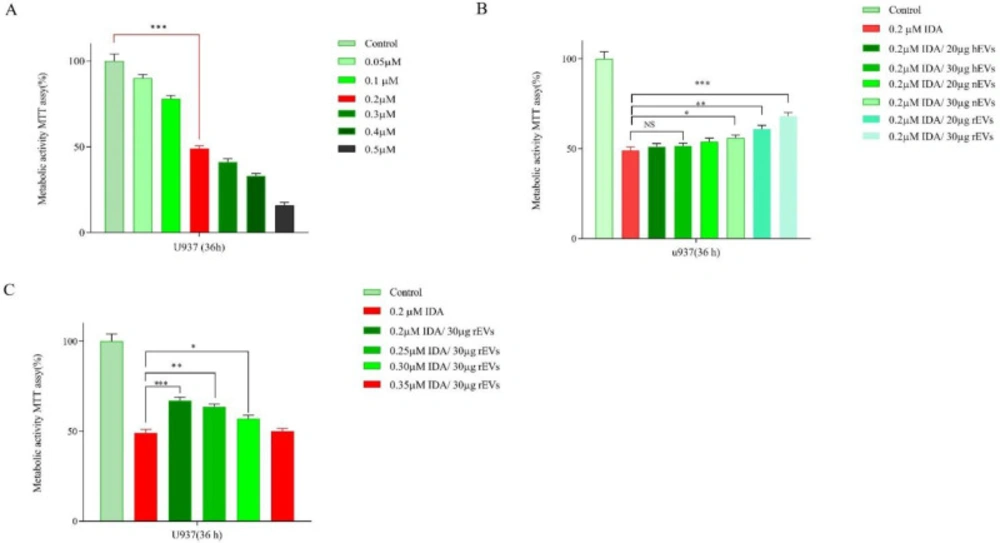
(A) Effects of IDA (0.05-0.5 μM) on the viability of U937 cells. The growth suppressive effect of IDA on U937 cells was assessed using MTT assay. IC50 pharmaceutical dose for U937 cells was 0.2 µM. (B) Data indicated that the anti-proliferative effects of IDA was attenuated in the presence of different AML-derived EVs. (C) When U937 cells were treated with relapsed AML-EVs (30 µg) in combination with IDA, there was a more significant elevation in the IC50 value of IDA. Data are mean ± SE of three independent experiments. Statistical significance was defined at *P < 0.05, **P < 0.01 and ***P < 0.001 compared to corresponding control
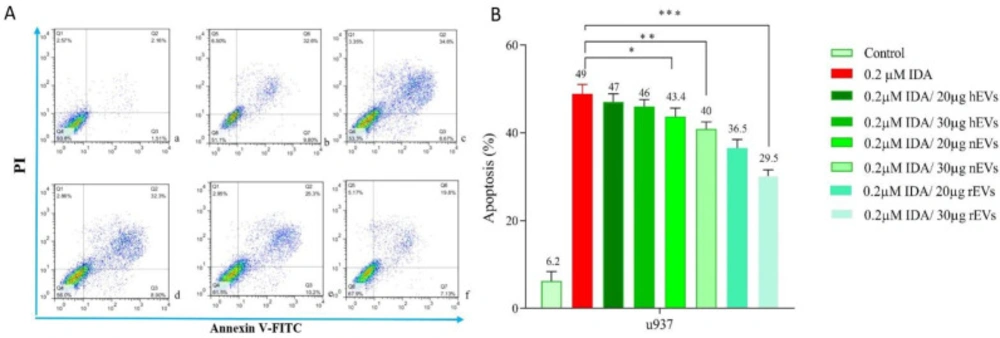
Effects of IDA on the induction of apoptosis in U937 cells. The cells were treated with 0.2 μM IDA and 20 and 30 µg of healthy, new case AML and relapsed AML-EVs respectively. Data are mean ± SE of three independent experiments. Statistical significance were defined at *P < 0.05, **P < 0.01 and ***P < 0.001compared to corresponding control
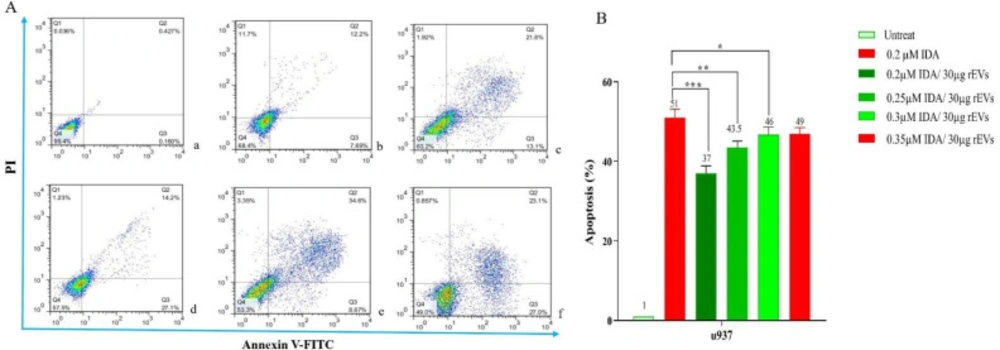
The result of annexin V/PI staining in EVs - or IDA+ 30 µg relapsed AML-EVs‐treated U937 during co-culture. Cells were treated for 36 h with either EVs (30 µg) or IDA+ EVs (30 µg). The relapsed AML-EVs protected the cells from IDA-induced apoptosis and enhanced the IDA IC50 in U937 cells (P < 0.001).
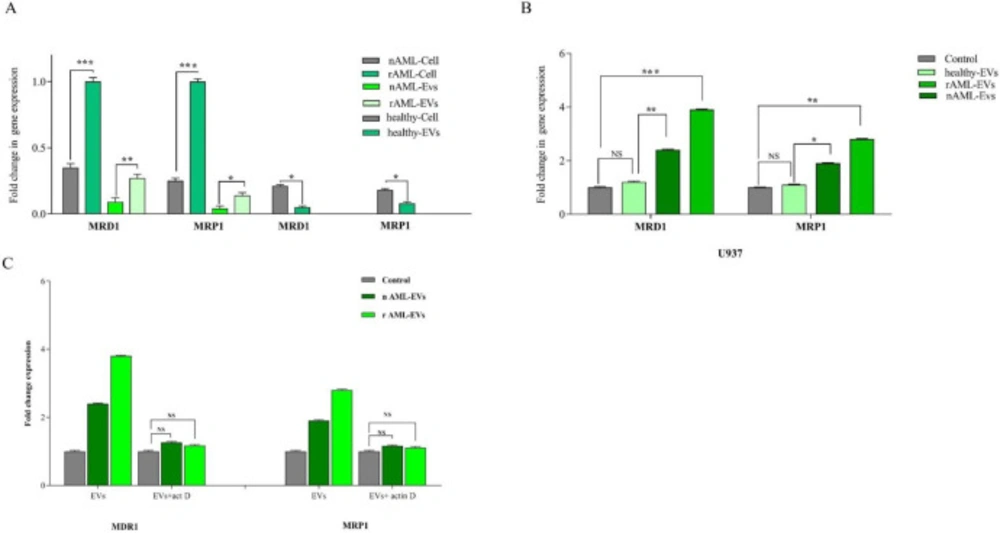
(A) MDR-1 and MRP1 expression in healthy, new case AML and relapsed AML-cells and correspond EVs. We first analyzed the normalized expression of MRD1 and MRP1 in cellular and vesicular compartment of all subjects. The resulting data showed that the expression of these genes were lower in EVs as compared with AML parent cells. In new cases and relapsed patients, the fold changes of both genes in EVs were increased. (B) The expression of MRD1 and MRP1in U937 cell treated with new cases and relapsed EVs were significantly increased. Data are mean ± SE of three independent experiments. (C) U937 cells was treated with actinomycin D (1 mg/mL) prior to EV incubation. After 24 h of EV integration, we did not observe any significant change in MDR-1 and MRP1 expression, indicating that the increase of these genes was not due to RNA transfer. Statistical significance were defined at *P < 0.05, **P < 0.01 and ***P < 0.001compared to corresponding control
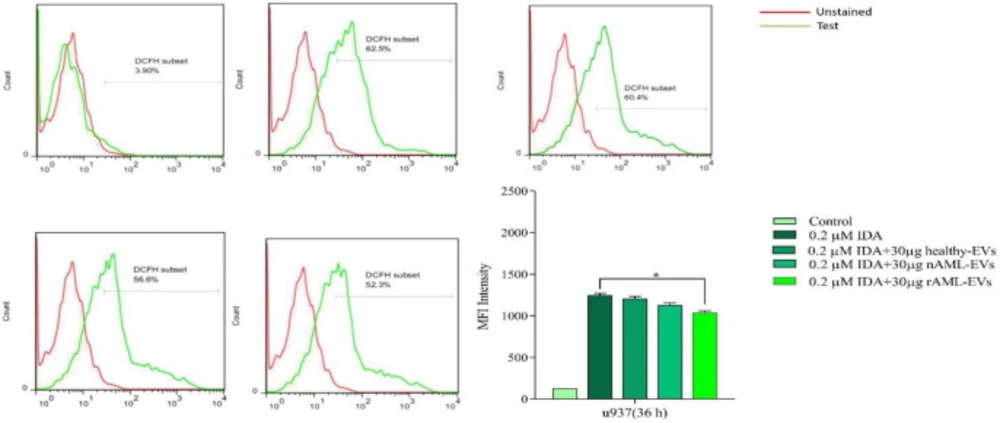
U937 cells were treated with or without 30 µg of healthy, new case AML and relapsed AML-EVs, and assayed for ROS production by using the fluorescent dye DCFDA. Representative histograms showed ROS generation in each experimental condition. Graph represented the mean values ± SE of the MFI of DCF. Statistical significance were defined at *P < 0.05


