

Introduction
Experimental
Results
Discussion
| Gene name | Primer pairs (5'-3') | GenBank Accession |
|---|---|---|
| β-actin | Forward-GTGACGTTGACATCCGTAAAGA | NM_007393 |
| Reverse-GCCGGACTCATCGTACTCC | ||
| NLRP3 | Forward-ATTACCCGCCCGAGAAAGG | NM_145827 |
| Reverse-CATGAGTGTGGCTAGATCCAAG | ||
| Caspase-1 | Forward-ACAAGGCACGGGACCTATG | NM_009807 |
| Reverse-TCCCAGTCAGTCCTGGAAATG | ||
| IL-18 | Forward-GTGAACCCCAGACCAGACTG | NM_008360 |
| Reverse-CCTGGAACACGTTTCTGAAAGA | ||
| IL-1β | Forward-GAAATGCCACCTTTTGACAGTG | NM_008361 |
| Reverse-TGGATGCTCTCATCAGGACAG | ||
| GSDMD | Forward-GTGTGTCAACCTGTCTATCAAGG | NM_026960 |
| Reverse-CATGGCATCGTAGAAGTGGAAG | ||
| Caspase-3 | Forward-CTCGCTCTGGTACGGATGTG | NM_009810 |
| Reverse-TCCCATAAATGACCCCTTCATCA | ||
| Caspase-8 | Forward-TGCTTGGACTACATCCCACAC | NM_009812 |
| Reverse-GTTGCAGTCTAGGAAGTTGACC | ||
| Caspase-9 | Forward-GGCTGTTAAACCCCTAGACCA | NM_015733 |
| Reverse-TGACGGGTCCAGCTTCACTA | ||
| BCL-2 | Forward-GCTACCGTCGTGACTTCGC | NM_177410 |
| Reverse-CCCCACCGAACTCAAAGAAGG |
| Group | BIOCHEMISTRY | ||||||||||
|---|---|---|---|---|---|---|---|---|---|---|---|
| AST(U/L) | ALT(U/L) | LDH(U/L) | CREA(mg/dL) | BUN(mg/dL) | S.TP(g/dL) | S.ALB(g/dL) | C.TP(g/dL) | C.ALB(g/dL) | CSF/SERA.TP | CSF/SERA.ALB | |
| Control | 88.24 ± 6.65 | 64.29 ± 21.43 | 225.54 ± 45.99 | 0.55 ± 0.18 | 20.50 ± 2.78 | 9.02 ± 0.40 | 3.20 ± 0.39 | 0.32 ± 0.04 | 0.26 ± 0.04 | 0.04 ± 0.01 | 0.08 ± 0.02 |
| TAA | 621.54 ± 217.02* | 498.25 ± 133.69* | 1653.12 ± 678.69* | 1.74 ± 0.28* | 66.94 ± 14.80* | 8.50 ± 0.85 | 2.53 ± 0.30 | 1.30 ± 0.61 | 0.66 ± 0.08* | 0.16 ± 0.07* | 0.26 ± 0.05* |
| TAA+Sch B | 416.20 ± 84.68 | 346.00 ± 233.46 | 834.17 ± 309.39# | 1.18 ± 0.33 # | 45.54 ± 12.15# | 8.33 ± 0.58 | 3.04 ± 0.33 | 1.15 ± 0.41 | 0.49 ± 0.11 | 0.14 ± 0.04 | 0.16 ± 0.02# |
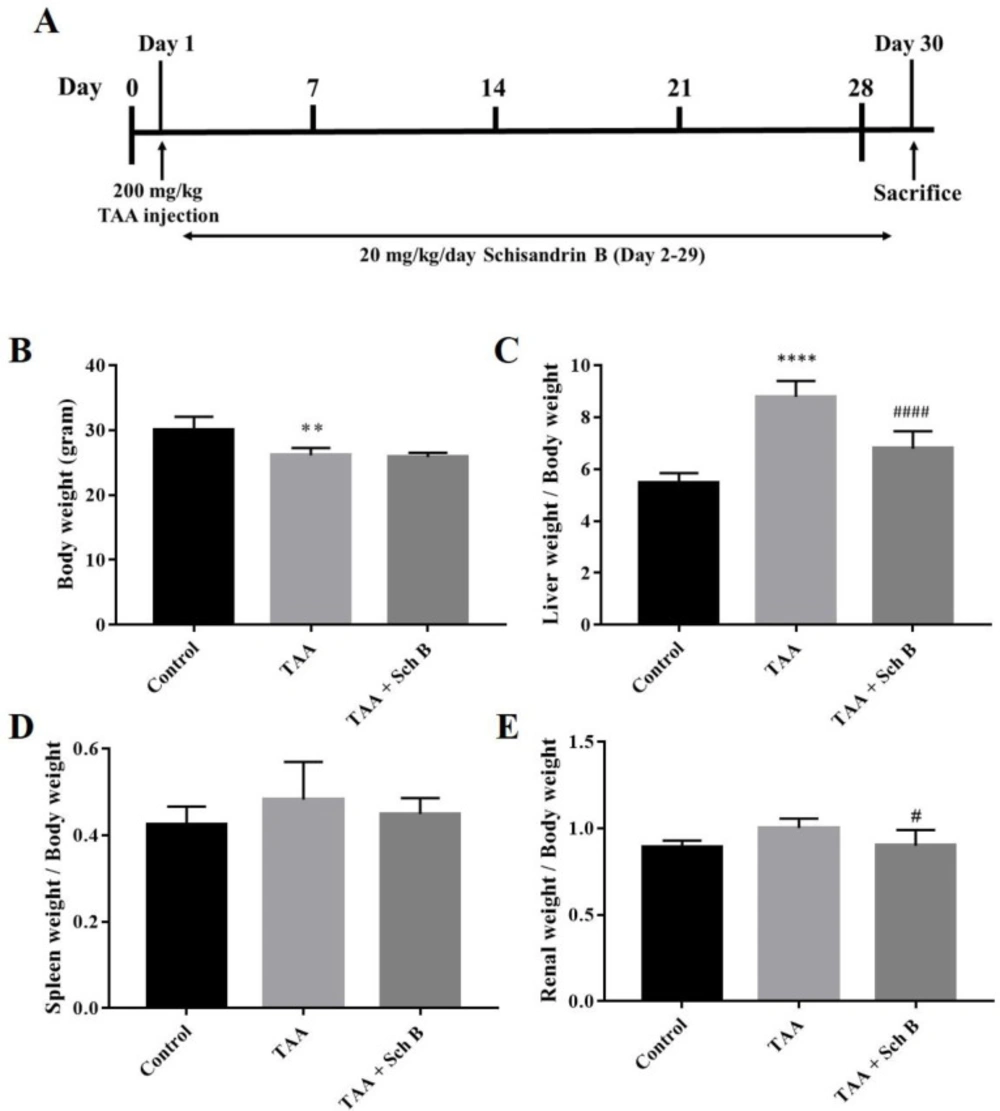
Treatment scheme of the study, body weight, and organs weight. (A) Mice were injected 200 mg/kg TAA intraperitoneally. One day later, mice were treated either with 20 mg/kg/day Sch B or olive oil (vehicle) for 28 consecutive days. (B) Body weight. (C-E) Liver, spleen, and kidney weight index. Results were expressed as mean ± SD (n = 10). *P-value < 0.05, ** P-value < 0.01, **** P-value < 0.0001 compared with control; ##P-value < 0.01, ####P-value < 0.0001 compared with TAA
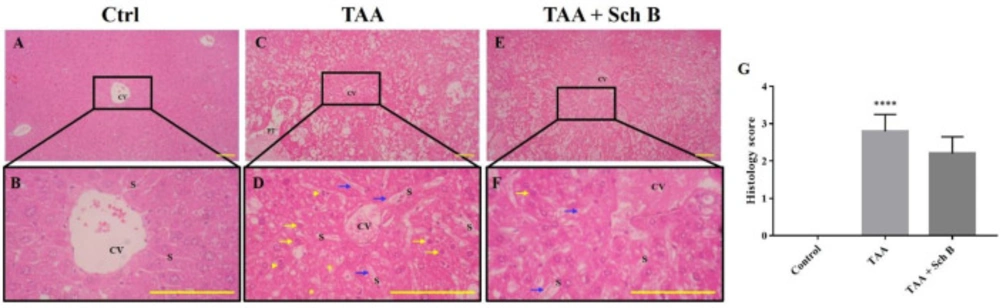
Histopathology of the liver. (A and B) Representative photomicrographs of H&E-stained liver sections from control mice showed normal hepatic architecture. (C and D) Liver sections from mice treated with TAA showed distorted hepatic architecture with congestion of the central vein. In addition, sinusoidal dilatation and congestion (blue arrows), ballooning degeneration (yellow asterisks), hepatocyte apoptosis or pyknosis (yellow arrows), and karyorrhexis (yellow arrowheads) were observed. (E and F) Liver sections from TAA-injected mice treated with Sch B showed fewer pathological hepatocytes and more healthy hepatocytes with normal histology. Images are shown at 40× and 100× magnifications; scale bars, 200 μm. CV, central veins; S, sinusoids; PT, portal triads. (G) Histology score of liver sections, shown as mean ± SD (n = 5). ****P-value < 0.0001 compared with control
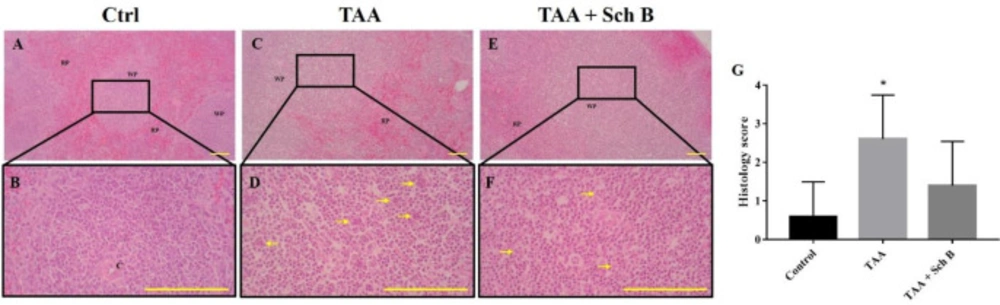
Histopathology of the spleen. (A and B) Representative photomicrographs of H&E-stained spleen sections from control mice. (C and D) Spleen sections from TAA-injected mice. White pulps and red pulps were distinguishable, but the junction was not clear. In addition, white pulps were not structurally organized. A moderate decrease of white pulp elements was noted, and tingible body macrophages containing apoptotic bodies (yellow arrowhead) were seen. (E and F) Spleen sections from TAA-injected mice treated with Sch B. Improved structure with fewer apoptotic bodies were seen. Images are shown at 40× and 100× magnifications; scale bars, 200 μm. RP, red pulps; WP, white pulps; C, central artery. (G) Histology score of spleen sections, shown as mean ± SD (n = 5). *P-value < 0.05 compared with control
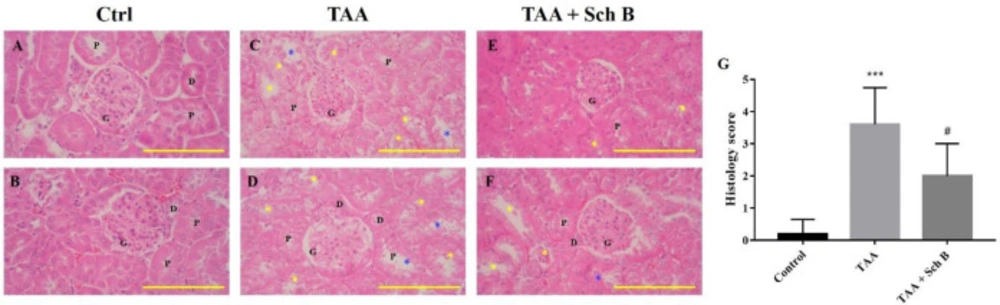
Histopathology of the kidney. (A and B) Two representative photomicrographs of H&E-stained kidney sections from control mice. (C and D) Kidney sections from TAA-injected mice. Degeneration of renal tubular (yellow asterisks) and desquamation (blue asterisks) were seen. (E and F) Kidney sections from TAA-injected mice following Sch B treatment. Fewer tubular degeneration and desquamation were seen. Images are shown at 100× magnifications; scale bars, 200 μm. G, glomeruli; P, proximal convoluted tubules; D, distal convoluted tubules. (G) Histology score of kidney sections, presented as mean ± SD (n = 5). ***P-value < 0.001 compared with control; #P-value < 0.05 compared with TAA
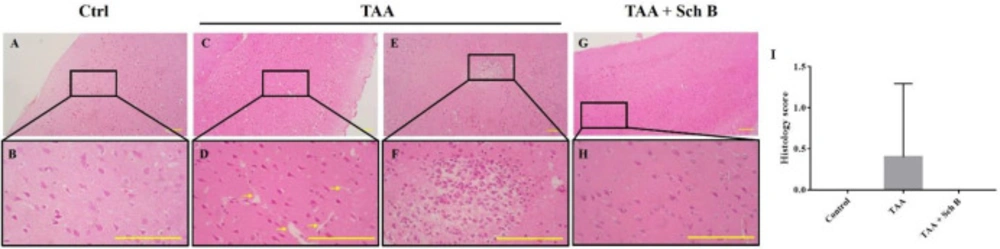
Histopathology of the brain. (A and B) Representative photomicrographs of H&E-stained brain sections from control mice. (C and F) Two representative photomicrographs of H&E-stained brain sections from TAA-intoxicated mice. (C and D) A mild increase of perivascular spaces was seen (yellow arrows). (E and F) One marked area of perivascular infiltration of macrophages and neutrophils was seen in one of the five sections. (G and H) Brain sections from Sch B treated mice. No specific pathological changes. Images are shown at 40× and 100× magnifications; scale bars, 200 μm. (I) Histology score of brain sections, presented as mean ± SD (n = 5).
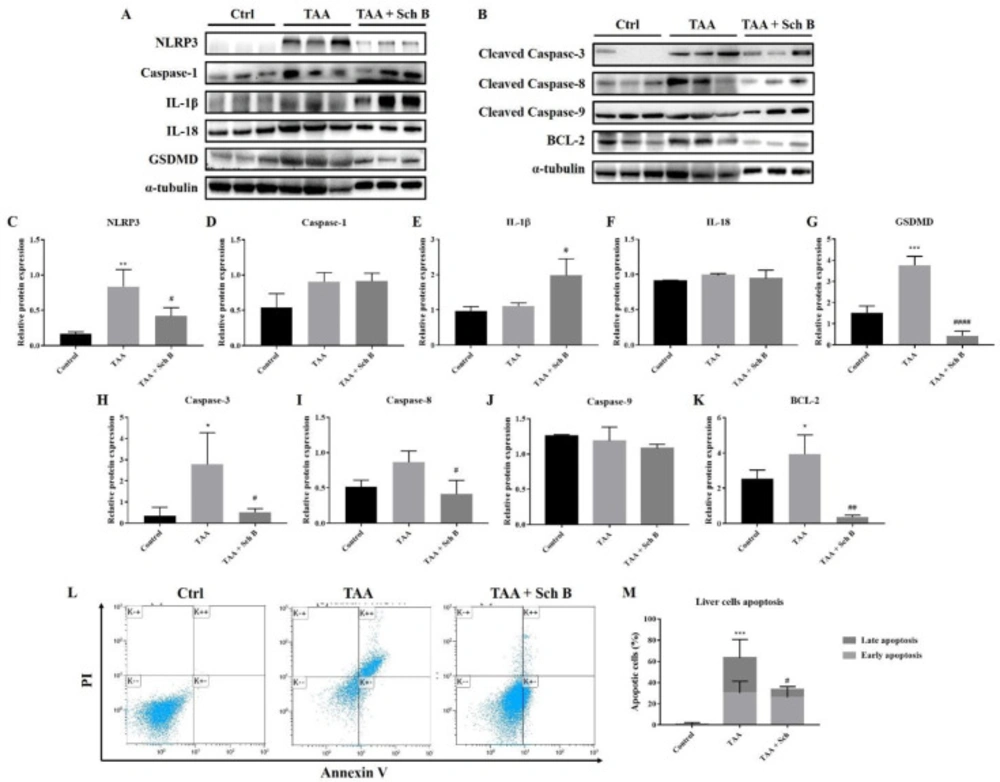
Analysis of inflammasome and apoptosis in the liver. (A) Western blot images showing inflammasome markers in the liver. (B) Western blot images showing apoptotic markers in the liver. (C-G) Protein expression levels of inflammasome markers. (H-K) Protein expression levels of apoptotic markers. Results are expressed as mean ± SD (n = 3). (L) Representative plots showing Annexin V-FITC/PI staining. Bottom left quadrant, viable cells; bottom right quadrant, early apoptotic cells; upper right quadrant, late apoptotic cells. (M) Percentages of apoptotic cells, shown as the mean ± SD (n = 5). *P-value < 0.05, **P-value < 0.01, ***P-value < 0.001 compared with control; #P-value < 0.05, ##P-value < 0.01, ####P-value < 0.0001 compared with TAA
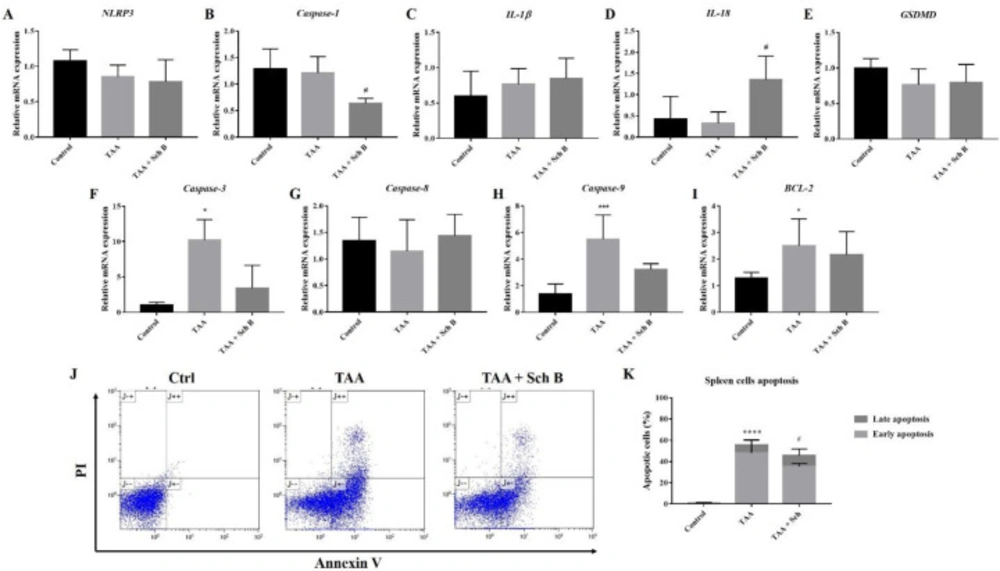
Analysis of inflammasome and apoptosis in the spleen. (A-E) Transcription levels of inflammasome markers in the spleen. (F-I) Transcription levels of apoptotic markers in the spleen. Results were presented as mean ± S.D. (n = 5). (J) Representative plots showing Annexin V-FITC/PI staining. (K) Percentages of apoptotic cells, shown as the mean ± SD (n = 5). *P-value < 0.05, ***P-value < 0.001, ****P-value < 0.0001 compared with control; #P-value < 0.05 compared with TAA
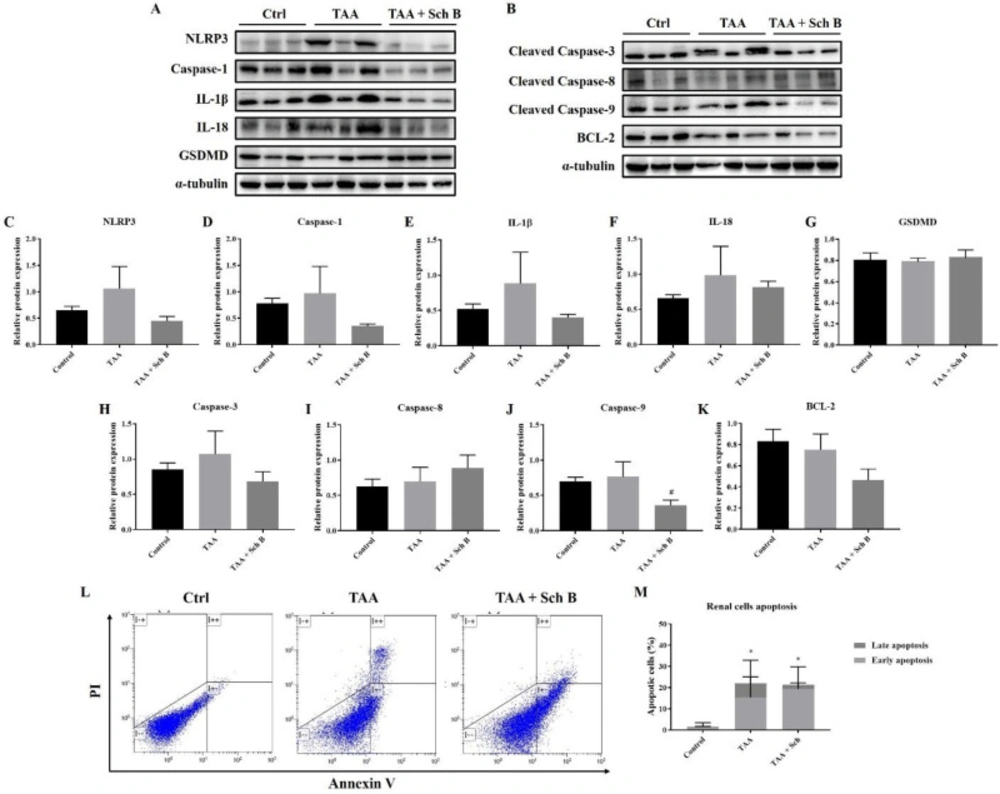
Analysis of inflammasome and apoptosis in the kidney. (A) Western blot images showing inflammasome markers in the kidney. (B) Western blot images showing apoptotic markers in the kidney. (C-G) Protein expression levels of inflammasome markers. (H-K) Protein expression levels of apoptotic markers. Results are presented as mean ± SD (n = 3). (L) Representative plots showing Annexin V-FITC/PI staining. (M) Percentages of apoptotic cells, shown as the mean ± SD (n = 5). *P-value < 0.05 compared with control; #P-value < 0.05 compared with TAA
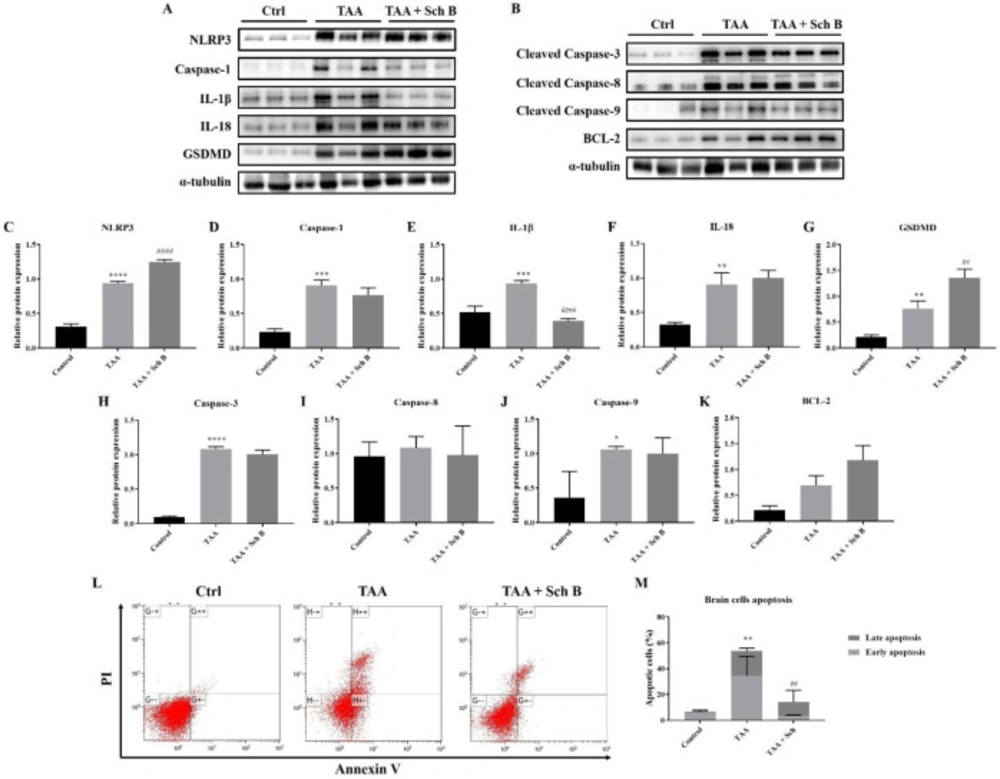
Analysis of inflammasome and apoptosis in the brain. (A) Western blot images showing inflammasome markers in the brain. (B) Western blot images showing apoptotic markers in the brain. (C-G) Protein expression levels of inflammasome markers. (H-K) Protein expression levels of apoptotic markers. Results are presented as mean ± SD (n = 3). (L) Representative plots showing Annexin V-FITC/PI staining. (M) Percentages of apoptotic cells, shown as the mean ± SD (n = 5). *P-value < 0.05, **P-value < 0.01, ***P-value < 0.001, ****P-value < 0.0001 compared with control; ##P-value < 0.01, ####P-value < 0.0001 compared with TAA
