

Introduction
The genus Artemisia, belonging to tribe Anthemideae (family Asteraceae), contains the well-known medicinal plants. Different species could be found in the temperate zone of Asia, Europe, and North America (1). About 34 Artemisia species have been identified in Iran (2). A. turanica Krasch. (locally named “Dermaneye Ghermez”) which grows naturally in the northeastern region of the country is one of these species (3). 1,8- cineole, chrysanthenone, and davanone have been reported as major constituents of the essential oil of the aerial parts while another study has shown a notable increase of α-thujone content in the leaf essential oil (4, 5). Methanolic extract of the aerial parts of the plant has been effective against BacillusSubtilis, Staphylococcus aureus and Pseudomonas aeruginosa (6). Moderate toxicity of crude hydroethanolic extract against HepG2 cell line as well as the moderate effect of the ethanolic extract on in-vitro leishmanicidal activity have been reported (7, 8). There are some reports on the antimalarial activity of A. turanica extracts as well (9-11). While the essential oil and different extracts of A. turanica have shown antioxidant and cytotoxic activity, a recent study has demonstrated the in-vitro neuroprotective potential of A. turanica (12-14). As per the previous reports enclosing the diverse beneficial effects of A. turanica, the authors have been stimulated to study the antioxidant effect of this species using different assays. To the best of our knowledge, although collectively these studies suggested the therapeutic benefits of this medicinal plant, there is no comprehensive study on the free radical scavenging and ferrous ion chelating activities of different extracts and fractions. This study aims to investigate the anti-oxidative role of different extracts/ fractions of A. turanica using different assays and examine whether their activity is correlated with the phenolic content. Another aim of the present work is to determine the structure of phytochemicals which are responsible for the observed effects.
Experimental
Chemicals
Gallic acid, Linoleic acid, sodium carbonate, ferrous chloride, dimethyl sulfoxide (DMSO), chloroform, ethylenediaminetetraacetic acid (EDTA), Tween® 40, Folin-Ciocalteu’s phenol reagent, butylated hydroxytoluene (BHT), LiChroprep® RP-18 (15-25 µm) were purchased from Merck. 1,1-diphenyl-2-picrylhydrazyl (DPPH) and β- Carotene were purchased from Sigma- Aldrich, ascorbic acid from VWR, ferrozine iron reagent from Acros Organics and all the solvents used for extraction and purification procedures were of gradient grade and purchased from Scharlau (Spain) and Caledon (Canada).
General experimental procedures
The chromatographic system for semi-preparative HPLC consisted of a binary pump YL 9111S, a PDA detector YL9160 and a VertiSep UPS C18 (250 × 30 mm i. d., 10 μm) column. An Ascentis® (250 ×10 mm i. d., 5 μm) column was replaced for final purification. NMR spectra were recorded on a Bruker AVANCE III 500 MHz spectrometer in dimethyl sulfoxide-d6 as the solvent and the residual solvent signal was used as internal standard. ESIMS data were obtained on an Esquire 3000 plus ion trap mass spectrometer (Bruker).
Plant material
Aerial parts of A. turanica Krasch were collected from Samie Abad, Torbat- e Jam (Razavi Khorasan province, northeast of Iran) in September 2010. The identity of the plant sample was confirmed by Dr. V. Mozaffarian (Research Institute of Forest and Rangelands, Tehran, Iran). Voucher number 12572 is retained in the herbarium, Department of Pharmacognosy, Faculty of Pharmacy, Mashhad University of Medical Sciences, Mashhad, Iran.
Preparation of extracts
Air-dried and ground aerial parts (200 g) of A. turanica were extracted with petroleum ether (40-60), dichloromethane, ethyl acetate, ethanol and ethanol-water (1:1 v/v), respectively (Sequential maceration with ca. 3 × 2 L of each solvent). The extracts were filtrated with filter paper and dried using rotary evaporator at reduced pressure at a temperature below 45 °C to yield 5.51, 24.23, 1.21, 7.78, and 37.50 g of each extract, respectively.
Chromatographic Fractionation and Isolation
Reversed-phase high performance liquid chromatography (RP-HPLC) is now commonly used for the separation of complex the mixtures of phenolic compounds and the other natural products (15). Fifteen grams of the hydroethanolic extract which exhibited better results in two different antioxidant assays was subjected to reversed-phase VLC using a step gradient of MeOH-H2O (0.5:9.5, 1:9, 2:8, 4:6, 6:4, 8:2, 10:0) to give seven fractions (A, B, C, D, E, F and G) respectively (Table 1). A portion (915 mg) of fraction D (eluted by 40% methanol in water) was re-fractionated by semi-preparative HPLC (mobile phase: 0–30 min, MeOH from 25 to 55% in H2O; 30–31 min MeOH from 55 to 100% in H2O; 31–35 min 100% MeOH, flow rate 8 mL/min) to yield six subfractions. Further purification of the subfraction4 (93.9 mg, tR = 20.4 min) by semi-preparative HPLC (mobile phase: 0–20 min, MeOH from 30 to 50% in H2O; 20–25 min 50% MeOH, 25–26 min MeOH from 50 to 100% in H2O; 26–30 min 100% MeOH, flow rate 3 mL/min) yielded compounds 1 (12.2 mg, tR = 16.6 min) and 2 (5.4 mg, tR = 20.4 min). The structures of isolated compounds were elucidated using spectroscopic analysis including ESIMS, 1H- and 2D-NMR.
Total phenolic contents
The total phenolic content (TPC) was measured by the Folin–Ciocalteu method with some modifications (16, 17). Different concentrations of samples in water (0.500 mL) were mixed with 2.5 mL of Folin- Ciocalteu reagent (0.2 N). Two mLof Na2CO3 solution (75 g/L) was added after 5 min. After 2 h standing in the dark, the optical density was measured at 760 nm against a blank. The total phenolic contents were calculated based on the calibration curve of gallic acid and expressed as milligrams of gallic acid equivalents (GAE), per gram of the dried samples.
DPPH radical scavenging activity
The assay was performed according to the method of Hatano et al. with slight modifications (18). Briefly, test samples were dissolved in methanol at different concentrations. Equal volumes of 0.2 mM solution of DPPH in methanol were added to each of the test tubes. The mixture was shaken vigorously and maintained in the dark for 30 min. Then, the absorbance was read at 517 nm against a blank. Butylated hydroxytoluene (BHT) and ascorbic acid were used as standard references. The scavenging activity was calculated using the formula:
I% = (Ac – A)/Ac × 100
Where Ac = absorbance of the control and A = absorbance of a tested sample in 30 min.
Metal chelating activity
The chelating activity of the extracts and fractions for ferrous ions Fe2+ was measured adopting the ferrous iron– ferrozine complex method with some modification (19). Briefly, 25 µL of FeCl2 solution (2 mM) was added to a mixture containing 2 mL of methanolic solution of test sample and 1.5 mL of H2O. The reaction was started by adding 50 µL of ferrozine solution (5 mM) to each test tube after 30 seconds. The mixtures were shaken well and incubated for 10 min at room temperature. The absorbance of the solution was then read at 562 nm. EDTA and quercetin were used as positive controls. The ability of the samples to chelate ferrous ion was calculated using the equation mentioned above for DPPH radical scavenging activity.
Inhibition of β-carotene bleaching
Antioxidant potential of the extracts and fractions was determined by a slightly modified version of the β-carotene bleaching method (20). Linoleic acid (33 µL) was added to 225 mg of Tween 40 and 750 µL of β-carotene solution (0.500 mg/mL). The solvent was completely removed using a rotary evaporator. After adding 75 mL of oxygenated distilled water, the mixture was emulsified for 15 min in a sonicator to give emulsion A. Aliquots of 3.5 mL of this emulsion were transferred into a series of stopper test tubes containing 1 mL of the samples dissolved in water or DMSO in different concentrations. Optical density (OD) at 470 nm was recorded for all the samples immediately (t = 0) and at the end of the assay time (t = 120). An emulsion which consisted of 50 mL of oxygenated water, 22 µL of linoleic acid and 150 mg of Tween 40 was also prepared to be used as the blank to zero the spectrophotometer. The percentage of inhibition was calculated according to the following formula:
I% = (AA (120) – AC (120))/(AC (0) – AC (120)) × 100
Where AA (120) is the absorbance of the sample at t = 120 min, AC (120) is the absorbance of the control at t = 120 min, and AC (0) is the absorbance of the control at t = 0 min.
Statistical analysis
All the experiments were performed in triplicate. The data were reported as mean ± standard deviation (SD) (n = 3) and evaluated by non- parametric Friedman test. The difference was considered to be statistically significant if P < 0.05. Pearson’s correlation coefficients (r) between the total phenolic contents of the samples and calculated EC50 values were determined in each antioxidant assay.
Results
Extraction and isolation
Fractionation of the hydroethanolic extract by a combination of VLC and semi-preparative HPLC on RP-18 afforded compounds 1 and 2 (Figure 1). The chemical structures of isolated compounds were elucidated unequivocally through ESIMS and NMR, and also all spectroscopic data were in agreement with previously published data (21-24).
Compound 1 (3,5- dicaffeoylquinic acid): brown powder. ESI-MS (m/z): 515.2 [M-H]-, 1031.5 [2M-H]-. 1H NMR (500 MHz, DMSO-d6) δ (ppm): 1.99- 2.15 (4H, m, H-2 and H-6), 3.84 (1H, m, H-4), 5.18 (1H, m, H-5), 5.22 (1H, m, H-3),6.18 (1H, d, J = 16.0 Hz, H-8”);6.25 (1H, d, J = 16.0 Hz, H-8’); 6.78 (1H, overlapping signals (ov), H-5”), 6.79 (1H, ov, H-5’), 6.98 (1H, ov, H-6”), 6.99 (1H, ov, H-6’),7.05 (1H, br s, H-2”), 7.06 (1H, br s, H-2’), 7.45 (1H, d, J = 16 Hz, H-7”), 7.49 (1H, d, J = 16 Hz, H-7’); 13C-NMR (data from HSQC and HMBC spectra, DMSO-d6) δ (ppm): 35.2 (C-2), 36.4 (C-6), 68.4 (C-4), 71.3 (C-3 and C-5), 72.4 (C-1), 114.9 (C-8”), 115.0 (C-2’), 115.1 (C-2”), 115.3 (C-8’), 116.2 (C- 5’ and C-5″), 121.6 (C-6′ and C-6”), 125.3 (C-1’), 125.5 (C-1”), 145.2 (C-7′ and C-7″), 145.6 (C-3′ and C-3″), 148.4 (C-4’), 148.6 (C-4”), 165.6 (C-9”), 166.2 (C-9’), unobserved signal (C-7).
Compound 2 (4, 5-dicaffeoylquinic acid): brown powder. ESI-MS (m/z): 515.2 [M-H]-, 1031.5 [2M-H]-. 1H NMR (500 MHz, DMSO-d6) δ (ppm): 2.00- 2.20 (4H, m, H-2 and H-6), 4.20 (1H, m, H-3), 4.97 (1H, m, H-4), 5.43 (1H, m, H-5), 6.14 (1H, d, J = 16.0 Hz, H-8”);6.23 (1H, d, J = 16.0 Hz, H-8’); 6.75 (2H, d, J = 7.6 Hz, H-5’ and H-5”), 6.95 (1H, ov, H-6”), 6.97 (1H, ov, H-6’), 7.02 (2H, br s, H-2’ and H-2”), 7.43 (1H, d, J = 16.0 Hz, H-7”), 7.48 (1H, d, J = 16.0 Hz, H-7’); 13C-NMR (data from HSQC and HMBC spectra, DMSO-d6) δ (ppm): 37.5 (C-2), 38.0 (C-6), 67.1 (C-3), 68.1 (C-5), 74.0 (C-4), 74.2 (C-1), 114.1 (C-8”), 114.4 (C-8’), 115.2 (C-2’ and C-2”), 115.9 (C- 5’ and C-5″), 121.7 (C- 6’ and C-6″), 125.6 (C-1’ and C-1”), 145.7(C-7′ and C-7″), 145.7 (C-3′ and C-3″), 148.5 (C-4’ and C-4”), 166.0 (C-9”), 166.4 (C-9’), unobserved signals (C-1 and C-7).
Total Phenolic Content
Regression equation of the calibration curve of gallic acid (R2 = 0.997, y = 0.011x + 0.057) was used to calculate the content of phenolics and expressed in GAE as milligrams per gram of each sample (mg GAE/g extract or fraction). Large variations in TPC of the samples were found, ranging from 24.36 ± 1.55 (fraction A) to 255.00 ± 10.29 (fraction D) mg GAE/g fraction (Table 1).
DPPH radical scavenging activity
All the samples except fraction A and three extracts (petroleum ether, dichloromethane, and ethyl acetate) showed moderate to strong scavenging activity on the DPPH radical. The highest activity was recorded for ethanolic extract, with the EC50 value of 18.31 ± 0.59 µg/mL, followed by the fraction F and hydroethanolic extract with the EC50 values of 18.43 ± 0.45 and 20.13 ± 1.07 µg/mL, respectively (Table 1).
Metal chelating activity
The highest ferrous ion chelating effect among the samples was shown by fraction B, with the EC50 value of 28.96 ± 3.23 µg/mL followed by hydroethanolic extract and fraction A with the EC50 values of 47.88 ± 4.72 µg/mL and 47.92 ± 19.35 µg/mL, respectively (Table 1). While fractions C to G had moderate activity, the other extracts did not show any remarkable color changes, although decreases in absorbance readings- except petroleum ether extract- were recorded.
Inhibition of β-carotene bleaching
Fraction D showed the best inhibitory performance in BCB assay, with an EC50 value of 4.92 ± 1.11 μg/mL while Fraction B (EC50= 98.17 ± 0.17 μg/mL) exhibited the lowest (Table 1).
Statistical analysis
Pearson’s correlation coefficients between TPC and calculated EC50 values for DPPH, FIC and BCB assays took the values of -0.531, -0.032, and -0.696, respectively. The lowest correlation was seen between the TPC of the samples and their ability to chelate ferrous ions. No significant correlation was observed between TPC and DPPH radical scavenging activities of the samples as well. The highest correlation between the results of BCB assay and total phenolic contents was observed. The results of Friedman test showed no significant difference in the assays in screening the samples for their antioxidant ability.
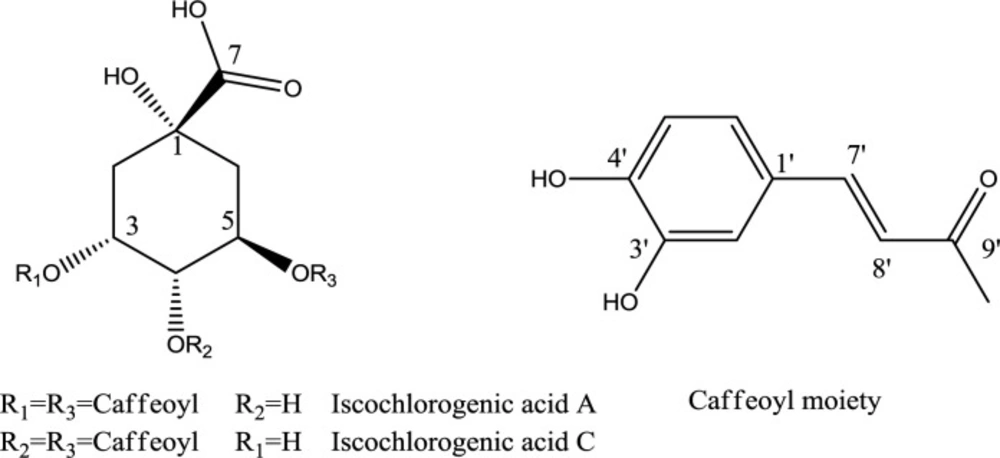
Figure 1
Chemical structures of isolated compounds
Table 1Antioxidant performance and total phenolic contents (TPC) of petroleum ether (PE), dichloromethane (DCM), ethyl acetate (EA), ethanol (EtOH) and ethanol/water (EtOH/Wt) extracts and different fractions (A-G) of the ethanol/water extract of A. turanica
| Sample | Extraction/ fractionation yield (g) | EC50(µg/ mL) | TPC | ||
|---|---|---|---|---|---|
| DPPH assay | FIC assay | BCB assay | |||
| PE | 5.51 | 355.74 ±132.85 | n.s. | 53.24 ± 2.93 | 43.64 ± 14.20 |
| DCM | 24.23 | 463.49 ± 117.26 | 585.11 ± 16.12 | 28.42 ±0.27 | 75.76 ± 11.22 |
| EA | 1.21 | 101.53 ± 15.95 | 916.34 ± 49.84 | 22.13 ± 6.03 | 106.67 ± 1.39 |
| EtOH | 7.78 | 18.31 ± 0.59 | 905.19 ± 340.13 | 11.29 ± 1.29 | 154.42 ± 3.03 |
| EtOH/Wt | 37.50 | 20.13 ± 1.07 | 47.88 ± 4.72 | 8.14 ± 1.92 | 136.00 ± 3.47 |
| Fr. A | 1.86 | 113.79 ± 16.17 | 47.92 ± 19.35 | 81.43 ± 13.67 | 24.36 ± 1.55 |
| Fr. B | 1.19 | 50.90 ± 4.85 | 28.96 ± 3.23 | 98.17 ± 0.17 | 77.58 ± 0.95 |
| Fr.C | 0.82 | 46.77 ± 4.94 | 65.86 ± 15.59 | 65.90 ± 1.83 | 98.94 ± 0.26 |
| Fr. D | 3.01 | 21.99 ± 1.82 | 118.36 ± 9.49 | 4.92 ± 1.11 | 255.00 ± 10.29 |
| Fr. E | 3.79 | 20.30 ± 3.34 | 53.33 ± 4.83 | 23.83 ± 0.07 | 169.85 ± 4.12 |
| Fr. F | 2.42 | 18.43 ± 0.45 | 80.91 ± 4.32 | 15.19± 3.41 | 148.48 ± 4.10 |
| Fr. G | 1.04 | 37.41 ± 1.74 | 194.76± 26.41 | 16.88 ± 2.54 | 104.24 ± 1.60 |
| BHT | --- | 4.96 ± 0.66 | --- | 0.469 ± 0.22 | --- |
| Vit C | --- | 4.74±0.19 | --- | --- | --- |
| EDTA | --- | --- | 18.94 ± 2.88 | --- | --- |
| Quercetin | --- | --- | 88.35 ± 4.09 | --- | --- |
Discussion
To the best of our knowledge, this is the first report on the presence of two dicaffeoylquinic acid isomers (isochlorogenic acids A and C) in A. turanica. The structures of the isolated compounds were elucidated by ESIMS, 1H-, and 2D-NMR. Both compounds showed the same pseudo-molecular-ion peak at m/z 515.2 ([M-H]-), in their ESI-MS, representing the molecular formula C25H24O12. The 1H NMR spectrum of the compounds revealed the presence of two caffeoyl moieties with trans-geometries of the double bonds (J = 16.0 Hz). The HMBC correlations between H-atoms of quinic acid (H-3, H-4, and H-5) and C-9’ or C-9” were used to determine the linkage positions of caffeoyl groups. The signals of the H-atoms (H-3, H-4, and H-5) in compound 1 were observed between 3.84 and 5.22 ppm, while the same H-atoms in compound 2 resonated between 4.20 and 5.43 ppm. The upfield protons in these areas were H-4 and H-3, in compounds 1 and 2, respectively. In comparison with the corresponding carbon atom in compound 1, a downfield shift was observed for C-2 in compound 2. These facts, along with the comparison of the rest of spectroscopic data with those reported in the literature, allowed identification of the compounds 1 and 2 as 3,5-di-O-caffeoylquinic acid (3,5-di-CQA), and 4,5-di-O-caffeoylquinic acid (4,5-di-CQA), respectively (21-24).
The compounds have been previously isolated from the other species in the genus Artemisia such as Artemisia capillaris, Artemisia ciniformis and Artemisia annua (25-27). The presence of these compounds in the genus Artemisia has led to valuable effects such as anti-giardial, anti-HBV and inhibition of various enzymes like natural protein tyrosine phosphatase 1B , α-Amylase and α-glucosidase and aldose reductase (28-32). In agreement with the results of the current study, the antioxidant activity of isomers of isochlorogenic acid has been reported in different species of Artemisia (33, 34). The results of the Friedman test were consistent with the previous reports for Artemisia biennis which suggests none of three antioxidant assays are significantly different in the selection of active extracts/fractions (35). In agreement with the previous reports, a significant correlation was observed between the results of the BCB assay and the total phenolic contents (35, 36). Because of the very low correlation observed between total phenolic content and FIC results, there should have been some other types of phytochemicals which act as secondary antioxidants in the assay. Nitrogen- containing compounds, terpenoids, and polysaccharide fractions as natural non-phenolic antioxidants are some examples which act with different mechanisms (37-41). More studies should be conducted to identify and characterize ferrous ion chelating agents of A. turanica.
Conclusion
This study demonstrated the radical scavenging activity of A. turanica, as one of the plant species of Iranian flora. In general, free radical scavenging activities of A. turanica hydroethanolic extract and some of its derived fractions in comparison with other samples could be ascribed to their higher content of phenolic compounds like dicaffeoylquinic acids which were isolated in this study.
