

Introduction
Experimental
Results
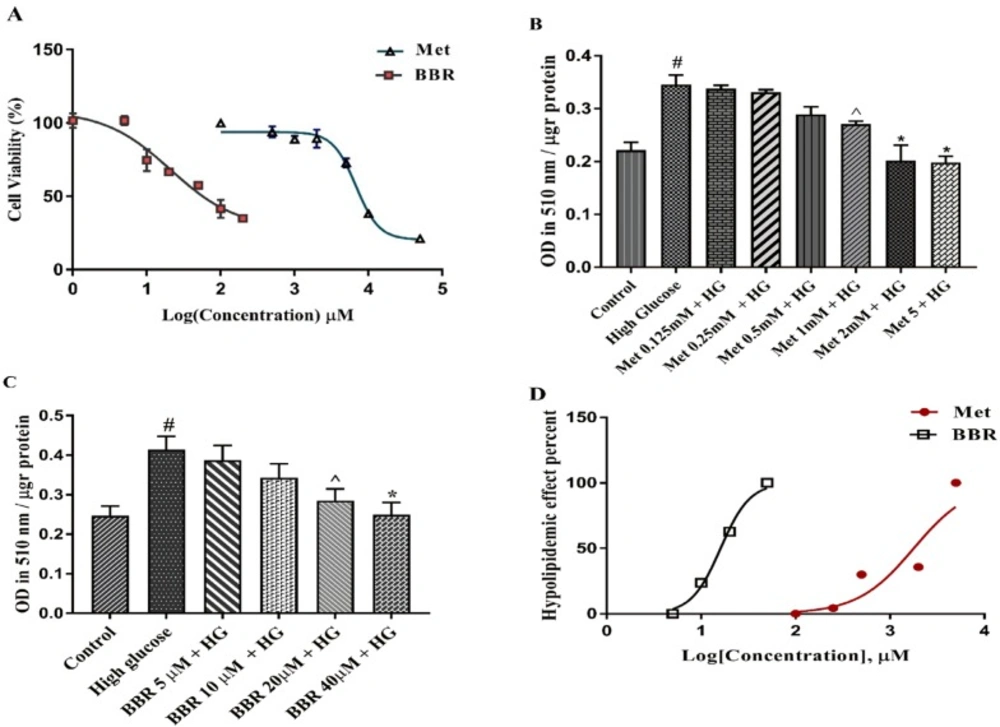
The cytotoxicity and lipid lowering effect of Metformin and berberine on HepG2 cells: (A) Cell growth activity was measured by MTT assay. IC50 of Metformin and berberine were 9.819 mM 65.83 μM, respectively. (B-C) Total lipid content of the cells treated by different concentrations of Metformin and berberine alone. Total lipid content was evaluated by Oil red O staining method. (D) EC50 for Metformin and berberine treatments were 1.786 mM and 16.07 μM, respectively. Represented data are from three independent experiments and are means ± SEM. #: Control vs. High glucose, *: Treatments vs. High Glucose with P < 0.001, ^: Treatments vs. High Glucose with P < 0.05. Control: D-mannitol (27.5 mM mannitol) in normal glucose (NG) (5.5 mM glucose); HG: High (33 mM glucose); Met: Metformin; BBR: Berberine
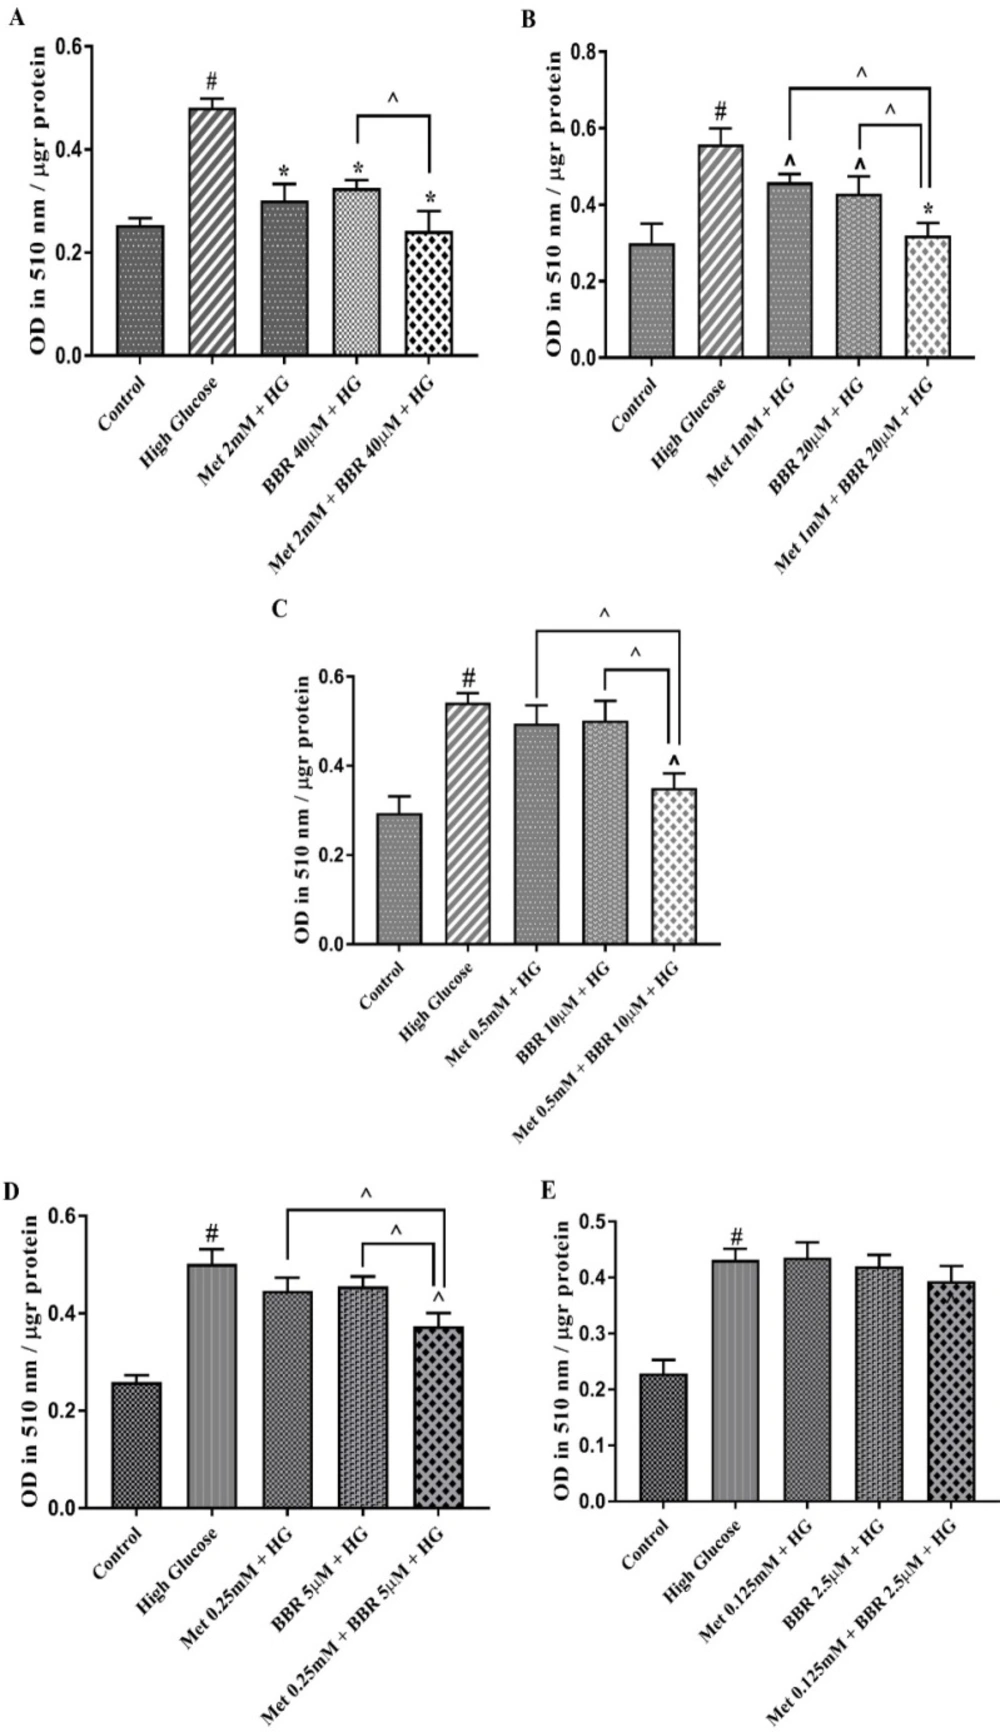
Total lipid content of the cells treated by Met, BBR, and Met + BBR. HepG2 cells were treated with a constant molar ration of 50:1 Metformin to berberine. Total lipid content was evaluated by Oil Red O staining method. (A) Metformin (mM) to berberine (µM) of 2:40, (B) Metformin (mM) to berberine (µM) of 1:20, (C) Metformin (mM) to berberine (µM) of 0.5:10, (D) Metformin (mM) to berberine (µM) of 0.25:5, (E) Metformin (mM) to berberine (µM) of 0.125:2.5. Represented data are from three independent experiments and are means ± SEM. #: Control vs. High glucose, *: Treatments vs. High Glucose with P < 0.001, ^: Treatments vs. High Glucose with P < 0.05. Control: D-mannitol (27.5 mM mannitol) in normal glucose (NG) (5.5 mM glucose); HG: High Glucose (33 mM glucose); Met: Metformin, and BBR: Berberine. ^: Metformin and berberine alone vs. combination treatment (Met + BBR)
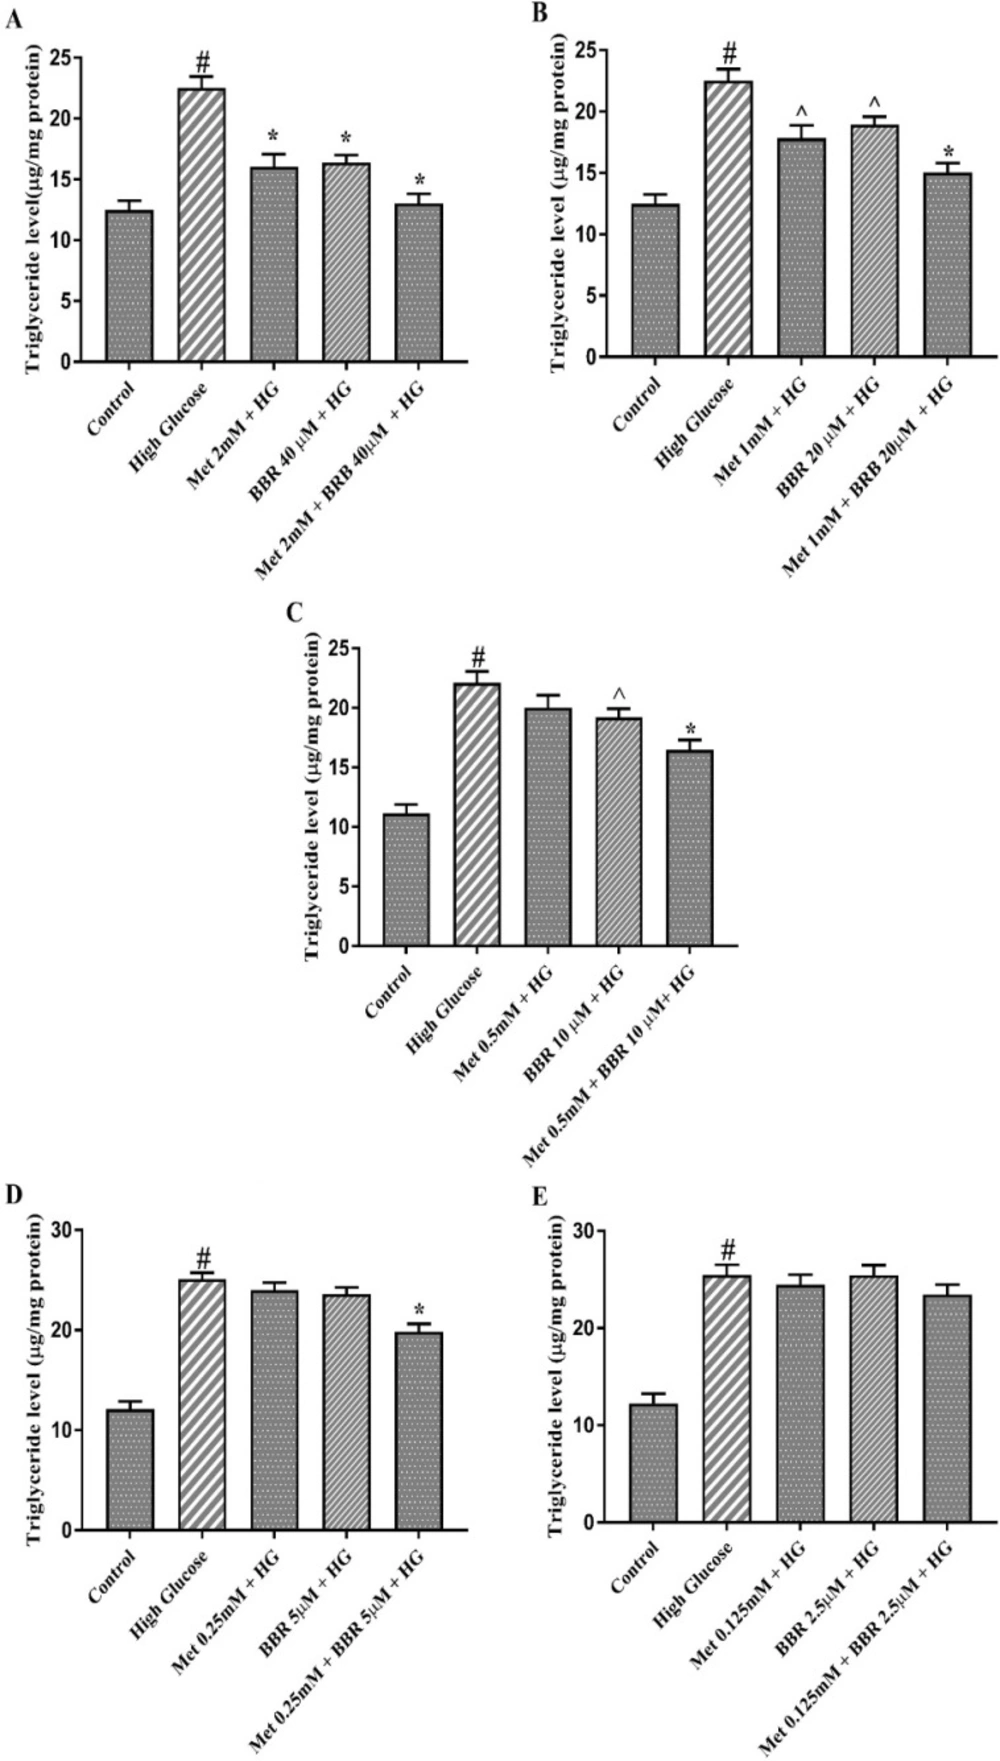
Triglyceride level of the cells treated by Met, BBR, and Met + BBR. HepG2 cells were treated with a constant molar ration of 50:1 Metformin to berberine. (A) Metformin (mM) to berberine (µM) of 2:40, (B) Metformin (mM) to berberine (µM) of 1:20, (C) Metformin (mM) to berberine (µM) of 0.5:10, (D) Metformin (mM) to berberine (µM) of 0.25:5, (E) Metformin (mM) to berberine (µM) of 0.125:2.5. Represented data are from three independent experiments and are means ± SEM. #: Control vs. High glucose, *: Treatments vs. High Glucose with P < 0.001, ^: Treatments vs. High Glucose with P < 0.05. Control: D-mannitol (27.5 mM mannitol) in normal glucose (NG) (5.5 mM glucose), HG: High Glucose (33 mM glucose), Met: Metformin, and BBR: Berberine
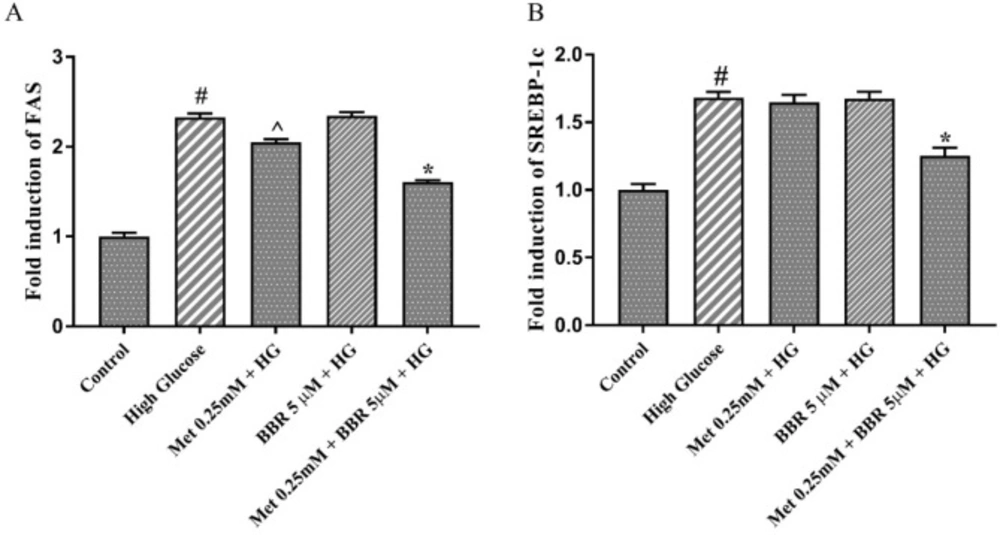
The expression of the key lipogenic genes, SREBP1c and FAS in the presence of Met, BBR, and Met+BBR. Represented data are from three independent experiments and are means ± SEM (n = 3). #: Control vs. High glucose, *: Treatments vs. High Glucose with P < 0.001, ^: Treatments vs. High Glucose with P < 0.05. Control: D-mannitol (27.5 mM mannitol) in normal glucose (NG) (5.5 mM glucose); HG: High (33 mM glucose); Met: Metformin; BBR: Berberine
