Chemicals and Reagents
The reagents and materials were obtained from different companies. Resazurin and rosmarinic acid from Sigma (Saint Louis, MO, USA) and trifluoroacetic acid (TFA, International Laboratory, USA); RPMI-1640 and FCS from PAA; β-actin and anti-rabbit IgG and HRP linked antibody from CellSignaling Technology (Boston, USA); Tyrosinase (H-109) and MITF (H-50) rabbit polyclonal antibody from Santa Cruz Biotechnology, Inc. (Dallas, Texas 75220 USA); Western blotting detection reagent from Bio-RaD (USA); α-melanocyte stimulating hormone,3,4-dihydroxy-L-phenylalanine, mushroom tyrosinase, phosphatase inhibitor cocktail, protease inhibitor cocktail, phenylmethylsulfonyl fluoride and QuantiPro BCA Assay Kit from Sigma (Steinheim, Germany). All solvents as analytical grade were purchased from Dr. Mojallali Lab. (Tehran, Iran).Water was purified using a Milli-Q water system (Millipore; Bedford, MA, USA).
Plant materials
The aerial parts of N. sintenisii were collected in July 2013 at altitude 1750 m from the National Park of Golestan, situated in Golestan province, Iran. Voucher specimens were identified in the Herbarium of Faculty of Pharmacy, Mashhad Medical University, and deposited under Accession No. 13061. The air dried aerial parts were powdered and then applied in the following process.
Plant material extraction
Plant materials were extracted with pure MeOH for 24 h by the percolation method at room temperature. To afford a crude MeOH extract, the filtered whole MeOH extract was concentrated in reduced pressure at 40-45 °C. This extract was then suspended in 95% MeOH and successively partitioned between n-hexane, MeOH, CH2Cl2, n-BuOH, EtOAc, and H2O. The extracts were evaporated under reduced pressure. All plant extracts were dissolved in DMSO in a concentration of 50 mg/mL and then stored at -20 °C until use.
Cell culture
B16F10 melanoma cells, purchased from Pasteur Institute of Iran, were maintained as a monolayer culture in Roswell Park Memorial Institute medium (RPMI 1640; PAA, Austria) supplemented with 10% heat-inactivated fetal bovine serum (FBS; Gibco, USA), 100 units/mL of penicillin, 0.1 mg/mL of streptomycin (antibiotic-antimycotic; PAA, Austria) in a humidified atmosphere containing 5% CO2 in air at 37 °C. The culture medium was changed every 2 d.
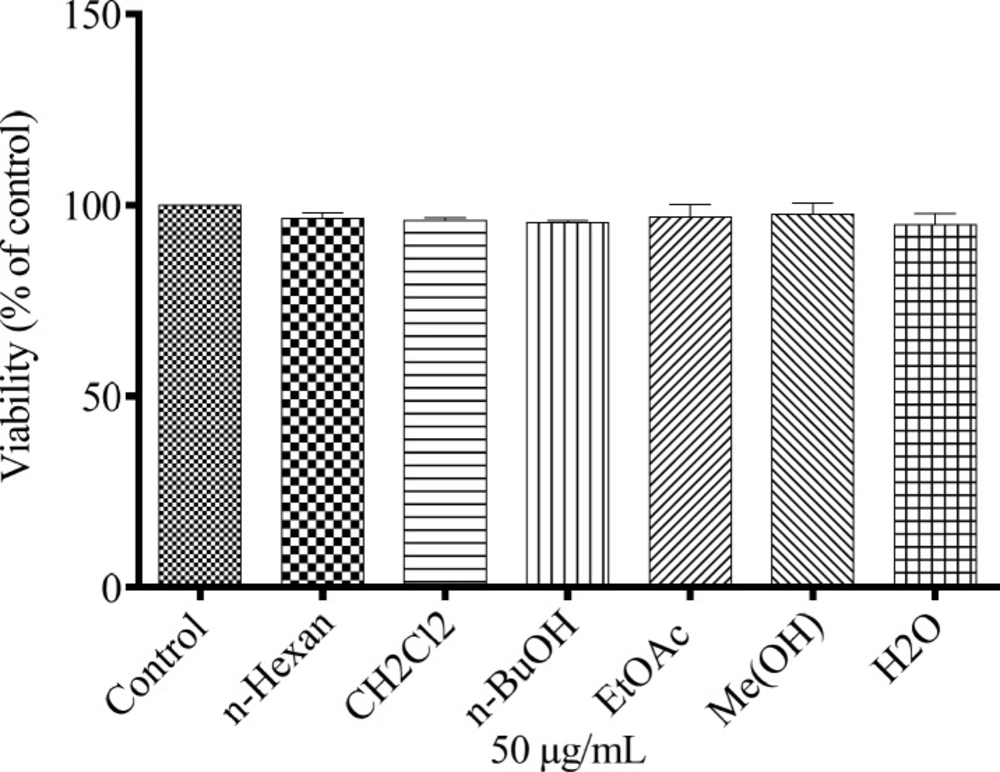
Cell viability assay
Conversion of resazurin (Sigma, MO, USA) to resorufin is a reduction reaction indicating the health of cells in which the reduction occurs in the cytosol of the live cells. While resazurin is non-toxic, blue in color and virtually non-fluorescent but resorufin is highly fluorescent and red in color. Resazurin continuously convert to resorufin in viable cells. This change increases the total fluorescence and color of the media surrounding cells (
28).
B16F10 murine melanoma cells were seeded onto 96-well dishes at a density of 104 cells per well. Then resazurin (14 mg/dL; 20 µL) was added to each well after 48 h incubation with 50 µg/mL of each extracts. The absorbance was measured at 570 and 600 nm after 4 h incubation at 37 °C. Cells incubated with 0.05% of DMSO and kojic acid were used as vehicle and positive controls, respectively. Culture medium was used as background. All experiments were performed in triplicate.
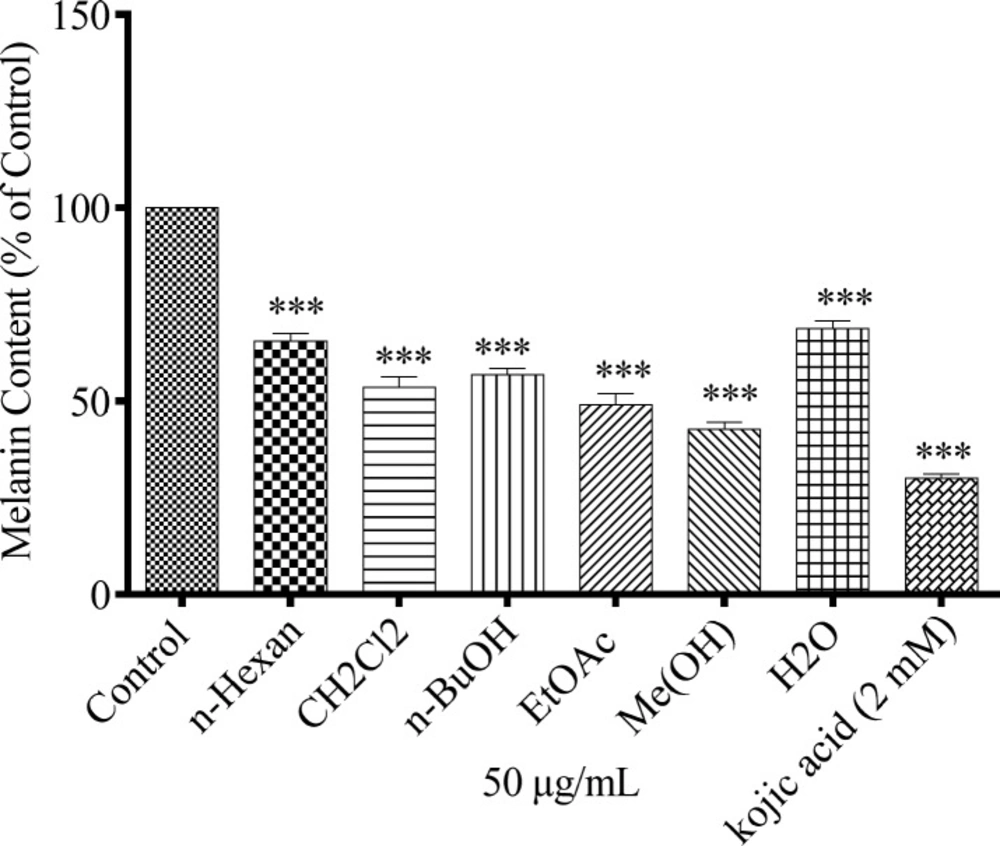
Melanin content determination
The method described by Hosoi
et al. was used for measuring the melanin content by some modifications (
29). B16F10 melanoma cells were seeded at a density of 5 × 10
4 cells per well in 96-well culture plates and cultivated by the method described above. The concentration of 50 µg/mL of each extract was added to the medium and incubated further for 24 h. Then, the medium was removed, and the cells were washed twice with phosphate-buffered saline (PBS) and harvested by trypsinization. The harvested cells were pelleted and the cell membrane was dissolved in Triton X-100. Then, the purified melanin was dissolved in 2M NaOH for 30 min at 100 °C. The absorbance was measured at 405 nm and melanin content was compared with control untreated cells. Cells incubated with 0.05% of DMSO and kojic acid were used as vehicle and positive controls, respectively. Culture medium was used as background.
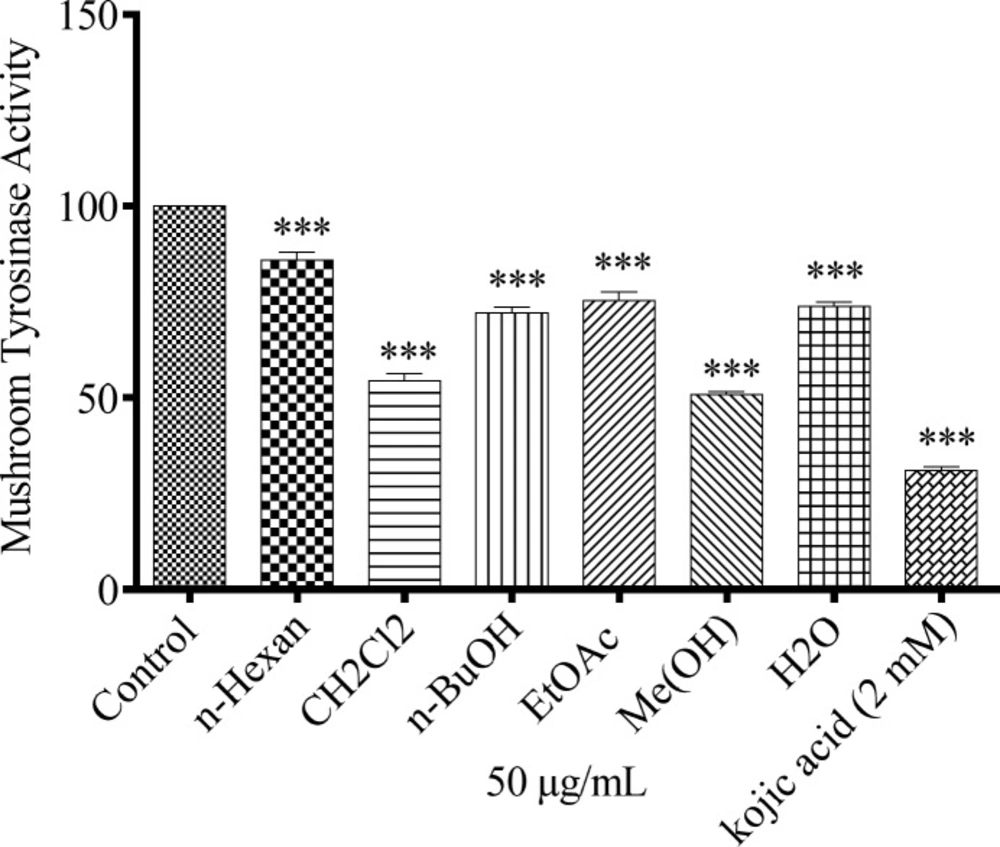
Mushroom tyrosinase activity assay
In a 96-well plate 10 µL of each sample extracts (50 µg/mL) were mixed with 160 µL of 5 mM L-DOPA (in 100 mM sodium phosphate buffer pH 6.8) was added to the wells plus 20 µL of mushroom tyrosinase and shacked for 5 min. Kojic acid was used as positive control and cell containing medium as negative control. The plate incubated for 30 min at 37 °C and the amount of dopachrome produced in this mixture was measured by spectrophotometer at 490 nm by ELISA Reader.
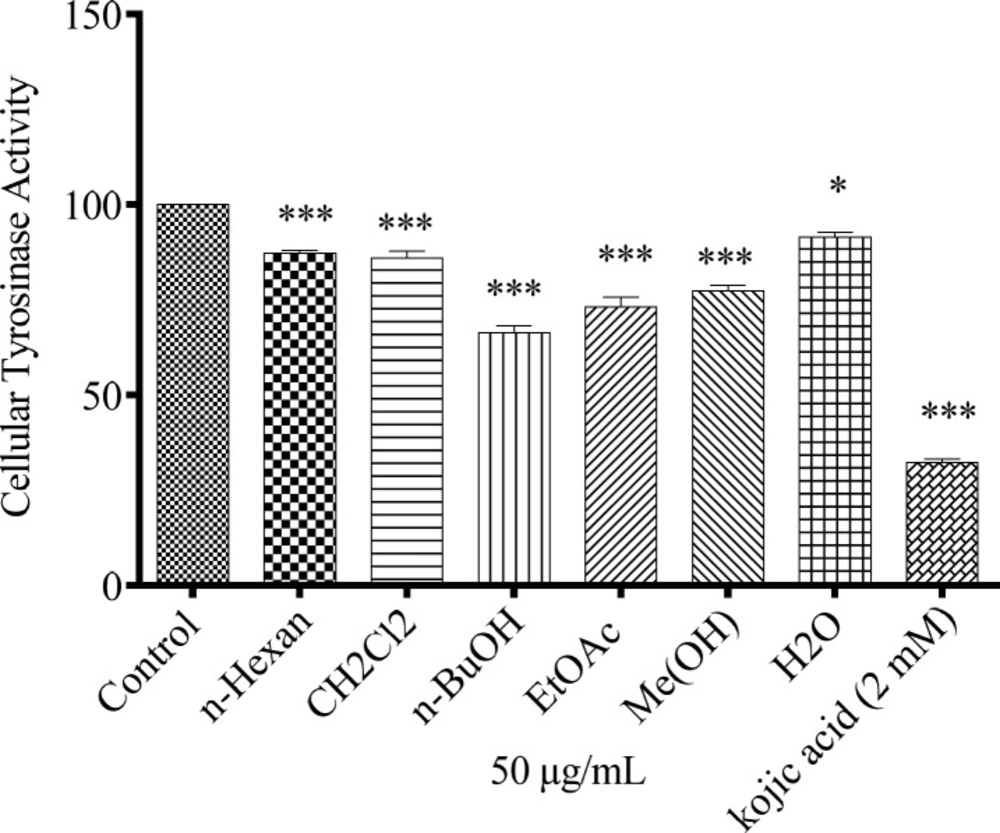
Cellular tyrosinase activity assay
Tyrosinase activity was analyzed by spectrophotometry following the oxidation of DOPA to DOPAchrome. After B16F10 melanoma cells (5 × 10⁴ cells/well) were seeded in 96-well plate and incubated for 24 h, they were treated with concentration of 50 µg/mL of the extracts. After trypsinization, the harvested cells were pelleted and washed with PBS. Then, pelleted cells lysed with 100 µL sodium phosphate buffer 100 mM (pH 6.8) containing 1% Triton X-100 and 0.1 mM PMSF. After 30 min, the lysates were centrifuged at 10,000 rpm for 20 min at 4 °C. The supernatant was transferred to 1 mL sterile microtube and kept in -80 °C. Hundred µL of this protein suspension as well as 100 µL of DOPA 5 mM was added to each well of a 96-well plate. After 2 h incubation, the absorbance was measured at 475 nm.
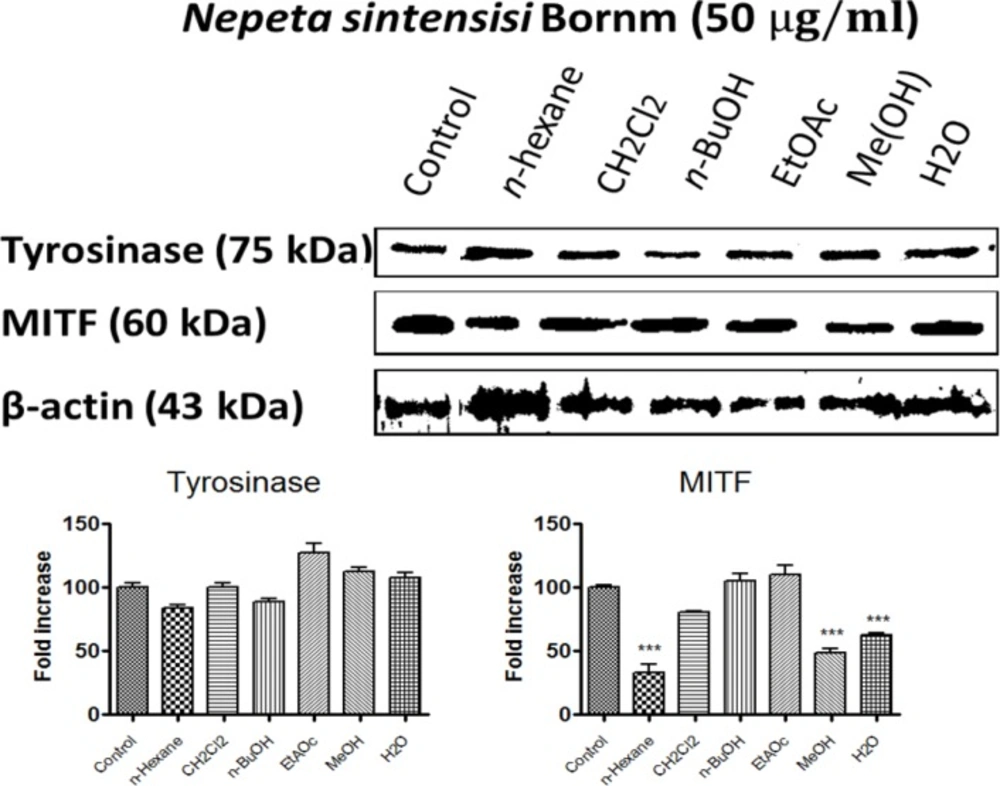
Western blotting
B16F10 melanoma cells were cultured in 25 cm2 flasks as described above. Cells were treated with all extracts at the concentration of 50 µg/mL for 24 h. The cells were then lysed in a buffer containing 50 mM Tris-HCl with pH 7.4, 2 mM EGTA, 1 mM phenylmethylsulfonyl fluoride, 10 mM β-Glycerophosphate, 1 mM sodium orthovanadate, 10 mM β-mercaptoethanoland 0.1% deoxycholic acid sodium salt (Western Blotting Protocol, BioRad, USA).
Proteins (50 µg) were resolved by 10% SDS-polyacrylamide gel electrophoresis and transferred electrophoretically to polyvinylidene difluoride membranes and then were blocked overnight in 5% skim milk in TBST (containing 20 mM Tris-HCl pH 7.4, 100 mM NaCl, and 0.1% Tween 20) buffer at 4 °C. After washing in TBST buffer, they were then incubated for 3 h with a primary antibody: rabbit anti-tyrosinase antibody (1:300), anti- MITF antibody (1:300). After incubation with an anti-rabbit IgG (1:2000) as a secondary antibody, the bands were detected using the ECL Prime Western Blotting Detection System (BioRaD, USA). Bands were scanned by GS-800, and band intensities were quantified by measuring optical densities with Quantity One software (Bio-Rad).
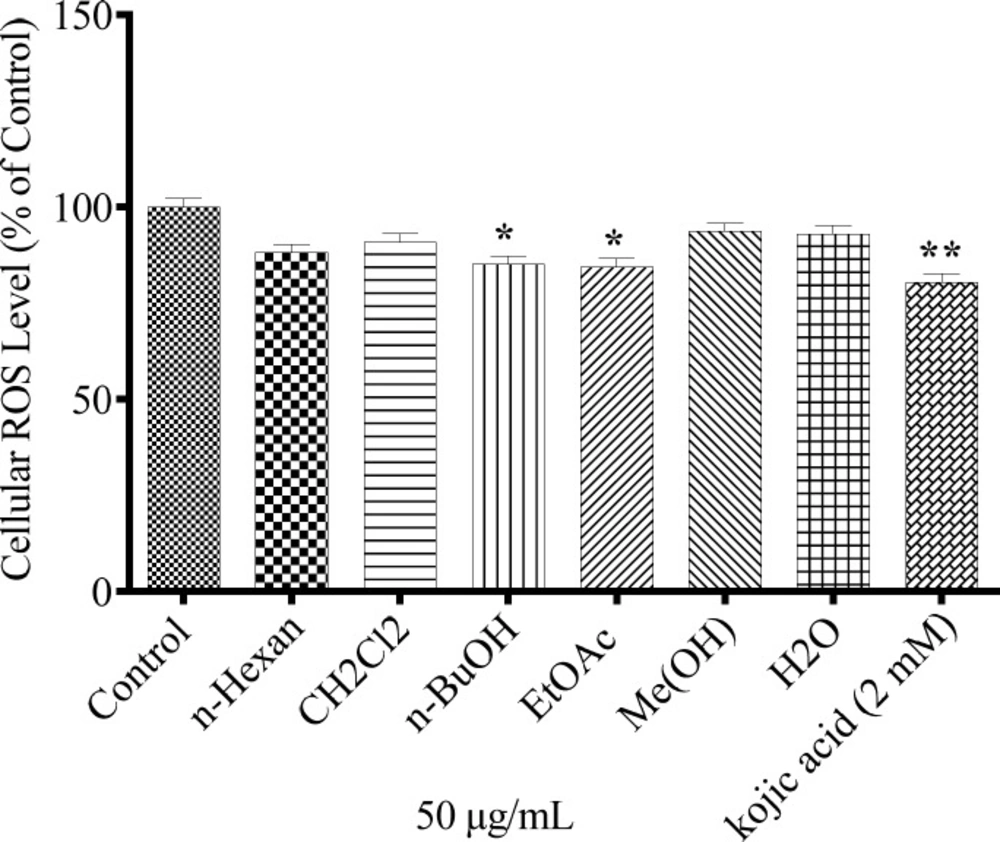
Cellular ROS level determination
About 5 × 10⁴ B16F10 melanoma cells were cultured in 96-well plate and treated with 50 µg/mL of the extracts and positive control for 24 h. Cell were exposed to 24 mM H2O2 at 37 °C for 30 min and 2ꞌ, 7ꞌ-dichlorofluorescein diacetate (DCFH-DA) was added to each well and incubated for the next 30 min. ROS was measured according to fluorescence intensities of DCF at excitation wavelength 504 nm and emission wavelength 524 nm using a Synergy H4 Hybrid Multi-Mode fluorescent Microplate Reader (BioTek, Winooski, USA).
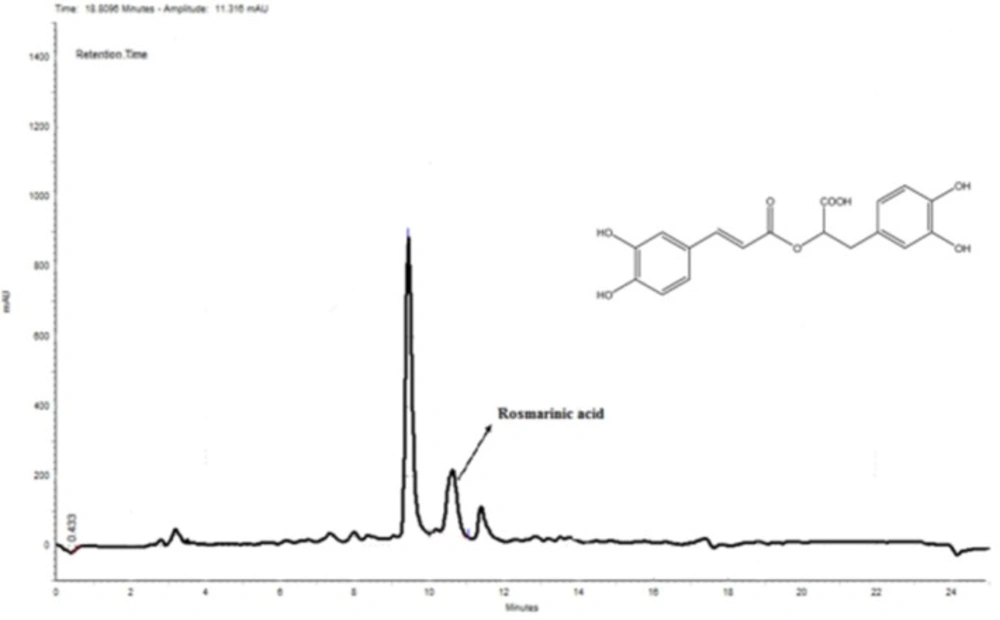
Quantitative analysis of rosmarinic acid by HPLC-DAD sample preparation
MeOH extract of N. sintenisii was standardized by HPLC using rosmarinic acid. The analysis of rosmarinic acid was performed using reversed-phase HPLC with a linear gradient mobile phase of 50%-100% methanol in H2O including 0.05% trifluoroacetic acid (TFA) with a flow rate of 1.0 mL/min at room temperature. First of all, different concentrations (125, 250 and 500 µg/mL) of the standard (rosmarinic acid) were prepared for plotting the standard curve. Then, about 20 g of the dried MeOH extract was dissolved in 1 mL dimethylsolfoxide (DMSO) and filtered through a syringe filter (0.4 μm, Alltech, Deerfield, IL, USA). The sample and standards were loaded on a C18 column (Advanced Chromatography Technologies Limited, Aberdeen, Scotland). Injection volume was 10 μL and analysis was monitored at 254 nm. To validate the gradient method, a standard sample containing uracil, methyl p-hydroxy benzoate, ethyl p-hydroxy benzoate, and benzophenone was injected repeatedly until four thoroughly separated peaks were observed.
Statistics
Values were expressed as a mean ± standard deviation (SD) of three different experiments. To check for quantitative differences between the groups, analysis of variance (ANOVA) and the Dunnettꞌs Multiple Comparison tests were performed with GraphPad Prism 5.0.