Drugs, agents and animals
DHIPC was synthesized in our laboratory (Zhejiang Ocean, Zhoushan, China) (
15). Its structure was characterized using IR,
1H-NMR,
13C-NMR, MS and elemental analysis techniques. A positive control: fluoxetine-HCl (Sigma, Shanghai, purity > 99%) was included. Reference standards for simultaneous determination of noradrenaline, serotonin, dopamine, and 5-hydroxyindoleacetic acid were all purchased from Sigma (Shanghai, purity > 99%). The major chemicals were purchased from Aldrich Chemical Corporation (Shanghai, China). All mice were obtained from the Laboratory of Animal Research, College of Pharmacy, Zhejiang Academy of Medical Sciences.
| Compounds | Dosage(mg/kg) | Antidepressant activity a
|
|---|
| Duration of immobility(s) | DID (%)b |
|---|
| DHIPC | 10 | 89.5 ± 9.8* | 30.46 |
| 20 | 68.9 ± 11.3** | 46.46 |
| 30 | 53.3 ± 11.3** | 58.59 |
| fluoxetine | 20 | 55.3 ± 8.1*** | 57.03 |
| Control | — | 128.7 ± 12.7 | — |
DHIPC and fluoxetine were administered intraperitoneally. Values are the mean ± SEM (n = 8).
Significantly different compared with control (*p < 0.05,
p < 0.01
p < 0.001
% DID: percentage decrease in immobility duration.
| Region | Group | serotonin | noradrenaline | 5-hydroxyindoleacetic acid | dopamine |
|---|
| hypothalamus | stress vehicle | 245.2 ± 11.4z | 193.7 ± 10.2z | 355.1 ± 24.6z | 209.3 ± 13.4 |
| DHIPC | 467.7 ± 48.9a | 297.7 ± 11.6b, z | 512.2 ± 17.2a | 199.7 ± 10.6 |
| fluoxetine | 475.2 ± 51.4a | 305.3 ± 47.1b | 585.6 ± 26.5a, z | 186.9 ± 9.3 |
| vehicle control | 605.4 ± 12.2a | 486.4 ± 57.4a | 914.2 ± 35.1a | 192.4 ± 34.3 |
| hippocampus | stress vehicle | 267.4 ± 11.7y | 107.3 ± 9.3z | 295.4 ± 19.6y | 40.3 ± 10.6 |
| DHIPC | 334.5 ± 9.6b, z | 173.3 ± 10.8z | 389.6 ± 25.7b, z | 42.6 ± 13.3 |
| fluoxetine | 357.1 ± 14.2b, z | 184.1 ± 12.6b, z | 357.7 ± 17.8b, y | 39.9 ± 7.9 |
| vehicle control | 501.2 ± 46.1a | 245.3 ± 14.4b | 809.7 ± 20.5a | 50.3 ± 12.6z |
| cortex | stress vehicle | 204.2 ± 28.5z | 154.1 ± 13.1z | 177.5 ± 13.8y | 1013.4 ± 65.1z |
| DHIPC | 451.7 ± 22.7b | 196.2 ± 9.8c | 186.3 ± 15.6y | 1103.4 ± 73.0y |
| fluoxetine | 479.2 ± 40.3b, z | 201.1 ± 8.4b | 197.7 ± 12.4z | 1109.2 ± 68.1z |
| vehicle control | 645.7 ± 60.2a | 223.5 ± 20.8b | 299.2 ± 15.7b | 1810 ± 98c |
p < 0.001,
p < 0.01,
p < 0.05 vs. Stress vehicle,
p < 0.001,
p < 0.01,
p < 0.05 vs. vehicle control.
| Region | Group | serotonin | noradrenaline | 5-hydroxyindoleacetic acid | dopamine |
|---|
| hypothalamus | stress vehicle | 255.1 ± 22.4x | 55.8 ± 6.2z | 415.2 ± 38 | 109.1 ± 10.8z |
| DHIPC | 385.1 ± 23.6b | 99.7 ± 7.6c,z | 843.4 ± 65a,z | 106.4 ± 9.3 |
| fluoxetine | 397.1 ± 20.4b | 101.5 ± 6.4b,z | 866.5 ± 48.2a,z | 117.2 ± 13.2 |
| vehicle control | 732.4 ± 50.8a | 199.7 ± 11.2a | 901.1 ± 92 x | 188.3 ± 12.4c |
| hippocampus | stress vehicle | 132.4 ± 10.5y | 103.1 ± 5.7y | 1313.5 ± 73.3y | 76.2 ± 5.4z |
| DHIPC | 242.4 ± 10.0b,y | 163.9 ± 8.8b,z | 1583.6 ± 30.7b,z | 78.4 ± 5.3 |
| fluoxetine | 250.8 ± 9.1b,y | 194.2 ± 6.8a,z | 1521.4 ± 42.7b | 80.6 ± 4.8 |
| vehicle control | 682.1 ± 40.8a | 291.6 ± 11.1a | 1129.2 ± 59.7 | 93.6 ± 9.1c |
| cortex | stress vehicle | 342.4 ± 19.5y | 96.5 ± 9.9x | 190.2 ± 13.4x | 1381.3 ± 59.1y |
| DHIPC | 498.5 ± 25.4b | 125.4 ± 6.9c | 149.1 ± 7.6z | 1130.4 ± 63.3z |
| fluoxetine | 554.5 ± 44.3a | 146.8 ± 5.4b | 150.2 ± 10.4z | 1248.1 ± 99.1z |
| vehicle control | 673.5 ± 62.3a | 241.7 ± 9.8a | 339.4 ± 11.7a | 2134.1 ± 142.1b |
p < 0.001,
p < 0.01,
p < 0.05 vs. Stress vehicle,
p < 0.001,
p < 0.01,
p < 0.05 vs. vehicle control.
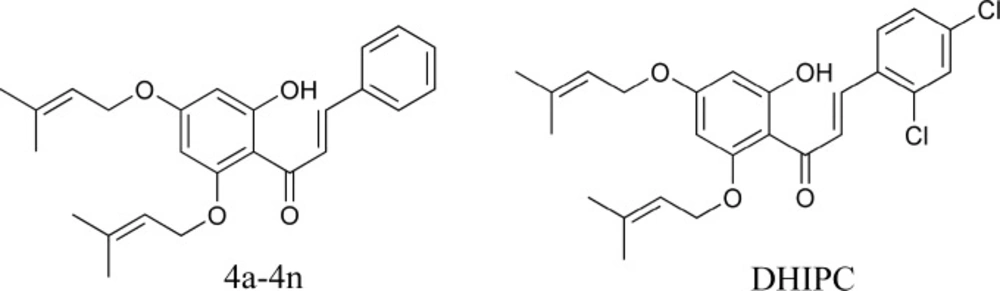
Structure of compounds 4a-4n and DHIPC
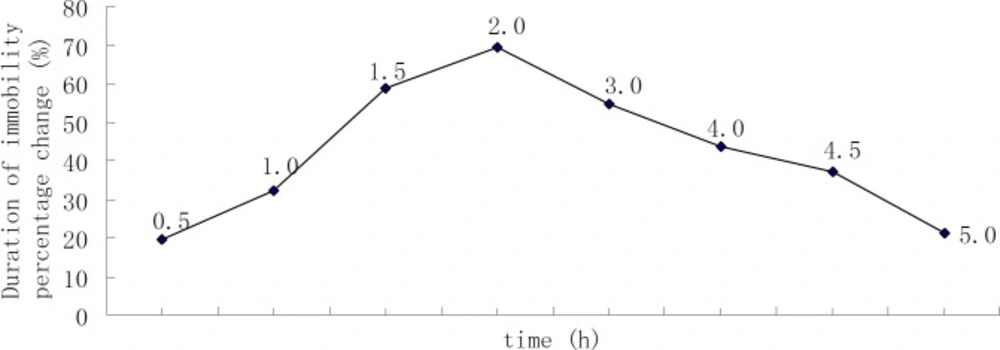
Time-course of DHIPC in the forced swim test (the number of animals at each point was 10).
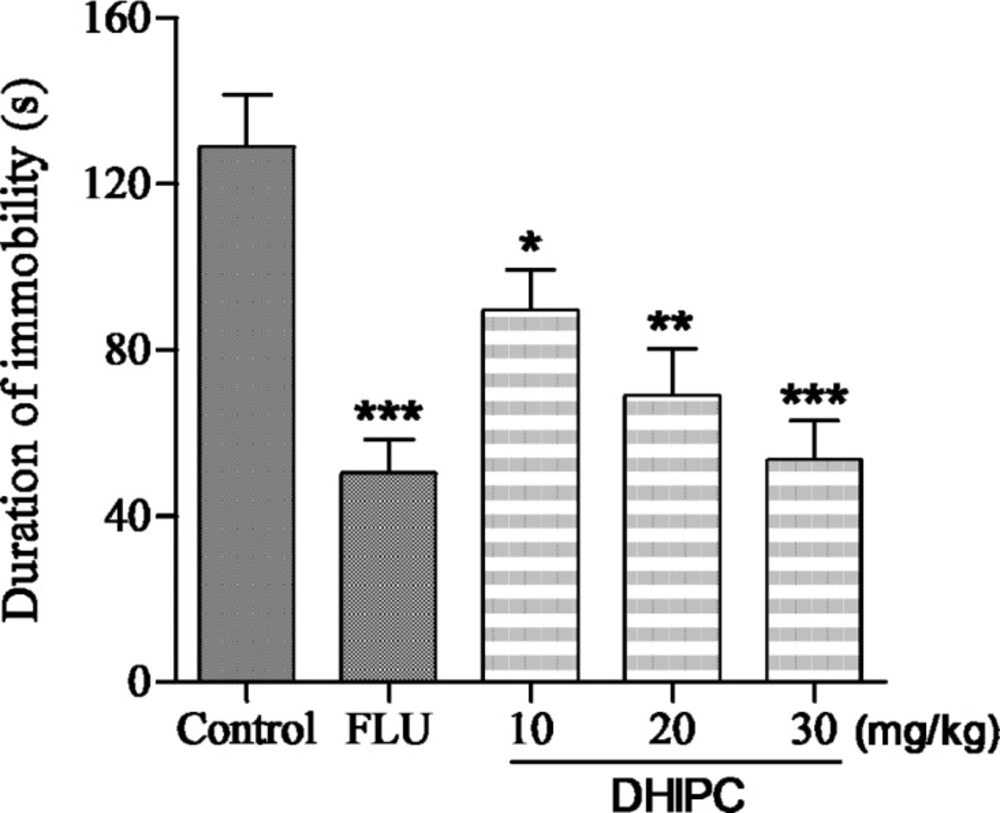
Effect of DHIPC on immobility time in the forced swim test in mice. Data are expressed as the mean ± SEM (n = 8). Symbol (*, ** or ***) indicates statistically significance in comparison to vehicle at p < 0.05, p < 0.01, p < 0.001
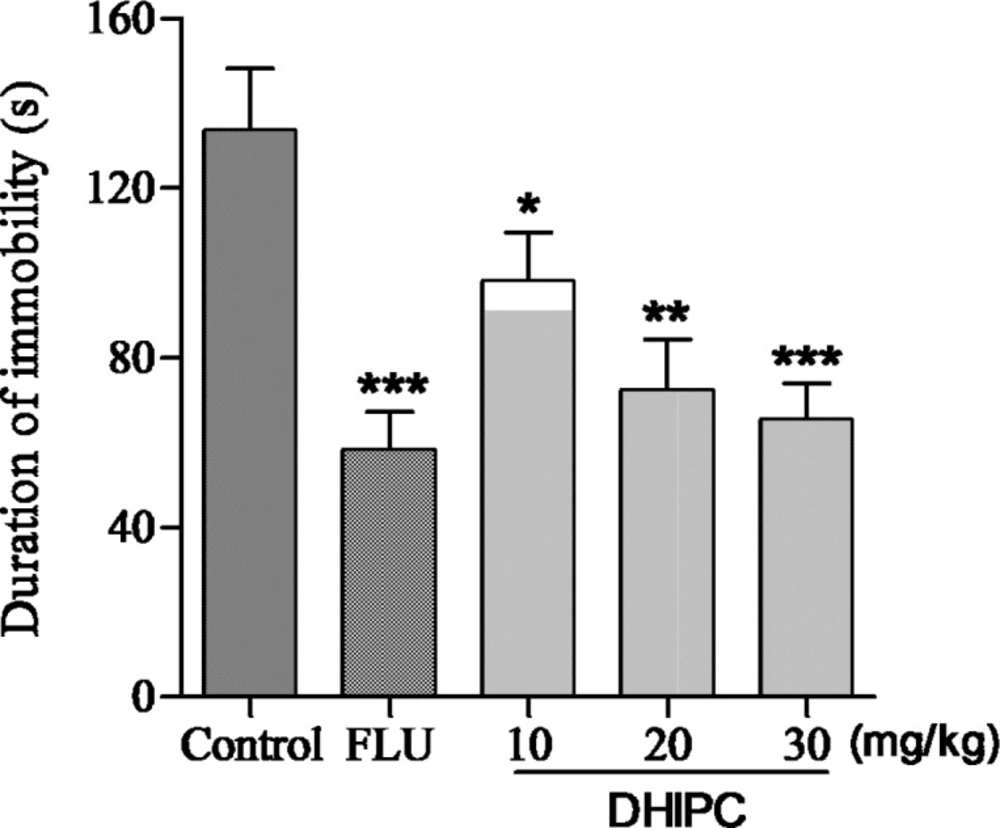
Effect of DHIPC on immobility time in tail suspension test in mice. Data are expressed as the mean ± SEM (n = 8). Symbol (*, ** or ***) indicates statistically significance in comparison to vehicle at p < 0.05, p < 0.01, p < 0.001
Drug treatment
DHIPC was dissolved in 0.5% methylcellulose cellulose sodium and administered per-oral injection at doses of 10, 20, and 30 mg/kg, which was designed after the pretest. Fluoxetine was dissolved in sodium chloride and was also administered acute per-oral injection at dose of 20 mg/kg. The volume of administration for vehicle and drug solutions was 0.2 mL/20 g of mice, and other drugs were dissolved in 0.9% isotonic saline solution immediately before use. The vehicle or test drugs were administered 2 h before the test session. The procedures in this study were performed in accordance with the National Institute of Health Guide for the Care and Use of Laboratory Animals and approved by the Ethics Committee of our Institution. All efforts were made to minimize animals suffering and to reduce the number of animals used in the experiments.
Forced swimming test
Male ICR mice (20 ± 2 g) were used in the forced swim test under standard conditions with free access to food and water. The mice were randomly divided into five groups (8 mice per group were used) for the forced swim test. We used 40 male mice. On the test day, the mice were dropped once a time into a plexiglass cylinder (height 25 cm, diameter 10 cm) containing 10 cm of water at 20 ± 2 °C. In this day, the mice were assigned into different groups (
n = 8 for each group). The vehicle or test drugs were administered 2 h before a test session oral injection. Then, the mice were dropped individually into the plexiglass cylinder and left in the water for 6 min. After the first 2 min of the initial vigorous struggling, the animals were immobile. The duration of immobility was recorded during the last 4 min of the 6 min test. All test swim sessions were recorded by a video camera positioned directly above the cylinder. Two competent observers, who were unaware of the treatment each mouse had received, scored the videotapes. Immobility period was regarded as the time spent by the mouse floating in the water without struggling and making only those movements necessary to keep its head above the water. Following swimming sessions, they were then towel dried and returned to their housing condition. The animals were used only once in this test. All the forced swim tests were performed between 11:00 am and 14:00 pm (
16,
17).
Tail suspension test
Local breed, male ICR mice (20 ± 2 g) were used in the forced swim test under standard conditions with free access to food and water. Mice were randomly divided into five groups (8 mice per group were used) for the tail suspension test
. We used 40 male mice. Briefly, the vehicle or test drugs were administered 2 h before a test session oral injection. Then, mice were individually suspended by tail with clamp (2 cm from the tip of the end) in a box (25 × 25 × 30 cm) with the head 5 cm to the bottom. Testing was carried out in a darkened room with minimal background noise. All animals were suspended for total 6 min, and the duration of immobility was observed and measured during the final 4-min interval of the test. All test sessions were recorded by a video camera positioned directly above the box. Two competent observers blind to treatment scored the videotapes. Mice consider immobile only when they hung passively and completely motionless. The animals were used only once in this test. All tail suspension tests were performed between 12:00 am and 15:00 pm (
18,
19).
Time-course of oral administration onthe forced swim test
The time-course effect of DHIPC in the forced swim test was determined. A 30 mg/kg dose of DHIPC suspension in a mixture containing 0.5% methylcellulose cellulose sodium was injected per-oral in the mice. The mice were divided into 7 groups. Subsequently, the animals were subjected to the forced swim test at various times: 0.5, 1.0, 1.5, 2.0, 3.0, 4.0, and 5.0 h.
The sample preparation
Quantification of monoamines was performed according to the method described in Chen
et al. (
20) with some modifications. The doses 30 mg/kg of DHIPC were tested the effect on neurotransmitter concentrations in the brain of rat. Rats were randomly divided into four groups (10 mice per group were used); we used 40 male mice. DHIPC (30 mg/kg), fluoxetine (30 mg/kg), vehicle control, stress vehicle were given orally daily for 7 days. In the last day, the drugs were given 1 h prior to the test. At the end of the experiment, the rats were immediately sacrificed by cervical dislocation; the brain tissue was quickly removed, and rapidly frozen and stored at −80 °C until they were processed for biochemical estimations.
HPLC condition and test
Following decapitation, the brains were rapidly removed, dissected on an ice-chilled glass plate and subsequently prefrontal hypothalamus, cortex and hippocampus were isolated. The tissues were weighed, sonicated in 0.1M NaH2PO4 aqueous solution including 0.85 mM OSA, 0.5 mM EDTA·Na2 (ethylenediamine tetraacetic acid disodium) and centrifuged (12000×g for 30 min). Then, noradrenaline, serotonin, dopamine, and 5-hydroxyindoleacetic acid were assayed by HPLC-ECD. The HPLC system consisted of a microbore reverse-phase column (Shimadzu LC-10ATVP HPLC system, Shimadzu L-ECD-6A electrochemical detector, N2000 HPLC workstation software, Hypersil ODS C18 Column 4.6 × 150 mm 5 μM Thermo, USA). The mobile phase consisted of 0.1M NaH2PO4 aqueous solution including 0.85 mM OSA, 0.5 mM EDTA·Na2 and 11% methanol adjusted to pH 3.4 with phosphate acid and filtered through 0.45 μM pore size filter. External standard curves were used to quantify the amounts of noradrenaline, serotonin, dopamine and 5-hydroxyindoleacetic acid in each sample calculated by area under curve. The volume of injection was 20 μL. The detection limit of the assay was 20 pg/g sample. The filtrate sample was used for quantification of serotonin (Y = 0.0529 X+0.0016, R = 0.9989), noradrenaline (Y = 0.0357 X+0.0031, R = 0.9991), dopamine (Y = 0.0628 X+0.00417, R = 0.9976), and 5-hydroxyindoleacetic acid (Y = 0.0481 X+0.0053, R = 0.9988) by HPLC coupled with electro-chemical detection in all brain regions.
Statistical analysis
The results are expressed as mean ± SEM n representing the number of animals. The statistical tests used were one-way analysis of variance (ANOVA) and Tukey›s test for comparison between all treatment groups using GraphPad Prism program (GraphPad Software, Inc., San Diego, USA). A p-value of less than 0.05 was considered statistically significant.