Herbal preparation and extraction
The roots of G. uralensis were harvested from Yanchi, Ningxia, China in June. The plant sample was authenticated by Xinhui Zhang at the Pharmacognosy Department, college of Pharmacy, Ningxia Medical University, and a voucher specimen was deposited in the same unit (herbarium number: 2013612).
G. uralensis (3 kg) was extracted using ultrasonic techniques three times with 70% ethanol (mass ratio of solid to liquid was 1:8; 30 min). The extract was then combined and evaporated to dryness under reduced pressure. Deionized water was added to the crude extract to obtain sample solutions (15 L). The sample solutions were pumped at a flow rate of 2 BV/h, into the properly treated chromatography column pre-packed with AB-8 macroporous resin (4 L). After sample loading, deionized water was used to wash the column until the effluent appeared colorless in the first step, followed by elution with 8 BV of 70% (v/v) ethanol aqueous solution. Eluates were collected and evaporated under reduced pressure until no alcohol taste was present. The solution was then partitioned with ethyl acetate to yield an ethyl acetate fraction. The dry ethyl acetate fraction was dissolved in deionized water (3 L) and adsorbed on a polyamide resin (5 L). The flow rate was 2 BV/h. The column was then washed with deionized water until the effluent was colorless and then eluted with 70% (v/v) aqueous ethanol (8 BV). Eluates were collected and evaporated to dryness using a rotary evaporator to yield a total flavonoids fraction (TFF).
Estimation of the total flavonoids content
The total flavonoids content was determined using a potassium hydroxide colorimetric assay. First, 0.5 mL of diluted solution containing flavonoids and 0.5 mL of 10% (w/w) KOH were added to a volumetric flask (10 mL). The solution was then diluted with 70% ethanol to volume, and mixed. After 5 min at room temperature, the absorbance of the solution was measured at 337 nm using a UV spectrophotometer against the same mixture, without the sample as a blank. The total flavonoids content was expressed as liquiritin equivalents.
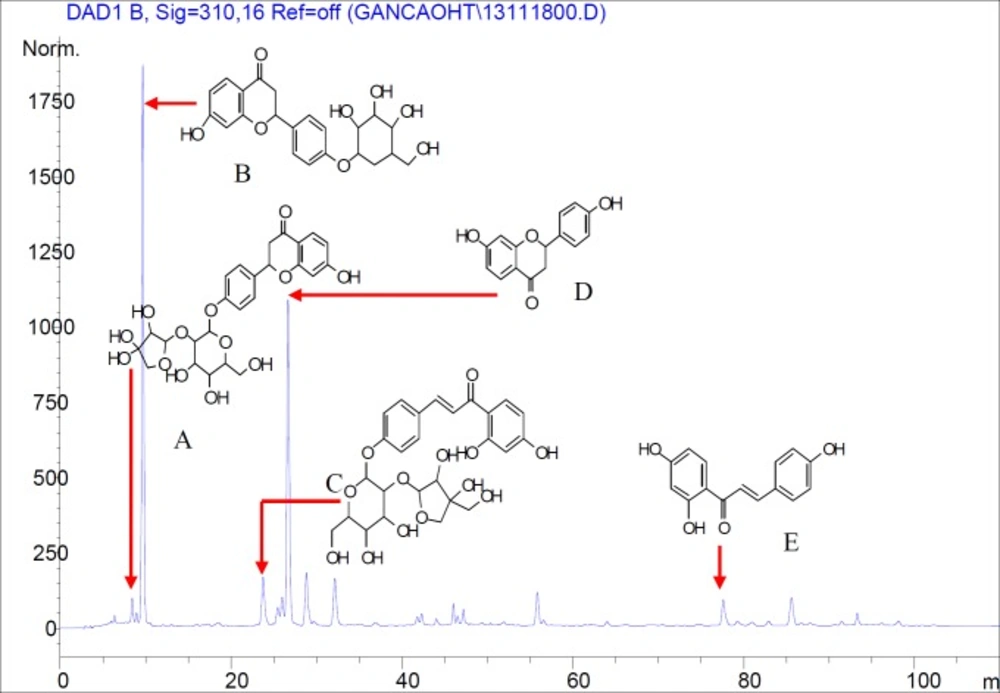
HPLC analysis
HPLC analysis was performed with an Agilent 1100 HPLC system equipped with a diode array detector (DAD). A Welchrom-C18 column (4.6 × 250 mm, 5 μm) was used. Gradient elution was employed using solvent systems A (acetonitrile) and B (0.2% glacial acetic acid). The flow rate was 1.0 mL/min and column temperature was maintained at 25 °C. The detector wavelength was 310 nm. An aliquot of 10 μL of solution was injected for acquiring chromatograms. The gradient program is shown in
Table 1.
Drugs and chemicals
The following drugs and chemicals were used: dimethylbenzene and ethanol were purchased from Damao Chemical Company (Tianjin, China). Carrageenan (Grade: BR; no: YY13755-25 g) was obtained from Shanghai Yuanye Biological Technology Co., Ltd. Indomethacin (no. A130602) was obtained from Shanxi Yunpeng Pharmaceutical Co., Ltd. The ELISA kit for rat TNF-α, IL-1β, NO, iNOS, SOD and MDA were obtained from the Beijing Cheng Lin Biological Technology Co. Ltd. (China). TTF was suspended in water with 0.5% w/v sodium carboxyl methyl cellulose (Na-CMC).
Animal preparation
ICR mice (18-22 g; License No: SYXK (NING) 2011-0001) and Sprague-Dawley rats (180-220 g; License No.: SCXK (NING) 2012-0001) were purchased from the Experimental Animal Center of Ningxia Medical University (Ningxia, China). They were maintained in standard laboratory cages, with moderate humidity (50% ± 5%), at a constant temperature (22 ± 1 °C) in a 12-h light-dark cycle room. All animals had free access to food and water during the experimental period. The experimental procedures were approved by our institutional animal research ethics committee.
Toxicity study
The acute toxicity study of TFF was performed according to Modern Pharmacology Experimental Methods (volume Ⅱ) (
18) guidelines (2012). The TFF was suspended in water with 0.5% (w/v) sodium carboxyl methyl cellulose (Na-CMC); doses of 500, 1000, 2000 mg/kg body weight were orally administered to over-night-fasted, healthy mice (n = 8), and the animals were observed continuously for 24 h for mortality.
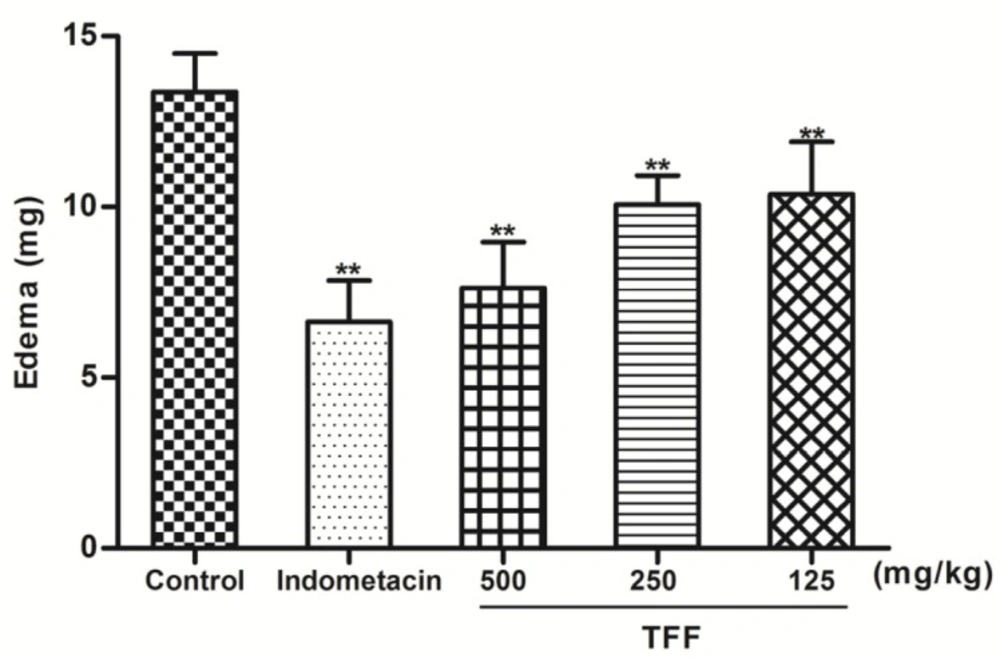
Dimethylbenzene (DMB)-induced ear vasodilatation assay
This was carried out according to previously described methods (
19). Mice were randomly divided into five groups (n = 8): control group, an indomethacin (10 mg/kg) positive group and three TFF groups (500, 250 and 125 mg/kg). Treatment were administered via oral gavage. After 40 min, 30 μL of DMB was applied to both the inner and outer surfaces of the right ear; the left ear was considered as the control. Mice were sacrificed by cervical dislocation, and both ears were removed 30 min later. Biopsies of both ears were obtained with a punch (a diameter of 8 mm) and weighed. The difference in weight caused by the irritant was measured by subtracting the weight of the untreated left ear section from that of the treated right ear sections.
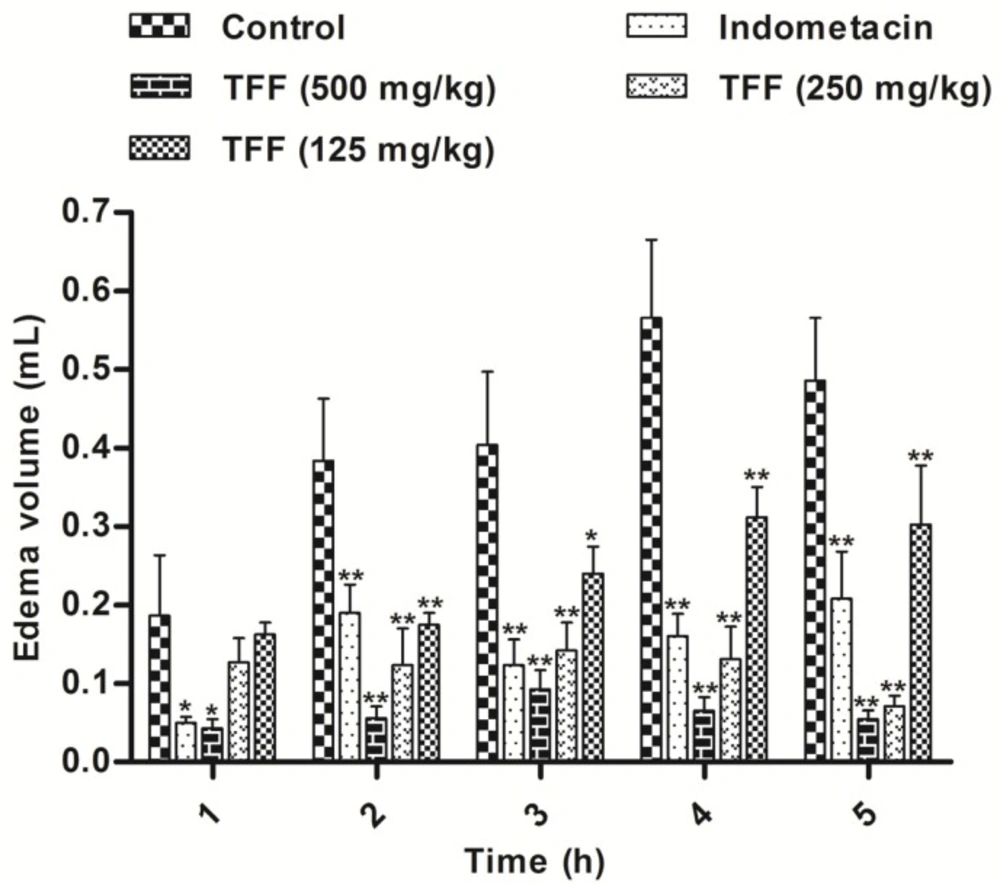
Carrageenan-induced paw edema
Paw edema was induced according to Winter
et al. (
20). The animals were divided into five groups of seven each. They were pretreated orally with either vehicle, indomethacin (10 mg/kg) or TFF (500, 250 and 125 mg/kg). After 40 min, edema was induced with the injection of 0.1 mL of 1% (w/v) freshly prepared carrageenan suspension in saline into the right hind paw of each rat. Inflammation was quantified by measuring the volume (mL) displaced by the paw using a plethysmometer (Beijing Zhongshidichuang Science and Technology Development Co., Ltd, model YLS-7C, China) at 0, 1, 2, 3, 4 and 5 h after carrageenan injection. The edema volume was expressed as the change in volume between each time point (1, 2, 3, 4 and 5 h) and at basal time (0 h).
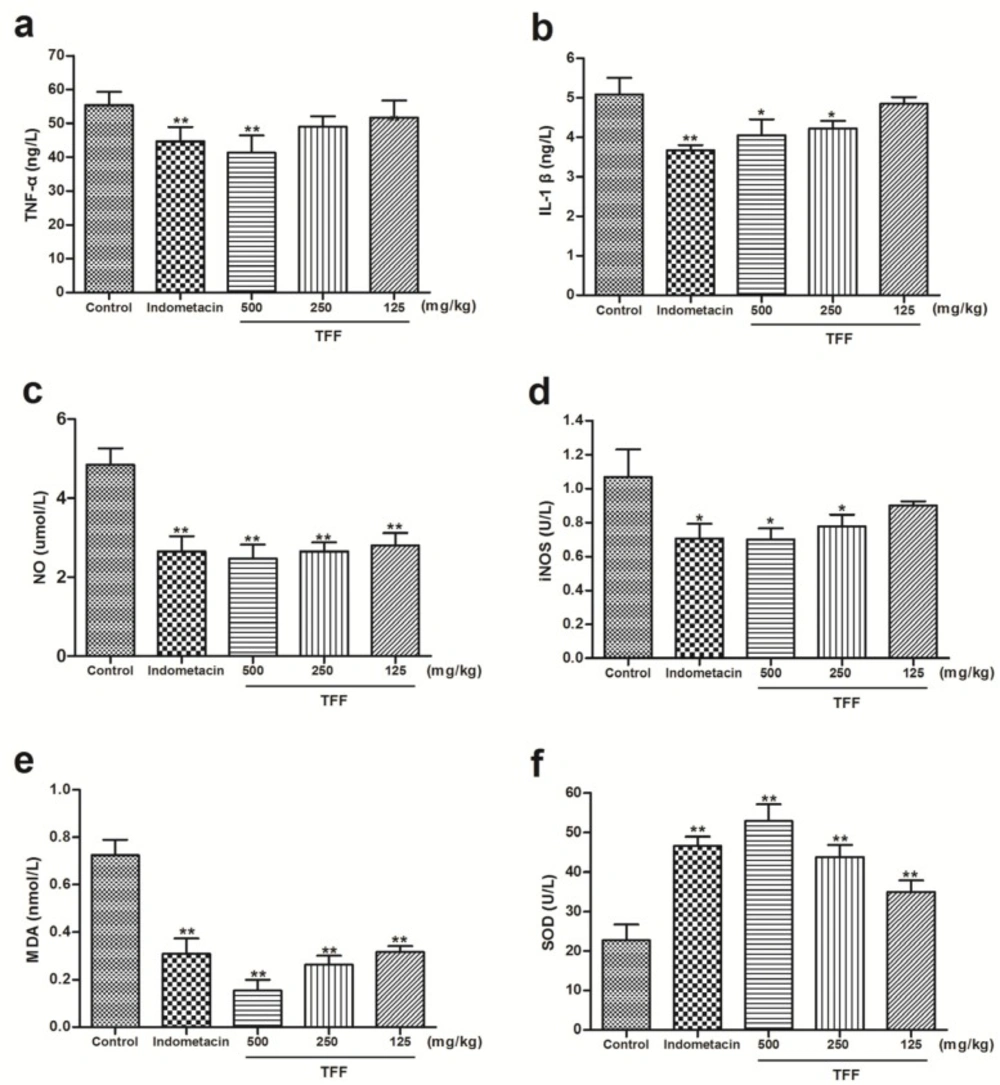
At the end of the experiments, the animals were sacrificed and all right hind paws were dissected and stored at −80 °C. Skin tissue was homogenized in PBS (pH = 7.4). The homogenates were centrifuged at 2000 ×g for 20 min at 4 °C, and the supernatant was removed. Repeated freeze-thaw cycles were avoided. The concentration of inflammatory cytokines, inflammatory mediators and antioxidant factors (TNF-α, IL-1β, NO, iNOS, MDA and SOD) was measured by ELISA. Assays were performed according to the manufacturer’s instructions.
Statistical analysis
Results were analyzed using the statistical program SPSS Statistics, version 17.0. One-way ANOVA followed by Dunnett’s test or Dunnett’s T3 test were used for determining the statistically significant differences between experimental groups. Values of *P < 0.05 and **P < 0.01 were regarded as statistically significant.