Introduction
Biodegradable random and block copolymers are an attractive class of polymeric materials which belong to a big family known as “soft materials”. The biodegradability, biocompatibility, and permeability of polyesters such as polylactide (PLA), poly(ε-caprolactone) (PCL), polyglycolide (PGA), and their copolymers bring them to a considerable interest in many drugs and clinical demands from tissue engineering to medical devices (1-4). PLA and PCL have been successfully used for the synthesis of numerous star, multi-arm star, and also hyperbranched polymers (5, 6).
Star-shaped macromolecules were widely used as model-branched polymers for evaluating the effect of branching on the polymers properties. These polymeric species consist of a central core and some linear chains linked to that core by one of their ends. Various paths for the preparation of star-shaped polymers have been described in the literature. The study of physical properties of branched polymers is one of the recent topics in polymer science and this is not only caused by the practical importance of these types of polymers but it is also related to their importance in examining the basic theories in polymer science (7-11).
Semi-interpenetrating polymeric networks (semi-IPNs) have appeared as new biomaterials as scaffolds for tissue engineering. The IUPAC definition of IPN is: “a polymer comprising one or more networks and one or more linear or branched polymer(s) characterized by the penetration on a molecular scale of at least one of the networks by at least some of the linear or branched macromolecules” (12, 13). Comparing to individual cross-linked networks, physical entanglements, and network interactions cause semi-IPN help improve the mechanical strength and resiliency of the polymer. Moreover, semi-IPN is favorable strategies for compatibilizing immiscible polymers. The network features can be desired by polymer type, polymer concentration, and applied cross-linking method and also by the general protocol used for their preparation (14-16).
Poly(ɛ-caprolactone) and poly(lactide)s from polyesters family which are used in many biomedical applications, have gained a great attention due to their biodegradability and miscibility with a variety of polymers. In addition, poly (ester urethanes) which contain PCL, PLA blocks and diisocyanate in their structure have good elastomer properties and biocompatibility as well as high physical and mechanical properties. Currently, the only technically reasonable method for producing polyurethane (PU) plastics is the poly addition process of diisocyanates and polyols. Hence, the manufacturing methods and properties of the isocyanate feed stocks are the deciding factors for the production of polyurethanes (17-21).
As it is known from literature, there are two part starting materials in the preparation of polyurethanes, one as chain extender typically various types of diisocyanate and other, polyethers such as polyethylene oxide diols or polyester such as polycaprolactone (PCL) diols as convenient long chain diols. The aromatic diisocyanate such as 4, 4′-diisocyanatodiphenylmethane (MDI) includes toxic and carcinogenic degradation product, therefore is generally used in the industrial preparation of Pus and has to be excluded from the synthesis of biodegradable Pus. The alternative aliphatic diisocyanate such as 1,6-diisocyanatohexan (HDI) which is used in the present work is preferred, because its degradation product are nontoxic or low toxic and metabolized or eliminated by the living organism (22-24).
As it was mentioned before, it is great of interest to make careful choice of the reactant to avoid the dangerous degradable products. There are several polyol which is nontoxic and can be used as a reactant in the preparation of Pus. Polycaprolactone is biodegradable polyester. It has a methylene group on the main chain which gives hydrophobic character to the polymer, leading long times of degradation in aqueous media. 6-hydroxyhexanoiec acid is degradation product of PCL which is transformed by microsomal ɷ-oxidation to adipic acid, a natural occurring metabolite. PCL preferred in this work due to these tremendous properties (22-27).
As part of our interest in the synthesis of new organic and polymeric compounds and its biomedical application, (28-31) in this present research, it has been tried to report the synthesis of a new type of semi-interpenetrating polymer networks, derived from ɛ-caprolactone, lactide, 1,4-butane diisocyanate and ethylenediamine and also its potential in the soft tissue engineering applications (Scheme 1) (32).
Experimental
Materials
Lactide (LA) was obtained from Acros Company. ɛ-Caprolactone (CL) was purchased from Sigma and purified with CaH2 by vacuum distillation. Stannous octoate (Sn(Oct)2, 95%) was purchased from Aldrich and used as received. 1,4-Butane diisocyanate (Merck) and ethylenediamine (Merck) used as received. Solvent dimethylsulfoxide (DMSO) was dried with 3Å molecular sieve. All other commercially available solvents were purchased from Merck Chemical Co. and used as received. Dulbecco’s Modified Eagle’s Medium (DMEM)/F12, RPMI 1640 and fetal calf serum (FCS) were obtained from GIBCO Invitrogen Corporation. 3-(4,5 Dimethylthiazol-2-yl)-2,5-diphenyl tetrazolium bromide (MTT), dimethyl sulfoxide (DMSO) and epidermal growth factor (EGF) were purchased from Sigma.
CL/LA prepolymer synthesis
The 4-arm star-Shaped CL/LA prepolymer was synthesized by Sn (Oct)2-catalyzed ring-opening polymerization of CL and LA. Typical polymerization procedure was as following: A certain amount of pentaerythritol (0.13 g, 1 mmol), Sn(Oct)2 (0.2 wt.% of monomers), LA (9.12 g, 80 mmol ) and CL (9.12 g, 80 mmol ) were placed in a three-neck round-bottom flask equipped with a reflux condenser under a nitrogen atmosphere. Then, the reaction vessel was put in oil bath at 120 °C, for 24 h with stirring. After the reaction flask was cooled to room temperature, the resulting product was dissolved in methylene chloride and then poured into excess methanol to precipitate the polymerized product. The 4-arm star shaped CL/LA prepolymer with a hydroxyl group at each chain end was obtained after filtering and drying in a vacuum at room temperature for 48 h. Yield: 8.38 g (90%)
Polymer network synthesis
In a second step, stoichiometry of the reaction was 4:2:2 of 1, 4-butane diisocyanate (BDI): prepolymer (PLA/PCL): ethylenediamine. An approximate 25 wt% solution of prepolymer in DMSO was mixed with an approximate 15 wt% solution of BDI in DMSO. Stannous octoate (0.2 wt%, with respect to monomers) were then added.
This compound was allowed to react at 70 °C for 3 h. The solution was cooled to room temperature, the ethylenediamine solution was added dropwise under stirring and the reaction was continued at room temperature for a period of 24 h. The polymer solution was precipitated in distilled water. Finally, the polymer was dried in freeze dryer for 24 h (20, 34-38).
Polymer characterization
The chemical structure of polymer was confirmed by FT-IR and 1H NMR spectra. 1H NMR was recorded on a Bruker DRX-300 Avance spectrometer (300 MHz) with CDCl3 as a solvent. The molecular weight of the resulting polymer was also determined by 1H NMR. The thermal transitions of the polymers were observed with a differential scanning calorimeter (DSC) at a heating rate of 20 K/min over the temperature range of 0 to 800 ºC. Phase transitions and enthalpy were studied by differential thermal analysis (DTA) and finally, thermal gravimetric analysis (TGA) was used to evaluate the thermal stability of a polymer over the temperature range of 0 to 800 ºC (39, 19, 40, 21, 41 and 42).
Hydrolytic degradation tests
Polymer degradation in phosphate buffered saline (PBS) at 37 ºC was characterized over 8 week period. To measure polymer hydrolytic degradation, polymer was weighed and immersed in 10 mL PBS (pH = 7.4) at 37 ºC. Samples were taken every week and weighed after washing with fresh PBS and then drying in a freeze dryer for 4 days. The weight remaining was calculated as weight remaining (%) = 100 × W2/W1
Where W1 and W2 are the weights of polymer before and after degradation, respectively
Biocompatibility test of polymer
Human Skin Fibroblast Foreskin of a male newborn (HNFF-PI8) cells were grown in 50-mL cell-culture flasks with Dulbecco’s modified Eagle’s medium (DMEM, Gibco) supplemented with 10% fetal bovine serum (Gibco), 0.3 mg/mL of Lglutamine (Gibco), 0.05 mg/mL of ascorbic acid, 3.7 mg/mL of NaHCO3 (Sigma), and 100 Units/mL each of penicillin and streptomycin. After obtaining adequate confluence, the cells were detached by trypsin and counted. Then the cells were seeded onto tissue culture plate (TCP) as control and polymer films, placed in a 24-well plate with the density of 1×10⁸ cell per well and cultured with Dulbecco›s modification of Eagle›s medium (DMEM) containing 15% fetal calf serum (FCS) supplement (19, 40 and 49). After cell culturing for 1 to 11 days, the viability and proliferation of fibroblast cells was determined by MTT (3-[4, 5-dimethylthiazol-2-yl]-2,5 diphenyltetrazolium bromide) assay. Firstly, 5 mL of MTT solution (5 mg/mL) were added to the culture wells and they were incubated at 37 °C and 5% CO2 for 4 h. The upper medium was removed cautiously and the intracellular Formosan was solubilized by adding 2 mL DMSO to each well. The absorbance of produced Formosan was measured at 570 nm with a spectrophotometer (Convergys) (21).
Results and Discussion
Ring-opening polymerization of CL/LA
Polymer was synthesized by the ring-opening polymerization of CL and LA with pentaerythritol as an initiator and Sn (Oct)2 as a catalyst. The [CL]/[LA] molar ratio was 1/1, and 1,4-butane diisocyanate (BDI) with ethylenediamine used as a chain cross linker. BDI was chosen as the diisocyanate upon which the hard segment was constructed since it would be assumed to yield ethylenediamine, a polyamine that is necessary for cell growth and differentiation, following complete degradation (50). Figure 2(a) shows the typical 1H NMR spectrum of CL/LA prepolymer. Calculations based on the 1H NMR spectrums represent the molecular weight of 8578 g/mol for the prepolymer.
Synthesis and characterization of CA/LA prepolymer and PU polymer
1H NMR characterized the composition and relative component molecular weights for C-[P(CL-b-LA)]4 and C-[P(CL-b-LA)-N=C=O]4. Measurements were made at room temperature with chloroform as a solvent and a polymer concentration of approximately 15 mg/mL. Figure 1(b) shows the 1H NMR spectra of the polymer network. The H signals of repeating methylene units adjacent to a carbonyl group in PCL block appear in δ = 2.28 ppm, OCOCH2 (b), δ = 4.05 ppm, CH2O-CO (f), also in PLA block: δ = 5.16 ppm related to CO-CH(Me)OH (g) and OH group in δ = 4.86 ppm as a broad signal were quite distinguishable for the 1H NMR spectra of prepolymer.
The integral ratio of these proton signals were found to be in good agreement with the proposed structure of prepolymer. As showed in Figure 1(b), the 1H NMR of PU network in comparison to prepolymer (Figure 1(a)) confirmed the new appeared signals in spectra as follow: δ = 3.40 ppm, CH2-NH and CH2-NH2 (j), δ = 2.32 ppm for CH2-CH2NHCO (k), a broad signal at δ = 4.36 ppm for NH2 terminal (l).
Figure 2. shows the FT-IR spectra of the prepolymer (a) and polymer network (b). The broad absorption band of OH stretching vibrations for prepolymer at 3340 cm-1 disappeared for polymer. New absorption bands of the NH and NH2 stretching vibrations and NH bending vibrations appeared at 3400 and 1460 cm-1 for polymer, respectively. These results suggest that the reaction of the hydroxyl group of prepolymer and the isocyanate group of BDI proceeded smoothly to generate the polymer network by urethane linkages.
Table1
Thermal properties of CA/LA prepolymer and PU polymer
| Samples | Tm Ċ | Tg (Ċ) |
|---|---|---|
| CA/LA prepolymer | 339.5 | 58.1 |
| PU polymer | 326.9 | 151.6 |
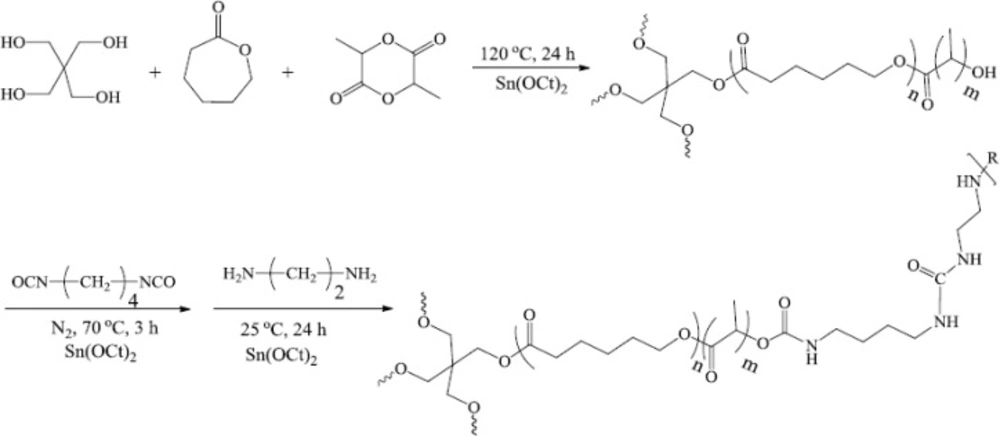
Figure 1
Typical 1H NMR spectrum of (a) CL–LA prepolymer and (b) polymer network
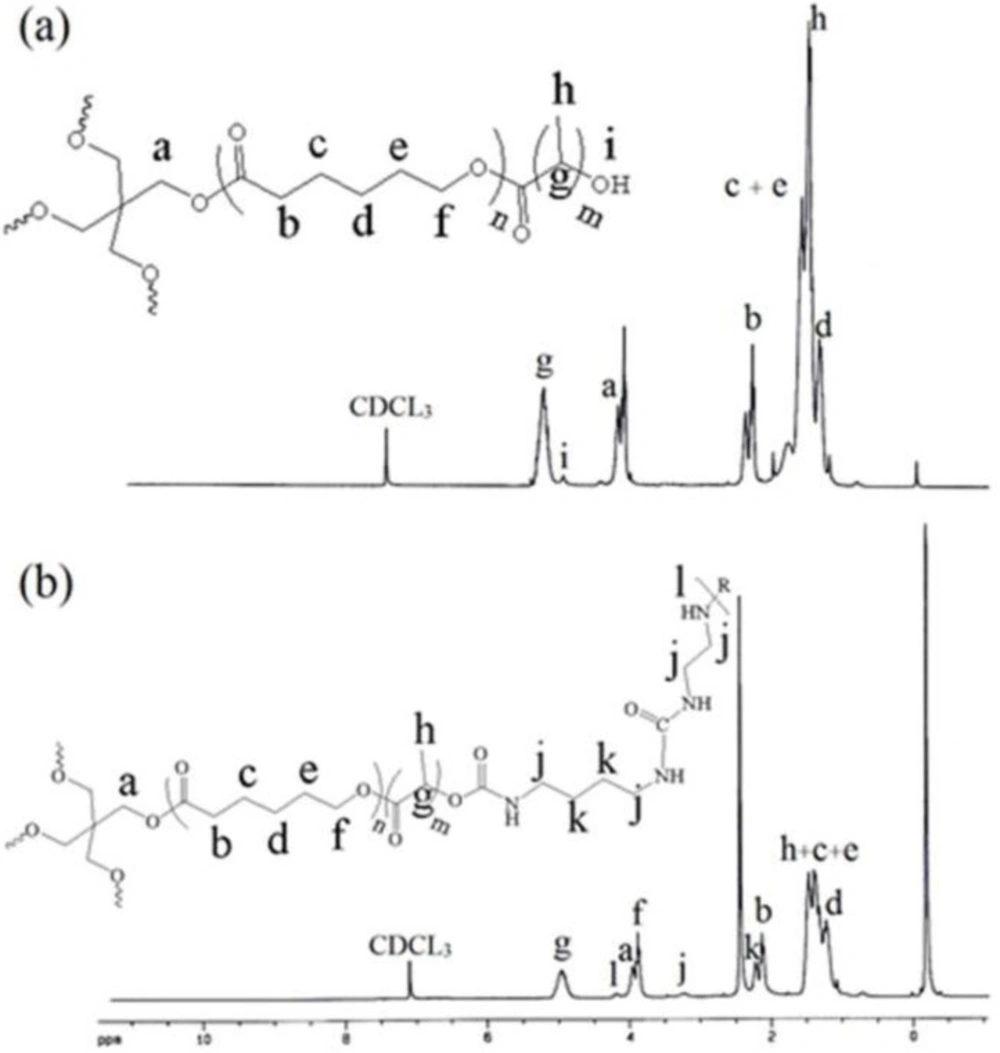
Figure 2
Infrared spectra of the (A) CL/LA prepolymer and (B) polymer network
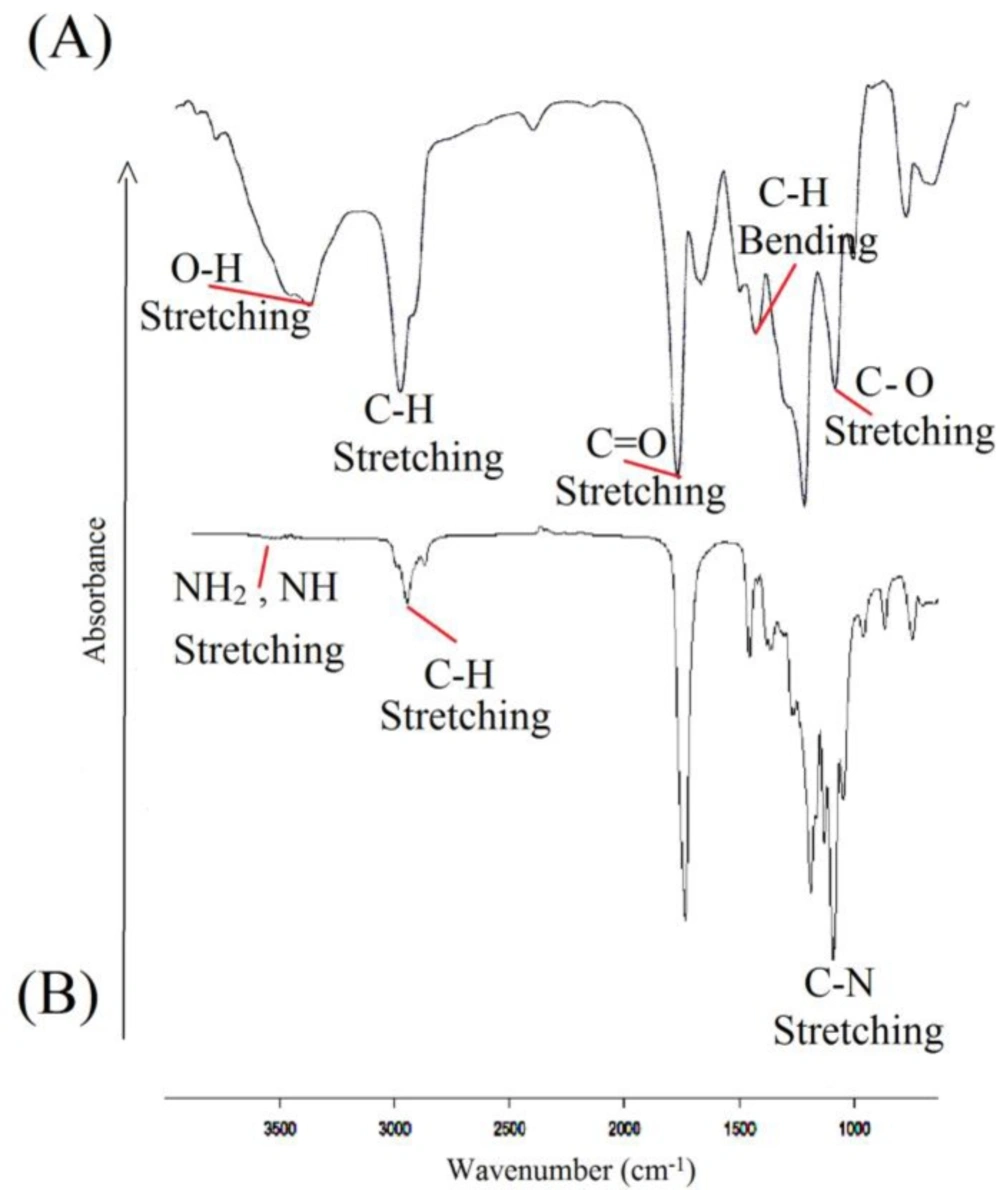
Figure 3
TGA analysis for (A) CL/LA prepolymer and (B) PU polymer
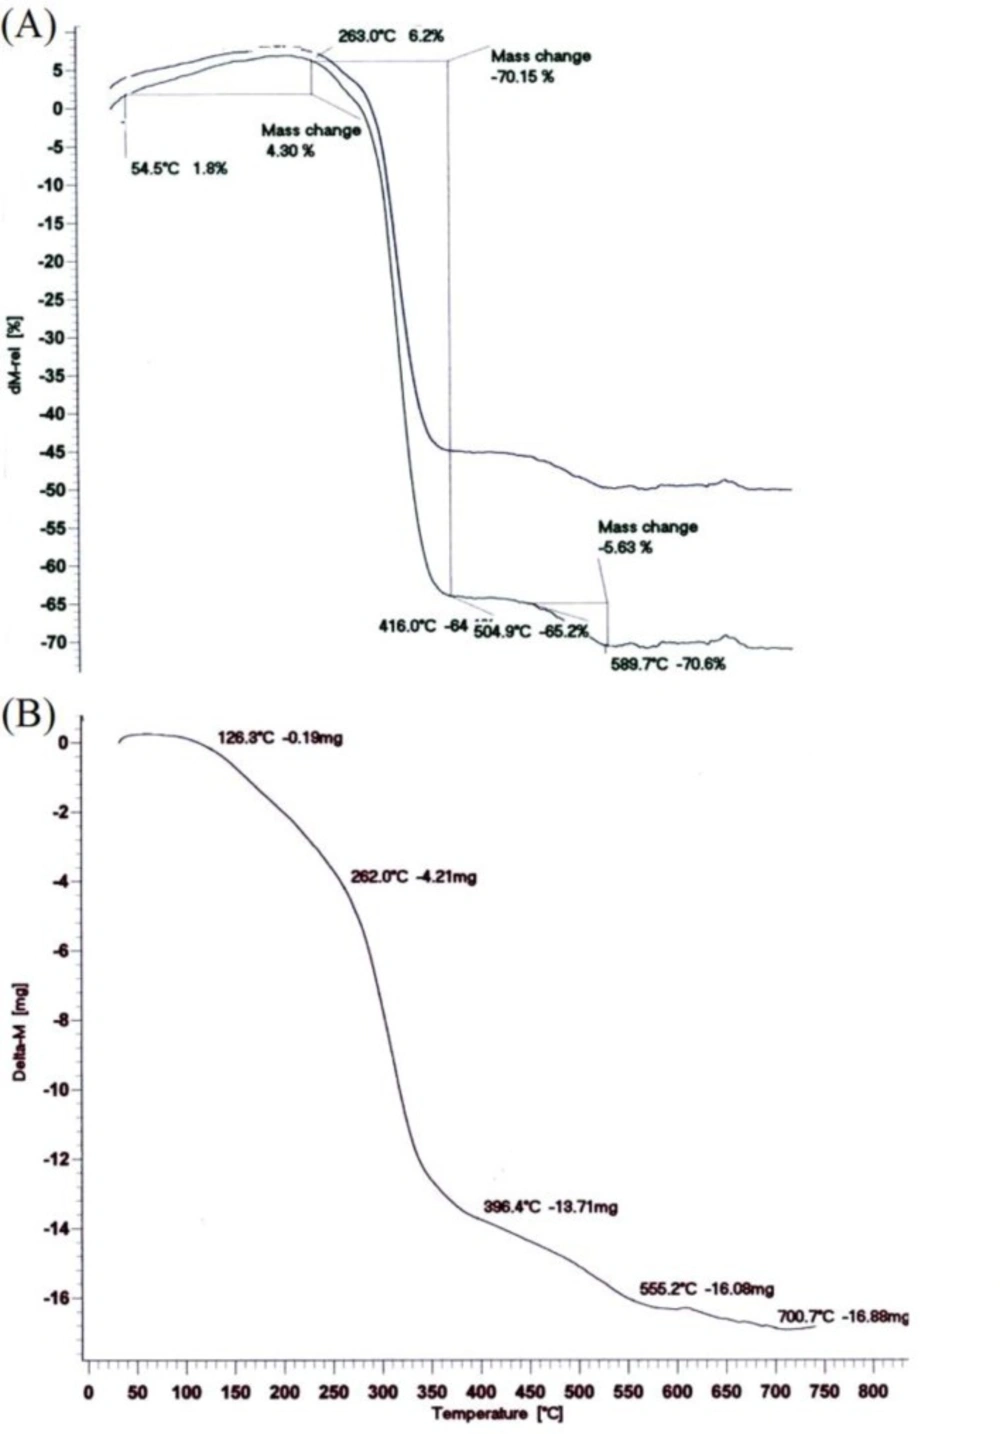
Figure 4
Thermal analysis of DSC for (A) CL/LA prepolymer, (B) PU polymer and DTA for (C) CL/LA prepolymer, (D) PU polymer
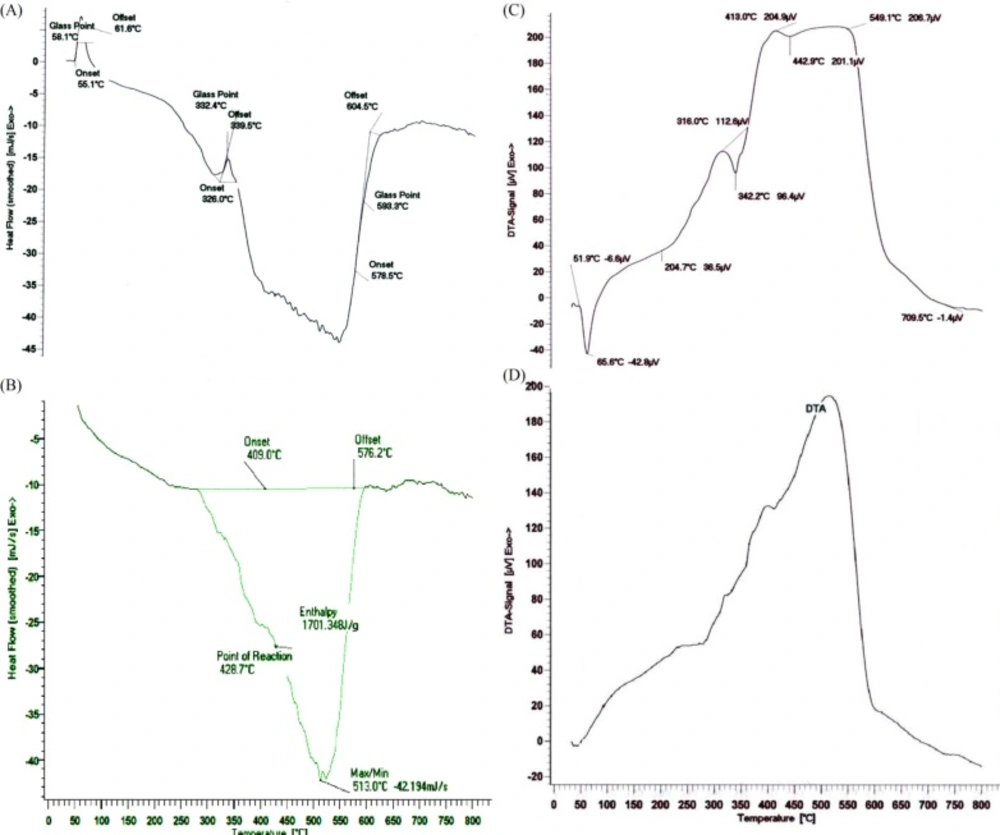
Figure 5
Weight loss of PU network during hydrolytic degradation at 37 ºC
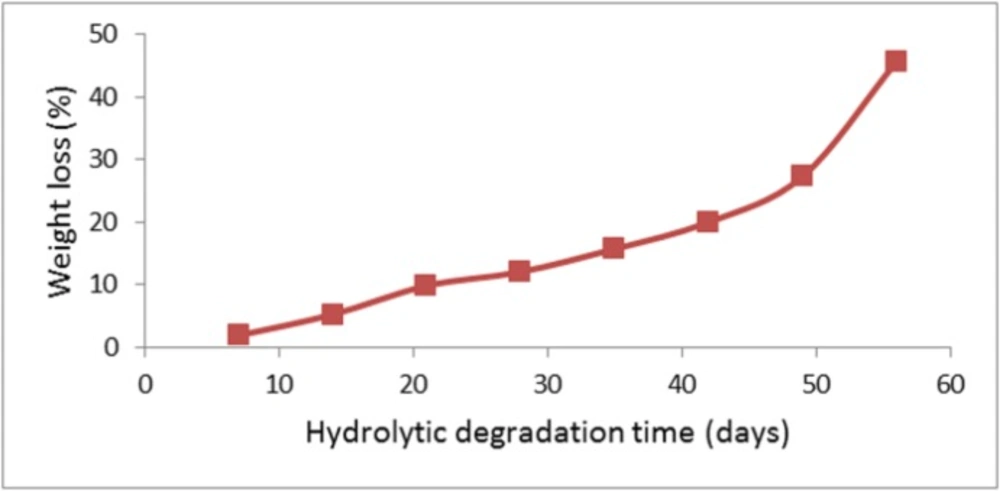
Figure 6
FT-IR spectra of PU network degradation, (a) PU powder, (b) after 2 weeks and (c) after 6 weeks
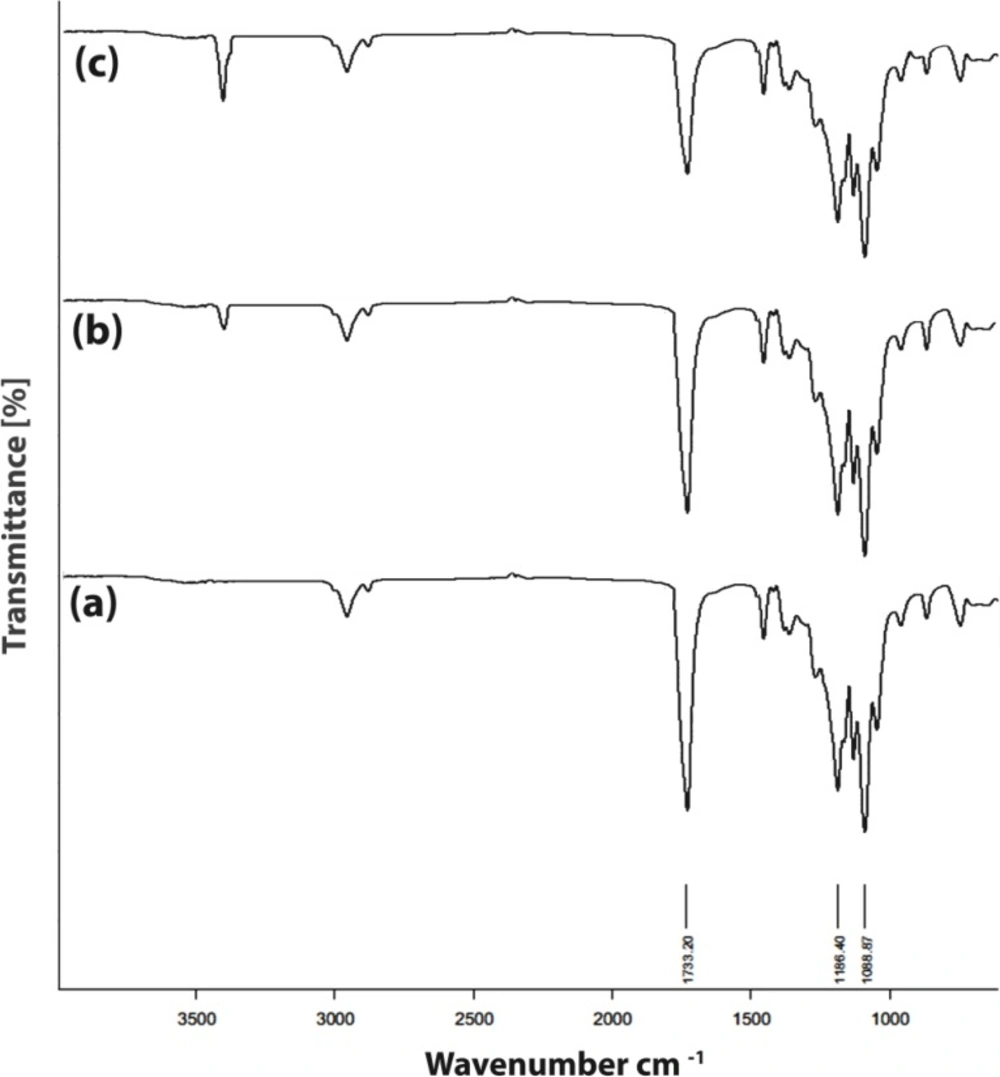
Figure 7
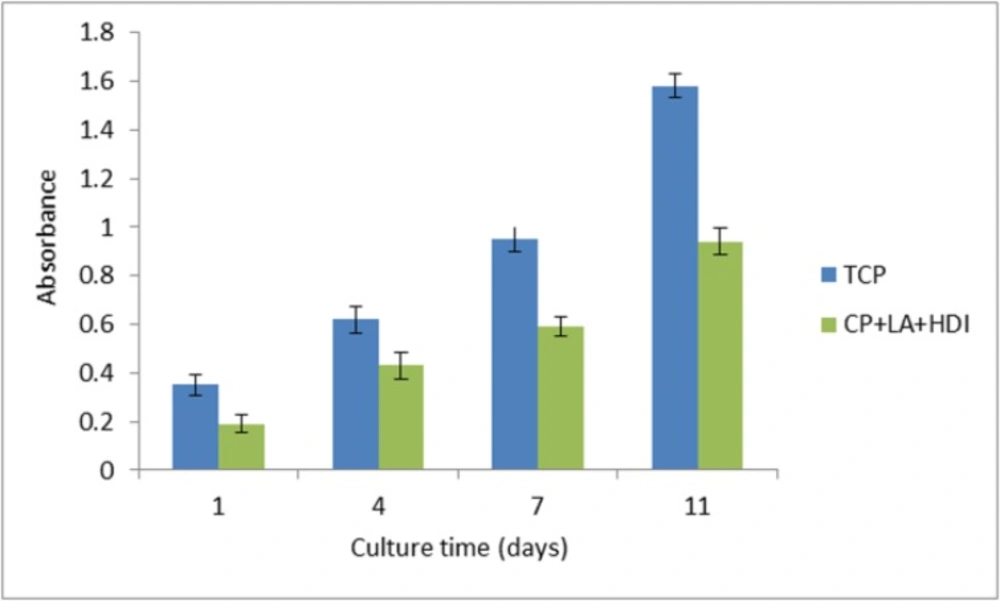
Cell adhesion assay of HNFF-PI8 cells on PU polymer. Absorbance at 570 nm is represented for progressive culture times. Culture plastic was used as a control. Data are expressed as means of a representative of three similar experiments carried out in triplicate
Scheme 1
Synthetic scheme of the biodegradable polymer network
Temperature changes in the TGA analysis make changes in the polymer mass. In fact, the results are restricted to the decomposition reactions, oxidation and physical processes such as evaporation. According to the Figure 3(a). a volume increase is observed in the range of 50-260 ºC, which represents an oxidation. The diagram shows three stages of degradation. In the first stage, the LA degradation is observed up to 416 ºC and in the second one; there main LA and the oxides which were formed on initial temperatures are destroyed in the range of 416-589 ºC. Also, the CP degradation finally occurred above 589 ºC. As TGA spectrum of the polymer shows in Figure 3(b), there are three steps of weight lose. The weight loss in the timeframe of 100-150 °C was due to desorption of water molecules from the surface which was estimated that to be about 20%. In the timeframe of 180-370 ◦C, weight loss took place in different rate that was attributed to the degradation and decomposition of the polymer (51, 41, 42, 36, 52, 38 and 20).
The thermal parameters of the synthesized PU network were determined by DSC with typical curves shown in Figure 4 (a and b). The glass transition temperature, Tg, was considered as the point of the DSC scan inflection. At this temperature, as a result of starting a matched movement of large segments of the polymer molecules, the disfigured polymer compositions become rubbery and elastic. Based on the initial curves, enthalpy will not change with heating to a certain temperature, because the plastic deformation process does not involve heat absorption or diffusion, but due to changes in heat capacity, the base line will change. Thus, according to the enthalpy changes which are equal to zero, peaks will not be achieved during this transition.
The peak temperature, which is a sign for the material identification, in the Figure 4(c) is about 425 ºC. The peak shape indicates the type of thermal event which has appeared. Changes in crystal structure and melting emerge as a sharp peak which is around 330 ºC for prepolymer. The thermal decomposition and chemical reactions occur in a broad peak. As is clear from Figure 4(d), the polymer is decomposed in the temperature range 400-600 ºC. According to the spectrum obtained for the PU polymer, the peak temperature is about 520 ºC. Polymer begins to melt at 326 ºC. Also in the temperature range from 360 to 620 ºC, we have the phenomenon of polymer degradation.
The results of thermal analyzes indicate the melting point and the glass temperature of the CA/LA prepolymer and PU polymer which are given in the Table 1.
Hydrolytic degradation of the PU
The hydrolytic degradation rates of PU network were determined by measuring its weight loss during its hydrolytic degradation. Figure 5. shows the hydrolytic degradation of PU network at 37 ºC. The polymer exhibited progressive mass loss over the 8 week period ranging from 1.90% to 45.66%. The chemical structure of PU network was confirmed by FT-IR spectra recorded. It was said that the hydrolytic degradation rate of aliphatic polyesters relies on the morphological structure, crystallinity, size and form of the crystallite, etc. (43). Since water molecules can diffuse into the amorphous area of the polymer without difficulty, the hydrolytic degradation happens in the amorphous area rather than the crystalline area. It was found that the presence of LA units of PU network reduced its crystallinity and resulted in the improvement of its hydrolytic degradation.
FT-IR spectra for the degradation of the polymer after 2 and 6 weeks in PBS are shown in Figure 6. The peak at 1733 cm-1 corresponds to ester and urethane stretching vibrations (44). The results of FT-IR analysis show the reduction in the peaks intensity which is caused by polymer destruction. As is clear, a sharp decline in the intensity of peaks, especially the peak of the ester groups, can be seen after six weeks. This indicates the flexibility of polymer degradation with time. This observation implies that the PU network degrades by hydrolysis of ester linkages to yield hydroxyl acids.
Biocompatibility of polymer
Cell proliferation on the PU polymer and tissue culture plate (TCP) was measured by MTT solution (5 mg/mL). The MTT assay is established on the reduction of the yellow tetrazolium salt to purple formazen crystals by dehydrogenase enzymes emitted from the mitochondria of metabolically active cells. Figure 7. shows the viability graph of the cells cultured on the polymer and tissue Culture plate (TCP) as control. After 1, 4, 7 and 11 days of cell seeding in 24-well dish, the original medium was removed and 100 μL fresh medium and 10 μL MTT solution were added to each well. After 4-hour incubation at 37 ºC in 5% CO2, MTT solution from each well was carefully removed and replaced by 40 μL DMSO for each well. Then the absorbance of solution was measured at 570 nm.
Conclusion
The polyurethane (PU) polymer was synthesized from ɛ -caprolactone and lactide with using a ring opening polymerization and characterized by different analysis such as 1H NMR and FT-IR. The degradation rate of polymer was evaluated at a controlled condition and the results showed that the decomposition products were non-cytotoxic. The PU polymer also supports the attachment and proliferation of HNFF-PI8 cells. According to these suitable properties, the PU polymer has a great potential as biodegradable scaffolds for soft tissue engineering applications.