Chemicals
Perindopril erbumine was supplied by Bachem, (serial number L-2780-004-020). Acetonitrile (Merck, Germany) and methanol (Merck, Germany) were HPLC grade. All other chemicals were of analytical reagent grade. Potassium dihydrogen phosphate (KH2PO4, M = 136,09 g/mol) and sodium chloride were obtained from POCH (Gliwice, Poland). Oxymethazoline were purchased from Sigma-Aldrich, USA. Water used throughout the study was freshly bidistilled.
Instruments
The chromatographic separation was achieved using LiChroCART® 250-4 HPLC-Cradridge column, LiChrospher® 100 RP-18 (5 µm) (Merck, Germany), which worked at ambient temperature. Entire chromatographic system consisted of a Shimadzu LC-6A Liquid Chromatograph pump with a 7725 Rheodyne value injector 20 µL fixed loop equipped with a Shimadzu SPD-6AV UV-VIS Spectrophotometric Detector. The detector was set at 215 nm and peak areas were integrated by Shimadzu C-R6A Chromatopac integrator.
Solutions
The applied mobile phase consisted of acetonitrile-phosphate buffer (0.001 mol/L, adjusted to pH 2 with orto-phosphoric acid) (70:30, v/v). It was filtered through a filter 0.22 µm and degassed by ultrasound prior to use. Oxymethazoline was dissolved in methanol at the concentration of 0.025 mg/mL served as the internal standard (I.S.) applied throughout the study. Aqueous phosphate buffer was prepared by dissolving 68.1 mg of KH2PO4 in 450 mL of bidistilled water. It was adjusted to pH 2.0 using phosphoric (V) acid (85%) and completed to 500 mL with bidistilled water.
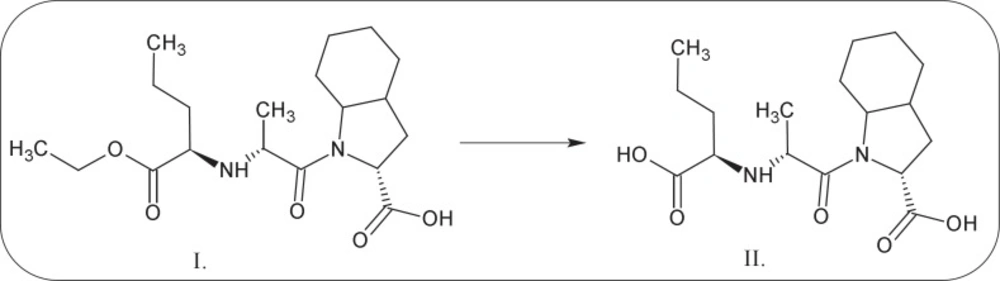
Conversion perindopril (I) to perindoprilat (II).
RP-HPLC chromatogram for PER (2), its degradation product (1) and internal standard (3) stored at RH = 76.4%, T = 363 K.
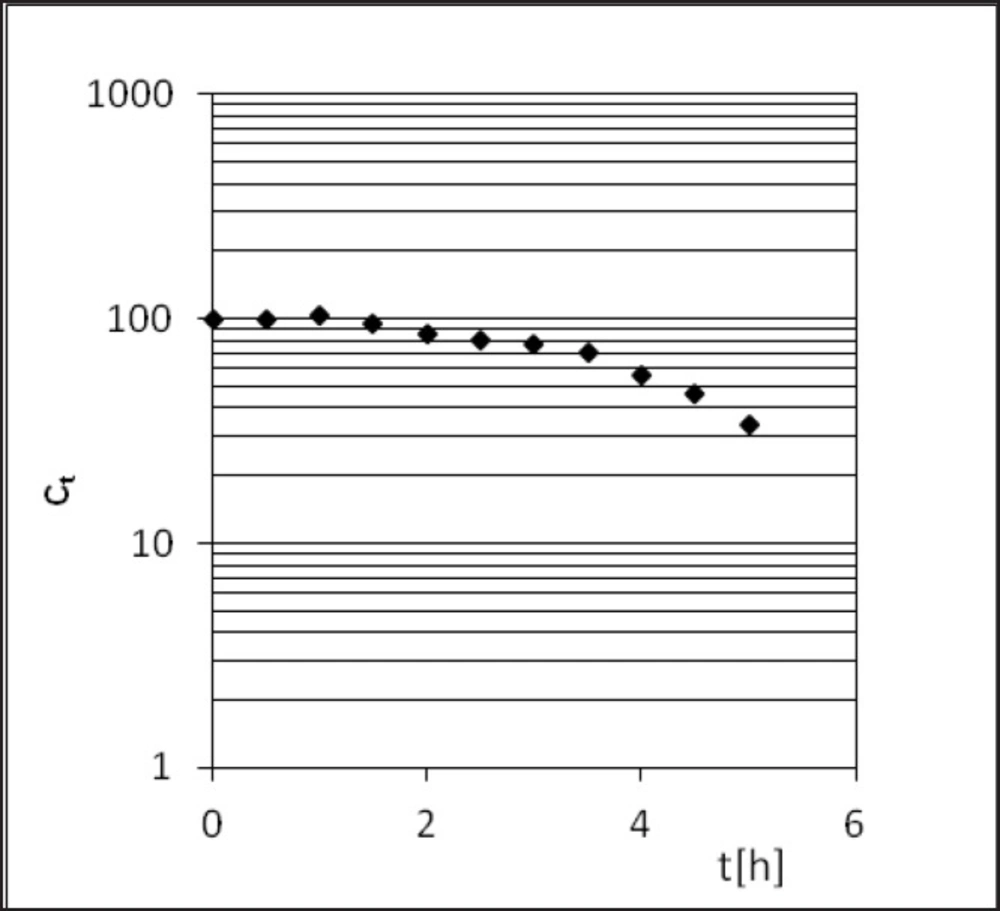
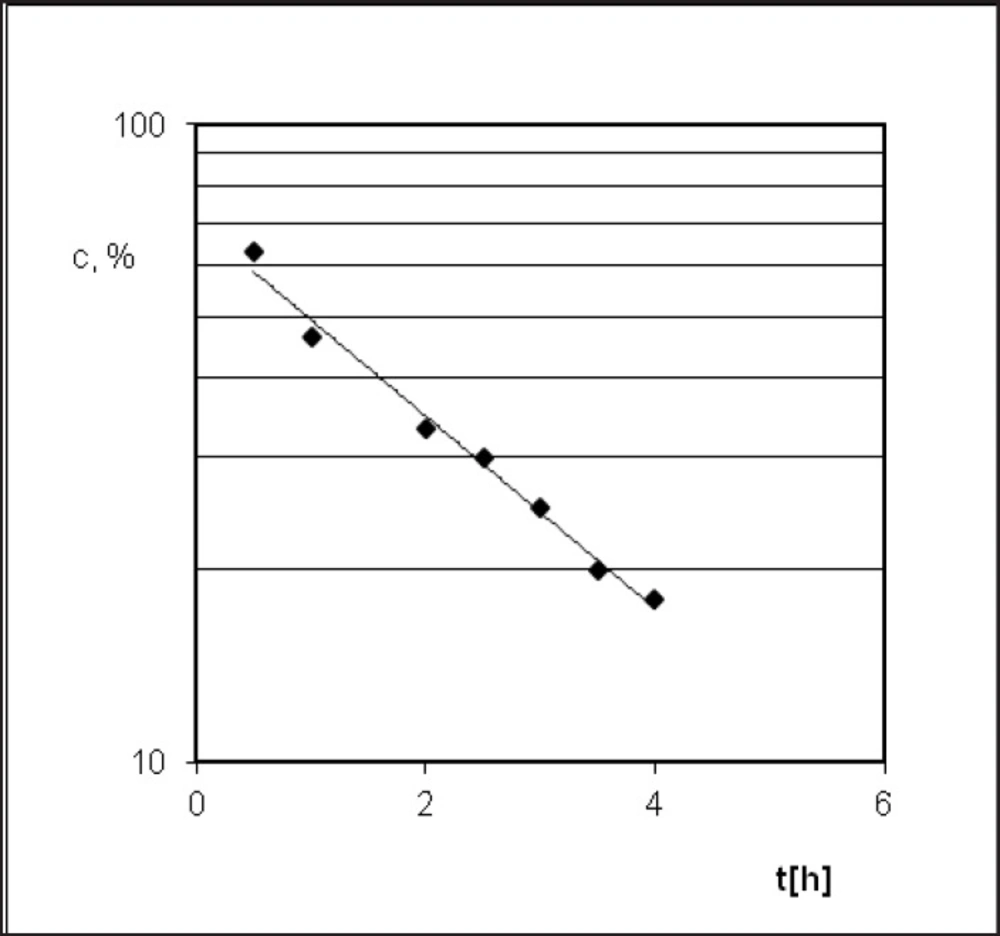
Semi-logarithmic diagram of PER decomposition during the stress test under conditions of T = 363 K and RH = 76.4%.
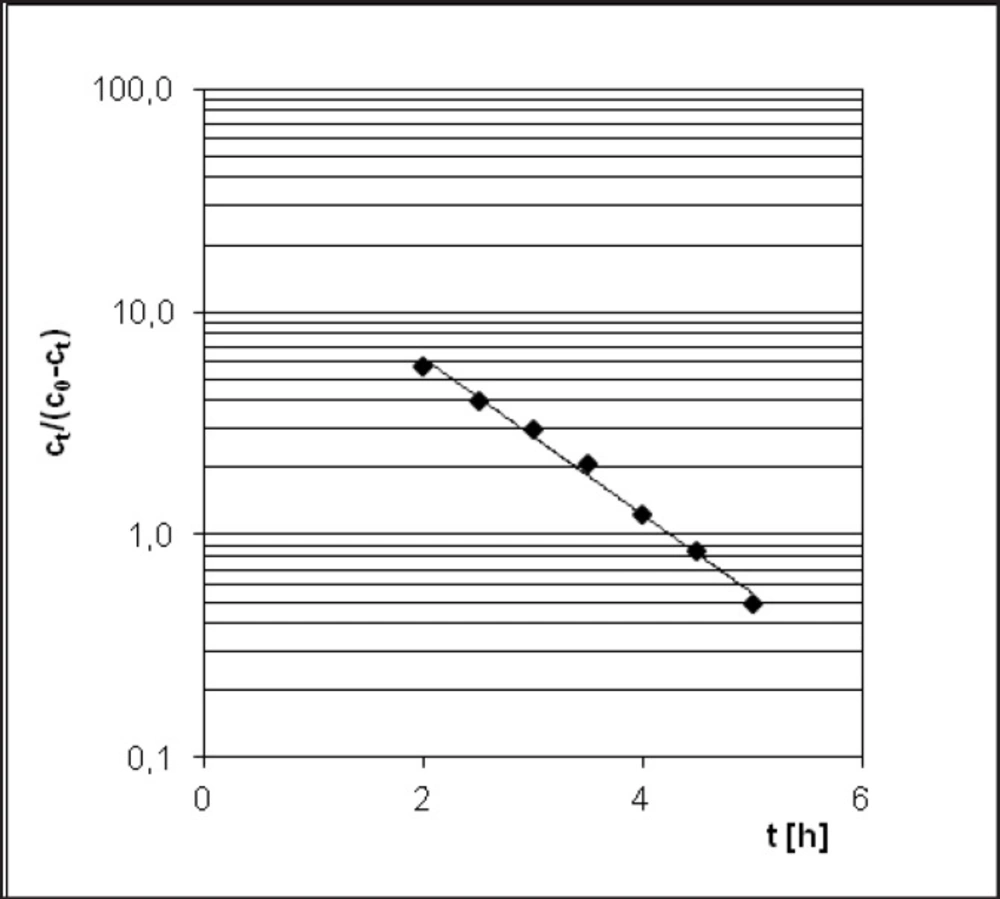
Prout-Tompkins transformation of PER decomposition diagram
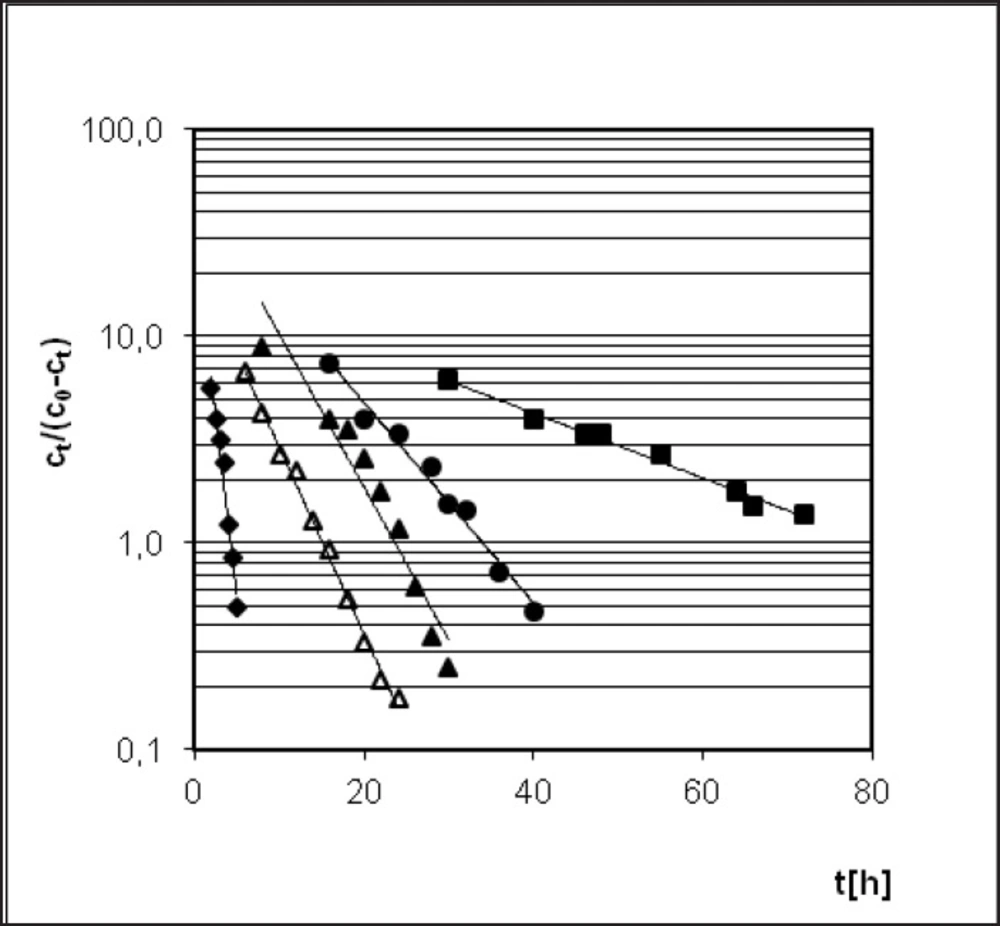
Semi-logarithmic degradation profile of PER expressed by Prout-Tompkins equation (acceleration stages of the reaction) – the influence of variable temperatures: 333 K (), 343 K (), 348 K (), 353 K (∆) and T = 363 K () in the stable value of air humidity 76.4%.
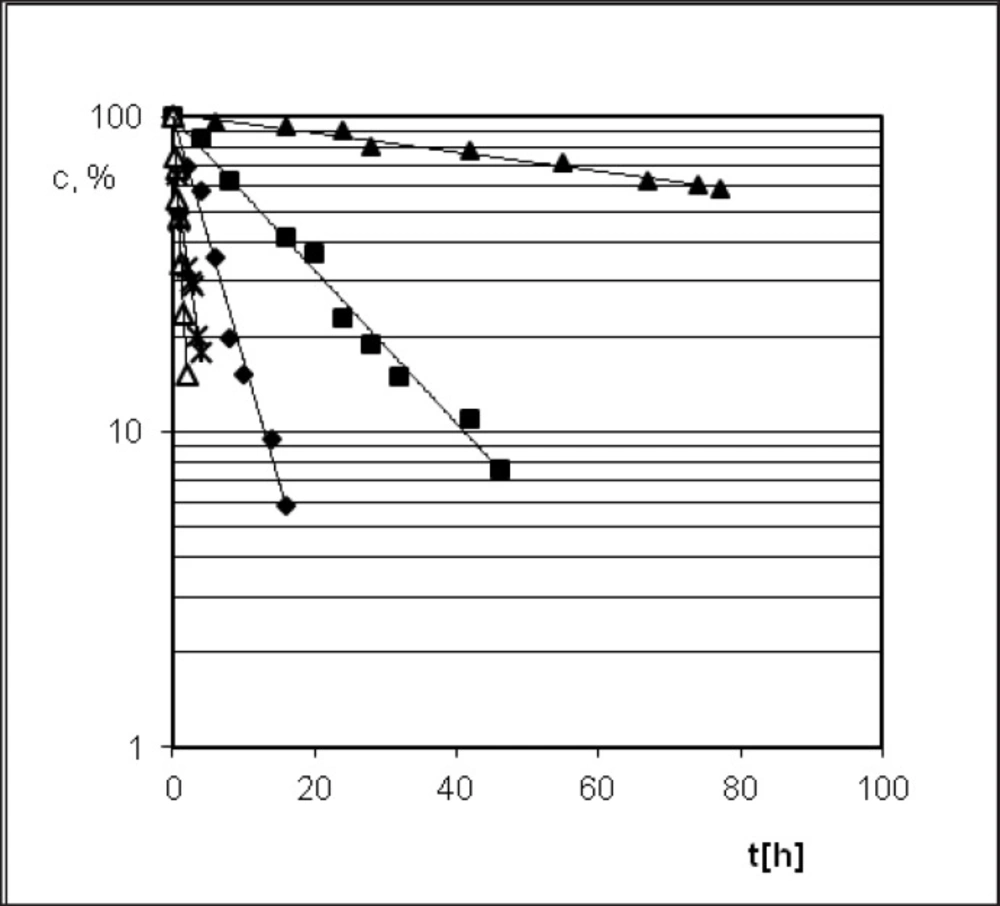
Semi-logarithmic decomposition curves in RH = 0%, where () is PER concentration during the stress test in temperature 383 K
Semi-logarithmic decomposition curves in RH = 0%, where (▲) is PER concentration during the stress test in temperatures: 343 K, ()353 K, ()363 K, (x) 373 and (∆) in 383 K
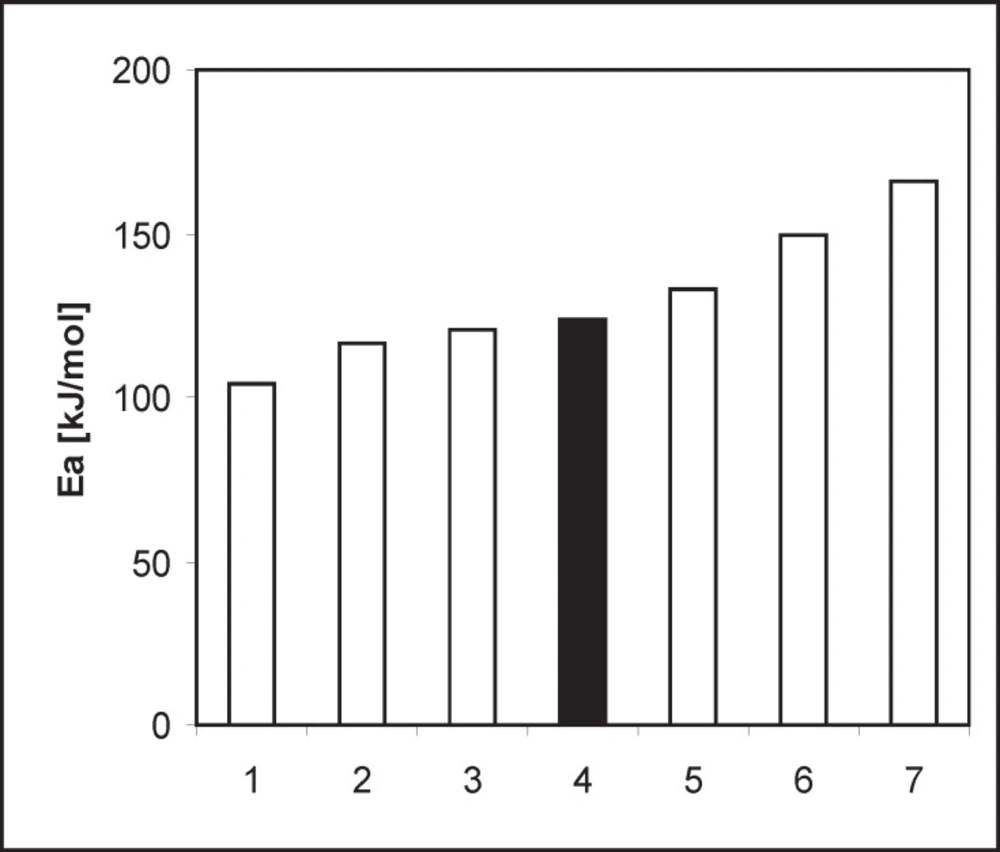
Comparison of the Ea of the decomposition reaction dicarboxylic ACE-I in the solid phase
| Parameters | Results |
|---|
| Linearity range (mg/mL) | 0.04 – 0.4 |
| Regression equation y = ax | |
| Slope a ± Δa | 2.706 ± 0.09 |
| Standard deviation of the slope (Sa) | 0.043 |
| Standard deviation (SD) | 0.015 |
| Correlation coefficient (r) | 0.998 |
| Limits of detection (LOD) | 0.018 |
| Limit of quantification (LOQ) | 0.055 |
| Precision - low; high (%) | 1.55; 2.39 |
| Recovery (%) | 99.86 ± 0.5 |
| T | k ± ∆k [1/s] | r | linear Arrhenius relationshipf(1/T) = lnk | Thermodynamic parameters |
|---|
| 333 K | (1.005 ± 0.115) 10-5 | -0.993 | a = -12027.594 ± 2583.648 | Ea[kJ/mol]124.22 ± 14.12 |
| 343 K | (3.101 ± 0.415) 10-5 | -0.991 | Sa = 1027.97 | |
| 348 K | (4.727 ± 1.093) 10-5 | -0.966 | b =24.588 ± 8.21 | ∆H≠ [kJ/mol]121.74±14.39 |
| 353K | (5.768 ± 0.313) 10-5 | -0.997 | Sb = 2.957 | |
| 363 K | (2.256 ± 0.359) 10-4 | -0.987 | r = -0.989 | ∆S≠[J/mol∙K]18.974±133.67 |
| T | k ± Δk [1/s] | r | linear Arrhenius relationship f(1/T) = lnk | Thermodynamic parameters |
|---|
| 333 K | (1.931 ± 0.217) 10-6 | -0.991 | a = -15363.55 ± 4835.54 | Ea[kJ/mol] 127.73± 40.20 |
| 343 K | (1.569 ± 0.168) 10-5 | -0.992 | Sa = 1741.91 | |
| 348 K | (4.954 ± 0.555) 10-5 | -0.993 | b = 32.05 ± 13.35 | ΔH≠ [kJ/mol] 125.26±42.68 |
| 353K | (9.537 ± 2.028) 10-5 | -0.982 | Sb = 4.80 | |
| 363 K | (2.601 ± 0.353) 10-4 | -0.990 | r = -0.981 | ΔS≠[J/mol∙K] 21.62±133.92 |
Pretreatment of samples
After the incubation time each sample was subjected to HPLC analysis in order to measure quantitatively the content of PER in the presence of its degradation product.
Every PER sample (10.00 mg) after the process of incubation was precisely and quantitatively transferred to a volumetric flask and subsequently filled up to 25.0 mL volume with methanol. The volume of 1.0 mL of solution obtained from each analyzed sample was mixed with 1.0 mL volume of a 0.025 mg/mL internal standard solution. The solution was subjected to HPLC.
Decrease in PER concentration in the solid state (c%) after incubation period was calculated with respect to the 0.4 mg/mL pure PER methanolic solution, considered as c = 100%, which is an equivalent of 10.00 mg pure PER sample dissolved in methanol (up to 25.0 mL) in the same way as all samples were prepared.
Thermodegradation experiments
A kinetic study on decomposition process of PER in solid state was carried out under isothermal conditions of increased constant relative humidity RH = 76.4% at the temperatures ranging from 333 K to 363 K and the lack of moisture RH = 0% at the temperatures 343–383 K.
Each sample consisted of 10.00 mg weighed PER in substance placed in glass, amber, uncapped vials. Prepared samples were exposed to the conditions described above. The constant, desired temperature appropriate for the test conditions (333, 343, 348, 353, 363 K for RH = 76.4% and 343, 353, 363, 373, 383 K for RH = 0%) was provided by heat chambers with the temperature control accuracy ± 1.0 K.
Appropriate relative humidity level was obtained in closed desiccators containing saturated solution of sodium chloride, which remained in contact with excess of solid salt throughout the study, obtained humidity 76.4%. The conditions of dry air (RH = 0%) were achieved by placing the sand baths in heat chamber set at the appropriate temperature. In order to equilibrate kinetic test conditions, prepared desiccators and sand baths had been put in the heat chambers at relevant temperature 24 h before the beginning of the study.
The samples were randomly removed from desiccators (RH = 76.4%) and sand baths (RH = 0%) at required time points, cooled to ambient temperature and analyzed for the extent of PER decomposition (
18).
Irradiation with e-beam radiation
Approximately 50.00 mg of perindopril was placed in 4 mL glass jars closed with a plastic stopper and irradiated to 25, 50, 100, 200 and 400 kGy with the e-beam from a linear electron accelerator Elektronika 10/10. The energy of electrons was 9.96 MeV and the current intensity amounted 6.2 μA (
19-
21).
Calculation of radiation yield
Radiation yield is defined as a number of molecules of reactant or newly formed products in relation to the amount of energy absorbed by the system. Radiation yield of PER degradation (G-PER) is defined as a ratio of decreasing number of molecules of PER as a result of irradiation with energy of 100 eV:
G-PER - radiation of perindopril erbumine degradation
x - number of molecules degraded as a result of irradiation with energy of 100eV.
1 kGy = 1000 Gy
1 Gy = 100 rad
1 rad = 6.243 . 1013 eV/g
Radiation yield can be also expressed in the SI units as mol/J (
19-
21).
Photodegradation experiments
10.00 mg of PER was placed in 4 mL glass vials and illuminated with a SUNTEST CPS+ device (Heraeus, Germany). In the photodegradation studies that were consistent with the ICH Q1B guidelines (
12) the following conditions were applied: a 1500 W lamp, a 300–800 nm wavelength range, an ID65 solar filter and an irradiation intensity of 250 Wm
−2, temperature 298 K. Exposure times of 21.6 and 108 h provided an overall illumination of not less than 1.2 million and 6 million lux h, respectively. A 10.00 mg control sample of perindopril in the glass vial was wrapped in aluminium foil.