
Introduction
Experimental
![General structures of 2-arylpyrimidines (A), triazines (A) and thiopyrano[3,2-d]Pyrimidine (B and C).](https://brieflands.com/journals/ijpr/articles/124985/figures/ijpr-16-0910-g001-preview.webp)
General structures of 2-arylpyrimidines (A), triazines (A) and thiopyrano[3,2-d]Pyrimidine (B and C).
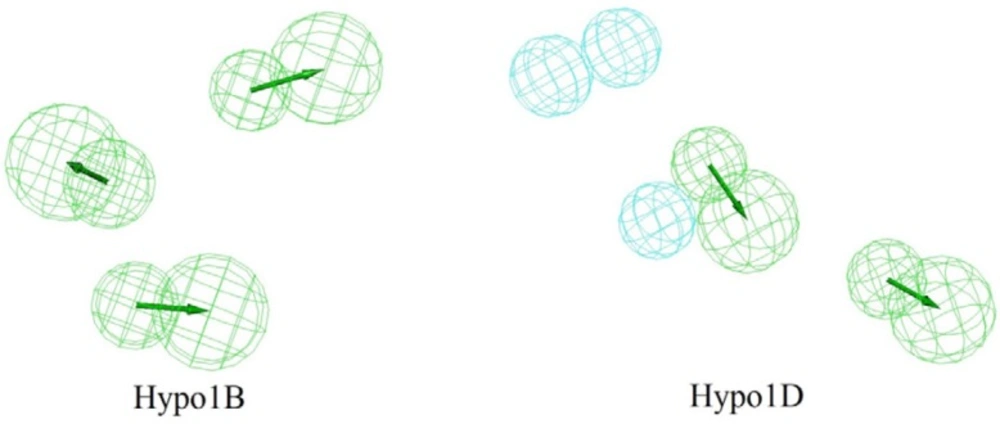
Hypo1B and Hypo1D chemical features with their geometric parameters
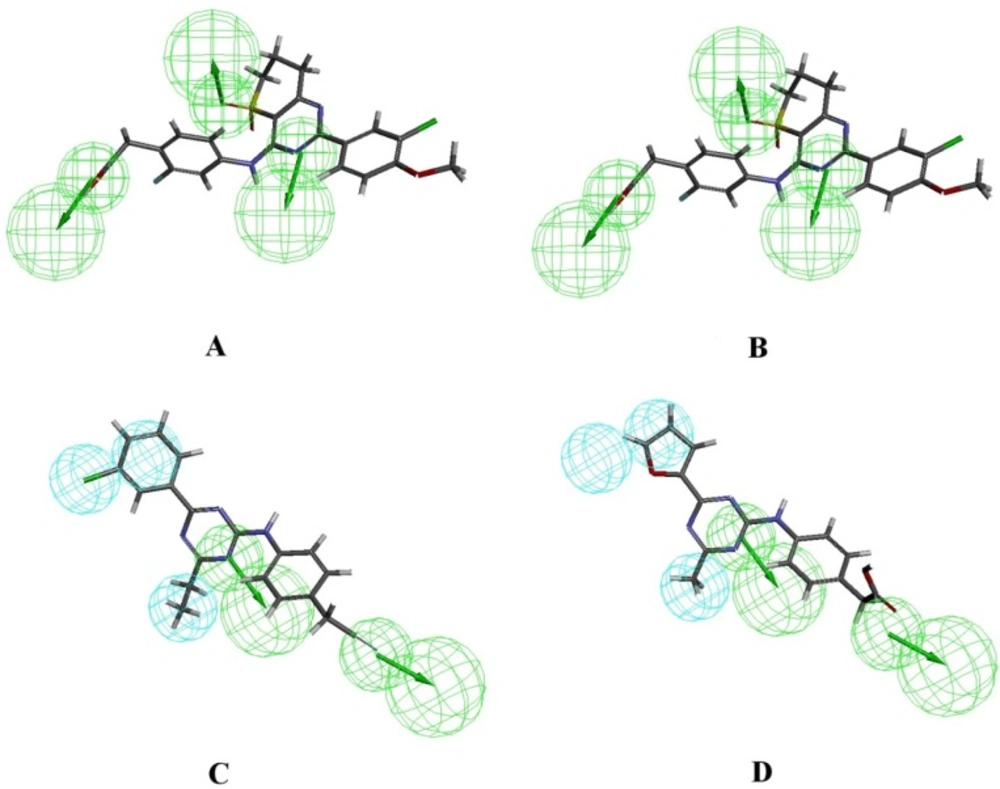
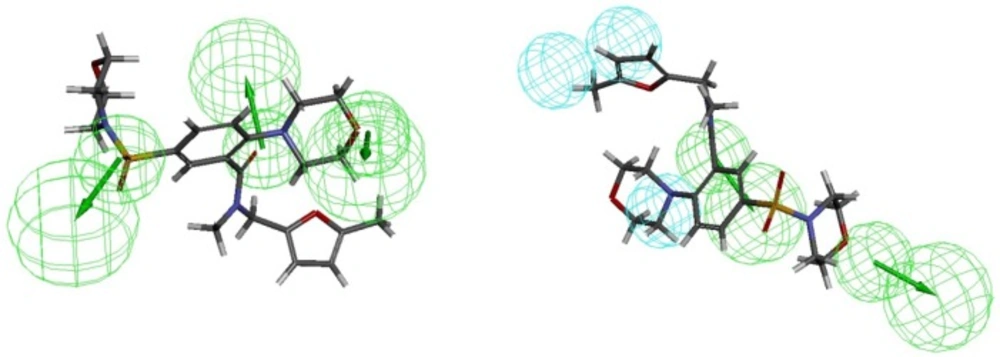
A. Most active PDE4B inhibitor (54b) aligned with Hypo1B, B. Least active PDE4B inhibitor (10) aligned with Hypo1B, C. Most active PDE4D inhibitor (29) aligned with Hypo1D, D. Least active PDE4D inhibitor (10) aligned with Hypo1D
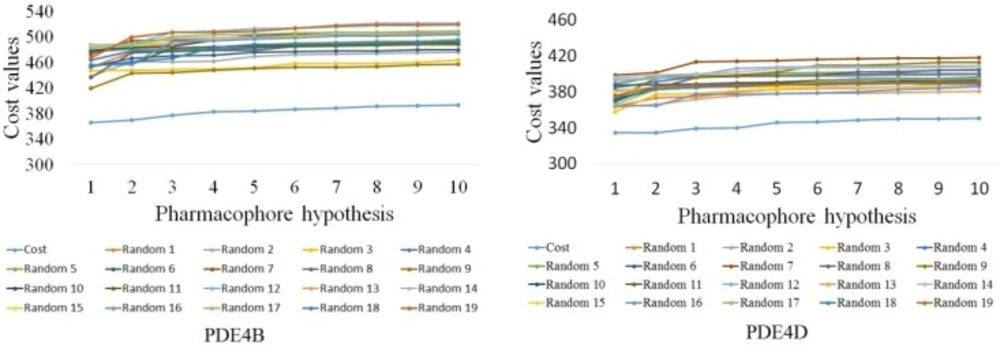
The difference in costs between HypoGen runs and the scrambled runs for PDE4B and PDE4D. The 95% confidence level was selected
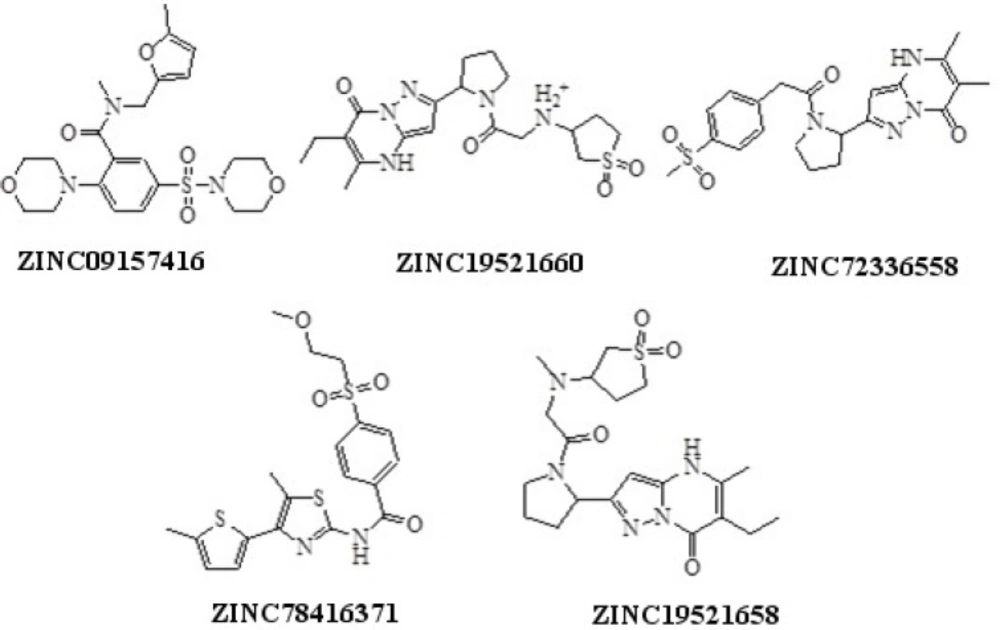
Structures of hits obtained using pharmacophore based virtual screening
Most selective PDE4B inhibitor (ZINC09157416) identified by virtual screening aligned with Hypo1B and Hypo1D
| Hypo no. | Total cost | Cost differencea | RMSb | Correlation | Featuresb | Max fit |
|---|---|---|---|---|---|---|
| Hypo1B | 365.722 | 143.378 | 1.86 | 0.9571 | HBA, HBA, HBA | 5.8678 |
| Hypo2B | 369.858 | 139.242 | 1.89 | 0.9362 | HBA, HBA, H | 5.7607 |
| Hypo3B | 376.722 | 132.378 | 1.93 | 0.9208 | HBA, HBA, H | 5.2594 |
| Hypo4B | 382.828 | 126.172 | 1.97 | 0.9068 | HBA, HBA, H, H | 6.6554 |
| Hypo5B | 383.112 | 125.988 | 1.98 | 0.9054 | HBA, HBA, H | 5.2458 |
| Hypo6B | 386.676 | 122.424 | 1.99 | 0.8972 | HBA, HBA, H | 5.0619 |
| Hypo7B | 387.872 | 121.228 | 2.01 | 0.8933 | HBA, HBA, H | 5.4563 |
| Hypo8B | 391.358 | 117.742 | 2.03 | 0.8862 | HBA, HBA, H | 4.8644 |
| Hypo9B | 391.861 | 117.239 | 2.03 | 0.8858 | HBA, HBA, H | 4.6476 |
| Hypo10B | 393.315 | 115.785 | 2.04 | 0.8815 | HBA, HBA, H | 4.7971 |
Cost difference between the null and the total cost. The values for null cost, fixed cost, and configuration cost are 509.10, 236.38, and 12.53 respectively.
Abbreviations: RMS: root mean square deviation, HBA: hydrogen bond acceptor, HBD: hydrogen bond donor, H: hydrophobic.
| Hypo no. | Total cost | Cost differencec | RMS | Correlation | Features | Max fit |
|---|---|---|---|---|---|---|
| Hypo1D | 334.571 | 164.419 | 1.66 | 0.9563 | HBA, HBA, H, H, H | 8.1515 |
| Hypo2D | 335.16 | 163.830 | 1.66 | 0.9336 | HBA, HBA, H, H | 8.0525 |
| Hypo3D | 339.583 | 159.407 | 1.70 | 0.9247 | HBA, HBA, H | 6.0897 |
| Hypo4D | 340.037 | 158.953 | 1.67 | 0.8712 | HBA, HBA, H, H, | 5.6251 |
| Hypo5D | 346.347 | 152.643 | 1.74 | 0.8341 | HBA, HBA, H, H, H | 6.9568 |
| Hypo6D | 346.670 | 152.320 | 1.70 | 0.8027 | HBA, HBA, H, H, H | 4.5456 |
| Hypo7D | 348.692 | 150.298 | 1.76 | 0.7991 | HBA, HBA, H, H | 6.2123 |
| Hypo8D | 350.222 | 148.768 | 1.77 | 0.7892 | HBA, HBA, H, H | 6.7776 |
| Hypo9D | 350.437 | 148.553 | 1.76 | 0.7554 | HBA, HBA, H, H, H | 6.3886 |
| Hypo10D | 350.729 | 148.261 | 1.74 | 0.7332 | HBA, HBA, H, H, H | 4.8890 |
The values for null cost, fixed cost and configuration cost are 498.99, 231.346 and 12.49 respectively.
| Fit valued | LogIC50 | LogIC50 (predicted) | Errore | |
|---|---|---|---|---|
| 1 | 3.9094 | 8.8099 | 7.8080 | 1.0018 |
| 2 | 5.0896 | 4.0073 | 4.0906 | -0.0832 |
| 4 | 4.4407 | 7.5730 | 6.5847 | 0.9884 |
| 5 | 4.5557 | 5.9480 | 5.3199 | 0.6282 |
| 8 | 4.2395 | 5.4681 | 6.0481 | -0.5800 |
| 9 | 4.0517 | 8.2348 | 8.4804 | -0.2455 |
| 10 | 3.9096 | 9.8392 | 8.8077 | 1.0316 |
| 12 | 3.9090 | 7.2862 | 6.8089 | 0.4773 |
| 14 | 4.0043 | 7.7328 | 6.5895 | 1.1433 |
| 15 | 4.4623 | 6.7393 | 5.5349 | 1.2045 |
| 18 | 4.6695 | 5.5645 | 5.0579 | 0.5066 |
| 19 | 3.8297 | 7.2399 | 6.9917 | 0.2483 |
| 20 | 4.5970 | 5.3936 | 5.2249 | 0.1688 |
| 22 | 4.1433 | 3.8286 | 4.2695 | -0.4409 |
| 23 | 4.2621 | 4.9053 | 5.9959 | -1.0906 |
| 24 | 3.9079 | 4.9053 | 5.8114 | -0.9062 |
| 27 | 5.0484 | 5.4848 | 5.8855 | -0.4007 |
| 28 | 4.5921 | 2.4849 | 2.2360 | 0.2489 |
| 29 | 4.8138 | 5.1060 | 4.7256 | 0.3804 |
| 31 | 4.6269 | 4.2341 | 4.1559 | 0.0782 |
| 32 | 5.1069 | 5.9965 | 5.6508 | 0.3457 |
| 33 | 4.6877 | 6.9939 | 6.0161 | 0.9779 |
| 10a | 4.3958 | 5.7038 | 5.6880 | 0.0158 |
| 12a | 3.9014 | 3.5264 | 4.8266 | -1.3002 |
| 13b | 4.6589 | 4.0431 | 4.0824 | -0.0393 |
| 14a | 4.0112 | 6.5367 | 6.5736 | -0.0369 |
| 14b | 5.2346 | 4.7875 | 4.9567 | -0.1692 |
| 15a | 4.6777 | 4.7875 | 5.0390 | -0.2515 |
| 16b | 4.6630 | 3.4012 | 4.0729 | -0.6717 |
| 17a | 4.6442 | 7.9374 | 7.1161 | 0.8213 |
| 17b | 5.4607 | 2.3979 | 2.5361 | -0.1382 |
| 18a | 3.8934 | 8.2161 | 7.8450 | 0.3711 |
| 18b | 4.9305 | 4.7875 | 4.4568 | 0.3307 |
| 19a | 4.0354 | 6.7569 | 6.5180 | 0.2390 |
| 1b | 5.6617 | 3.2189 | 3.4733 | -0.2544 |
| 20b | 5.1383 | 3.5264 | 3.9785 | -0.4522 |
| 21a | 3.9115 | 5.3471 | 6.8032 | -1.4561 |
| 21b | 4.9923 | 4.9416 | 4.3147 | 0.6270 |
| 22a | 5.0677 | 5.3936 | 5.5410 | -0.1474 |
| 22b | 5.1410 | 4.9416 | 4.9722 | -0.0305 |
| 23a | 4.6139 | 5.0106 | 5.1859 | -0.1753 |
| 24b | 4.5382 | 6.0638 | 5.3603 | 0.7035 |
| 26a | 3.9114 | 6.8459 | 6.8035 | 0.0424 |
| 26b | 5.4570 | 3.7842 | 3.5446 | 0.2396 |
| 27a | 3.9116 | 7.0901 | 6.8031 | 0.2870 |
| 27b | 5.5718 | 3.6376 | 3.9802 | -0.3426 |
| 28b | 5.3524 | 2.3026 | 2.4854 | -0.1829 |
| 29a | 5.1079 | 5.7683 | 5.0485 | 0.7198 |
| 29b | 5.4456 | 5.5215 | 5.2709 | 0.2506 |
| 2a | 3.8825 | 6.0638 | 6.8700 | -0.8062 |
| 2b | 5.0910 | 3.3673 | 3.2873 | 0.0800 |
| 30a | 5.1379 | 5.2470 | 4.6793 | 0.5678 |
| 31a | 5.4163 | 3.5264 | 3.3383 | 0.1881 |
| 31b | 5.5135 | 3.8286 | 3.5145 | 0.3142 |
| 32b | 5.5108 | 2.5650 | 2.3208 | 0.2442 |
| 33a | 5.0896 | 2.7081 | 2.4906 | 0.2175 |
| 33b | 5.5519 | 2.9444 | 3.0262 | -0.0817 |
| 34a | 5.1824 | 1.9169 | 1.8768 | 0.0401 |
| 35a | 5.2004 | 2.7081 | 2.4355 | 0.2725 |
| 35b | 5.4536 | 3.4012 | 3.2525 | 0.1487 |
| 36b | 5.5615 | 2.6391 | 3.0039 | -0.3649 |
| 37b | 5.5723 | 2.1163 | 2.3791 | -0.2628 |
| 39b | 5.6194 | 2.3026 | 2.8707 | -0.5681 |
| 3a | 3.9080 | 4.9416 | 4.8113 | 0.1303 |
| 3b | 4.8032 | 3.0910 | 4.7500 | -1.6590 |
| 44b | 5.5305 | 1.5261 | 2.0753 | -0.5493 |
| 45b | 5.6535 | 2.7726 | 2.7922 | -0.0196 |
| 47b | 5.6493 | 4.1589 | 3.8018 | 0.3571 |
| 48b | 5.4860 | 3.8918 | 3.5778 | 0.3140 |
| 49b | 5.6225 | 2.2925 | 2.8636 | -0.5711 |
| 4a | 3.9099 | 7.1701 | 6.8070 | 0.3632 |
| 53b | 5.5256 | 2.1041 | 2.0866 | 0.0176 |
| 54b | 5.7574 | 1.0986 | 1.3529 | -0.2542 |
| 55b | 5.7462 | 1.7750 | 1.5787 | 0.1962 |
| 8a | 4.0575 | 4.7875 | 5.4670 | -0.6795 |
| Fit value | LogIC50 | LogIC50 (predicted) | Error | |
|---|---|---|---|---|
| 1 | 5.8033 | 7.7407 | 7.1109 | 0.6297 |
| 2 | 5.7524 | 7.5994 | 7.2281 | 0.3713 |
| 4 | 6.3846 | 8.1831 | 8.7724 | -0.5893 |
| 5 | 5.8364 | 6.7627 | 7.0346 | -0.2718 |
| 8 | 5.9387 | 7.0741 | 6.7991 | 0.2751 |
| 9 | 5.4415 | 8.6325 | 8.9440 | -0.3115 |
| 10 | 5.5496 | 10.0105 | 9.6951 | 0.3154 |
| 12 | 5.8037 | 6.5889 | 7.1100 | -0.5211 |
| 14 | 5.7043 | 6.7558 | 7.3388 | -0.5830 |
| 15 | 6.1765 | 6.5876 | 6.2514 | 0.3361 |
| 18 | 5.9054 | 5.5255 | 5.8757 | -0.3502 |
| 19 | 5.6042 | 5.3327 | 5.5694 | -0.2367 |
| 20 | 5.9951 | 5.3891 | 5.6693 | -0.2803 |
| 22 | 6.9164 | 2.9957 | 2.5479 | 0.4478 |
| 23 | 5.6015 | 5.5910 | 5.5755 | 0.0155 |
| 24 | 5.9404 | 5.5910 | 5.7952 | -0.2042 |
| 27 | 6.7011 | 5.3613 | 5.0437 | 0.3176 |
| 28 | 7.6438 | 2.5650 | 2.8729 | -0.3079 |
| 29 | 7.6555 | 1.9459 | 1.8460 | 0.0999 |
| 31 | 6.9078 | 4.1431 | 4.5677 | -0.4246 |
| 32 | 6.6422 | 5.0752 | 5.1791 | -0.1039 |
| 33 | 6.0901 | 4.5644 | 4.4505 | 0.1138 |
| 10a | 5.7511 | 7.3132 | 7.2311 | 0.0822 |
| 12a | 5.6731 | 4.4067 | 4.4106 | -0.0039 |
| 13b | 5.6202 | 6.5221 | 6.5325 | -0.0104 |
| 14a | 5.5703 | 7.7832 | 7.6474 | 0.1358 |
| 14b | 5.7270 | 6.9078 | 7.2865 | -0.3788 |
| 15a | 5.6576 | 7.1701 | 7.4463 | -0.2761 |
| 16b | 5.7635 | 5.6699 | 5.2026 | 0.4673 |
| 17a | 5.9350 | 9.3927 | 9.8075 | -0.4149 |
| 17b | 5.8604 | 5.6348 | 5.9794 | -0.3446 |
| 18a | 5.6062 | 9.6158 | 9.5646 | 0.0512 |
| 18b | 5.9060 | 7.4955 | 7.8744 | -0.3788 |
| 19a | 4.8642 | 8.0064 | 8.2731 | -0.2668 |
| 1b | 5.9002 | 7.9374 | 7.8878 | 0.0496 |
| 20b | 5.6507 | 6.9078 | 6.4623 | 0.4455 |
| 21a | 6.0462 | 7.3132 | 7.5516 | -0.2384 |
| 21b | 5.6546 | 8.9092 | 8.4532 | 0.4560 |
| 22a | 5.8046 | 7.6009 | 7.1079 | 0.4930 |
| 22b | 5.8002 | 7.3778 | 7.1180 | 0.2598 |
| 23a | 5.8689 | 7.1701 | 6.9599 | 0.2102 |
| 24b | 5.7926 | 6.0638 | 6.1355 | -0.0717 |
| 26a | 5.7676 | 9.3057 | 9.1931 | 0.1125 |
| 26b | 5.8920 | 7.3132 | 6.9066 | 0.4066 |
| 27a | 5.8319 | 9.2003 | 9.0450 | 0.1553 |
| 27b | 5.9663 | 7.6497 | 7.7356 | -0.0859 |
| 28b | 5.8525 | 6.7569 | 6.9975 | -0.2406 |
| 29a | 5.8267 | 9.0825 | 9.0570 | 0.0255 |
| 29b | 5.9607 | 8.2428 | 8.7484 | -0.5056 |
| 2a | 4.6529 | 8.1315 | 8.7597 | -0.6281 |
| 2b | 5.5577 | 7.1701 | 7.6763 | -0.5062 |
| 30a | 5.7913 | 8.5755 | 8.1385 | 0.4370 |
| 31a | 5.7056 | 7.3132 | 7.3358 | -0.0225 |
| 31b | 5.9145 | 8.1315 | 8.8549 | -0.7233 |
| 32b | 5.9184 | 7.1701 | 7.8458 | -0.6757 |
| 33a | 5.7524 | 7.4384 | 7.2281 | 0.2103 |
| 33b | 5.9296 | 6.2538 | 6.8200 | -0.5662 |
| 34a | 5.8837 | 7.9725 | 7.9258 | 0.0467 |
| 35a | 5.7404 | 8.0392 | 7.2558 | 0.7834 |
| 35b | 5.8956 | 5.6699 | 6.8983 | -1.2284 |
| 36b | 5.9438 | 6.0868 | 6.7874 | -0.7006 |
| 37b | 5.8532 | 5.9915 | 6.9959 | -1.0044 |
| 39b | 5.9199 | 6.9078 | 6.8424 | 0.0654 |
| 3a | 5.6610 | 7.6497 | 7.4385 | 0.2112 |
| 3b | 5.9294 | 5.5607 | 6.8206 | -1.2599 |
| 44b | 5.9348 | 6.4297 | 6.8080 | -0.3782 |
| 45b | 5.9371 | 7.1701 | 6.8027 | 0.3675 |
| 47b | 5.9539 | 7.1701 | 6.7642 | 0.4059 |
| 48b | 5.9414 | 6.3969 | 6.7930 | -0.3960 |
| 49b | 5.8956 | 6.3279 | 6.8984 | -0.5704 |
| 4a | 5.5735 | 8.9359 | 7.6399 | 1.2960 |
| 53b | 5.9012 | 7.2442 | 6.8854 | 0.3588 |
| 54b | 5.8107 | 7.1701 | 7.0938 | 0.0763 |
| 55b | 5.9243 | 6.6970 | 6.8322 | -0.1352 |
| 8a | 5.7105 | 7.3132 | 7.3247 | -0.0114 |
| Log (Activ) | Log (Estimate) | Error | |
|---|---|---|---|
| 7 | 5.5255 | 5.3455 | 0.1800 |
| 11 | 7.2703 | 7.2345 | 0.0358 |
| 16 | 7.5294 | 7.4567 | 0.0727 |
| 21 | 9.0842 | 7.3563 | 1.7279 |
| 26 | 6.6606 | 5.3455 | 1.3151 |
| 30 | 4.8363 | 3.8355 | 1.0008 |
| 34 | 7.3614 | 7.3253 | 0.0361 |
| 11a | 6.2916 | 5.7354 | 0.5562 |
| 16a | 4.2195 | 4.3323 | -0.1128 |
| 20a | 5.3936 | 5.3452 | 0.0484 |
| 24a | 4.3567 | 4.9752 | -0.6185 |
| 28a | 6.3969 | 5.3453 | 1.0516 |
| 32a | 2.9444 | 2.9968 | -0.0524 |
| 1a | 5.2470 | 4.8659 | 0.3811 |
| 15b | 4.7875 | 5.8364 | -1.0489 |
| 19b | 3.6376 | 4.7264 | -1.0888 |
| 23b | 4.9416 | 3.8563 | 1.0853 |
| 30b | 4.0254 | 4.3324 | -0.3070 |
| 34b | 3.6376 | 3.7254 | -0.0878 |
| 38b | 2.9957 | 3.2232 | -0.2275 |
| 46b | 1.6487 | 2.8675 | -1.2188 |
| 52b | 2.0149 | 2.2484 | -0.2335 |
| 56b | 1.3350 | 2.4543 | -1.1193 |
| 12b | 6.7799 | 7.2194 | -0.4395 |
| Log (Activ) | Log (Estimate) | Error | |
|---|---|---|---|
| 7 | 7.3059 | 7.1533 | 0.1526 |
| 11 | 7.6530 | 7.9863 | -0.3333 |
| 16 | 7.7267 | 7.2121 | 0.5146 |
| 21 | 6.7867 | 6.9891 | -0.2024 |
| 26 | 6.5236 | 6.3334 | 0.1902 |
| 30 | 4.8828 | 4.6276 | 0.2552 |
| 34 | 6.3969 | 6.6676 | -0.2707 |
| 11a | 8.9872 | 8.2223 | 0.7649 |
| 16a | 6.8977 | 6.5122 | 0.3855 |
| 20a | 7.9374 | 7.2231 | 0.7143 |
| 24a | 6.6333 | 6.9098 | -0.2765 |
| 28a | 8.4764 | 8.2957 | 0.1807 |
| 32a | 7.3778 | 7.5762 | -0.1984 |
| 1a | 7.5496 | 7.8894 | -0.3398 |
| 15b | 6.0403 | 5.7204 | 0.3199 |
| 19b | 6.6720 | 6.8732 | -0.2012 |
| 23b | 7.6962 | 7.9909 | -0.2947 |
| 30b | 7.0901 | 6.7925 | 0.2976 |
| 34b | 6.6720 | 6.7623 | -0.0903 |
| 38b | 7.0031 | 7.4052 | -0.4021 |
| 46b | 6.3630 | 6.8437 | -0.4807 |
| 52b | 7.1701 | 7.4923 | -0.3222 |
| 56b | 6.3969 | 6.5427 | -0.1458 |
| 12b | 8.1315 | 8.4072 | -0.2757 |
| Fit value (Hypo1B) | Fit value (Hypo1D) | |
|---|---|---|
| ZINC09157416 | 4.38886 | 0.13199 |
| ZINC19521660 | 4.33458 | 0.74828 |
| ZINC72336558 | 4.33584 | 0.22303 |
| ZINC78416371 | 4.50232 | 0.52406 |
| ZINC19521658 | 4.36043 | 0.40399 |
| -CDOCKER energy (PDE4B) | -CDOCKER energy (PDE4D) | |
|---|---|---|
| 34b | -13.0258 | -22.3445 |
| ZINC09157416 | -15.9889 | -26.7976 |


